COMPREHENSIVE SAFETY ANALYSIS 2010
S
AFETYM
EASUREMENTS
YSTEM(SMS)
M
ETHODOLOGYVersion 2.0
August 2010
Prepared for: Prepared by:
Federal Motor Carrier Safety Administration John A. Volpe National Transportation 1200 New Jersey Avenue, SE Systems Center
Washington, DC 20590 55 Broadway
Preface
This report documents the Safety Measurement System (SMS) methodology developed to support the Comprehensive Safety Analysis 2010 (CSA 2010) Initiative for the Federal Motor Carrier Safety Administration (FMCSA). The SMS is one of the major tools for measuring the safety of individual motor carriers and Commercial Motor Vehicle (CMV) drivers. Such measures help identify and monitor safety problems as part of the CSA 2010 safety improvement process.
Many of the concepts used to construct the SMS originated from the SafeStat
measurement system. SafeStat was developed at the U.S. Department of Transportation‘s John A. Volpe National Transportation Systems Center (the Volpe Center) in Cambridge, MA, under a project plan agreement with the Federal Highway Administration‘s Office of Motor Carriers, FMCSA‘s predecessor. It was designed and tested under the
Federal/State Performance & Registration Information Systems Management (PRISM) program in the mid 1990s. Since then, SafeStat has been implemented nationally to prioritize motor carriers for on-site Compliance Reviews (CRs). SafeStat output has been made available to the public via the Internet on the Analysis & Information (A&I)
website at http://www.ai.fmcsa.dot.gov.
The SMS design builds on the lessons learned from developing and implementing SafeStat for CR prioritization. However, the SMS also incorporates new CSA 2010 requirements for identifying specific types of unsafe behaviors that the entities exhibit. A more specialized set of interventions will now address these unsafe behaviors and the system will also expand the use of on-road safety violation data. In January 2008, FMCSA started an Operational Model (OM) Test of the CSA 2010 Initiative, which includes using the SMS to identify and monitor unsafe carrier and CMV driver behavior in nine states. Version 2.0 of the Methodology incorporates feedback from the OM Test and was implemented as part of the CSA 2010 Data Preview in August 2010 which provided SMS results to carriers nationally. Future SMS development will be part of a continuous improvement process based on results and feedback.
The Volpe Center Technical Project Manager for developing the SMS is David Madsen of the System Measurement and Analysis Division of the Center for Safety Management Systems. Eran Segev, also of the System Measurement and Analysis Division, headed the analysis leading to the SMS design and methodology. Further technical support was provided by the following Volpe Center staff: Lee Biernbaum, Kevin Gay, Gustaf Lawson, Richard (Kha) Nguyen, Amy Olanyk, Jonathan Pearlman and Scott Smith.
Table of Contents
List of Figures ... iii
List of Tables ... iii
Glossary ... v
Glossary ... v 1. Introduction ... 1-1 2. Design of the SMS ... 2-1 2.1 Description of BASICs and Crash Indicator ... 2-1 2.2 Data Sources ... 2-2 2.3 Carrier BASICs Rankings in SMS ... 2-3 2.4 SMS Design Features ... 2-4 2.4.1 Violation Severity ... 2-4 2.4.2 Crash Severity ... 2-4 2.4.3 Time Weights ... 2-4 2.4.4 Normalization ... 2-4 2.4.5 Segmentation... 2-5 2.4.6 Safety Event Groups ... 2-5 2.4.7 Data Sufficiency... 2-5 2.4.8 Percentile Rank ... 2-5 2.5 Differences Between SafeStat and the SMS ... 2-5 3. CSMS Methodology ... 3-1 3.1 Unsafe Driving BASIC Assessment ... 3-1 3.1.1 Calculation of BASIC Measure ... 3-1 3.1.2 Calculation of BASIC Percentile Rank... 3-3 3.2 Fatigued Driving (HOS) BASIC Assessment ... 3-4 3.2.1 Calculation of BASIC Measure ... 3-5 3.2.2 Calculation of BASIC Percentile Rank... 3-6 3.3 Driver Fitness BASIC Assessment ... 3-6 3.3.1 Calculation of BASIC Measure ... 3-7 3.3.2 Calculation of BASIC Percentile Rank... 3-8 3.4 Controlled Substances/Alcohol BASIC ... 3-9 3.4.1 Calculation of BASIC Measure ... 3-9 3.4.2 Calculation of BASIC percentile rank ... 3-10 3.5 Vehicle Maintenance BASIC Assessment ... 3-11 3.5.1 Calculation of BASIC Measure ... 3-11 3.5.2 Calculation of BASIC Percentile Rank... 3-12 3.6 Cargo-Related BASIC Assessment... 3-13 3.6.1 Calculation of BASIC Measure ... 3-13
3.6.2 Calculation of BASIC Percentile Rank... 3-14 3.7 Crash Indicator Assessment ... 3-15 3.7.1 Calculation of Crash Indicator Measure ... 3-15 3.7.2 Calculation of Crash Indicator Percentile Rank... 3-18 4. DSMS Methodology ... 4-1 4.1 Unsafe Driving BASIC and Controlled Substances/Alcohol BASIC Assessment
4-1
4.1.1 Calculation of BASIC Measure ... 4-2 4.1.2 Calculation of BASIC Percentile Rank... 4-2 4.2 Fatigued Driving (HOS) BASIC and Driver Fitness BASIC Assessment ... 4-3 4.2.1 Calculation of BASIC Measure ... 4-3 4.2.2 Calculation of BASIC Percentile Rank... 4-4 4.3 Vehicle Maintenance BASIC and Cargo-Related BASIC Assessment ... 4-5 4.3.1 Calculation of BASIC Measure ... 4-5 4.3.2 Calculation of BASIC Percentile Rank... 4-6 4.4 Crash Indicator Assessment ... 4-7 4.4.1 Calculation of Crash Indicator Measure ... 4-7 4.4.2 Calculation of Crash Indicator Percentile Rank... 4-8 5. Sample SMS Output ... 5-1 6. SMS Report – Summary/Next Steps ... 6-4 Appendix A ...A-1 Appendix B ... B-1
List of Figures
Figure 1-1. CSA 2010 Operational Model ... 1-1 Figure 2-2-1. BASICs Ranking Process ... 2-3 Figure 5-1. CSMS Screenshot... 5-2 Figure 5-2. DSMS Screenshot ... 5-3
List of Tables
Table 3-1. VMT per PU for Combo Segment... 3-3 Table 3-2. VMT per Average PU for Straight Segment ... 3-3 Table 3-3. Safety Event Group Categories for Unsafe Driving BASIC ... 3-4 Table 3-4. Safety Event Group Categories for the Fatigued Driving (HOS) BASIC ... 3-6 Table 3-5. Safety Event Group Categories for the Driver Fitness BASIC ... 3-8
Table 6. Safety Event Group Categories for Controlled Substances/Alcohol BASIC .. 3-10
Table 3-7. Safety Event Group Categories for the Vehicle Maintenance BASIC ... 3-12 Table 3-8. Safety Event Group Categories for the Cargo-Related BASIC... 3-15 Table 3-9. Crash Severity Weights for Crash Indicator ... 3-16 Table 3-10. VMT per PU for Combo Segment... 3-17 Table 3-11. VMT per Average PU for Straight Segment ... 3-18 Table 3-12. Safety Event Group Categories for Crash Indicator ... 3-18 Table 4-1. Safety Event Group Categories for Fatigued Driving (HOS) and Driver
Fitness BASICs ... 4-5 Table 4-2. Safety Event Group Categories for Vehicle Maintenance and Cargo-Related
BASICs ... 4-7 Table 4-3. Crash Severity Weights for Crash Indicator ... 4-8
Glossary
BASIC Behavior Analysis and Safety Improvement Categories
CMV Commercial Motor Vehicle
CR Compliance Review
CRWG Compliance Review Work Group
CSA 2010 Comprehensive Safety Analysis 2010 CSMS Carrier Safety Measurement System DIR Driver Information Resource DSMS Driver Safety Measurement System
FMCSA Federal Motor Carrier Safety Administration FMCSR Federal Motor Carrier Safety Regulations HAZMAT Hazardous Materials
HMR Hazardous Materials Regulations
HOS Hours-Of-Service
LTCCS Large Truck Crash Causation Study
MCMIS Motor Carrier Management Information System MCSAP Motor Carrier Safety Assistance Program NGA National Governors Association
NTSB National Transportation Safety Board
OOS Out-Of-Service
OM Operational Model
PU Power Unit
PRISM Performance and Registration Information Systems Management
SafeStat Motor Carrier Safety Status Measurement System
SEA Safety Evaluation Area
SFD Safety Fitness Determination
SMS Safety Measurement System
USDOT U.S. Department of Transportation VSAS
VMT
Violation Severity Assessment Study Vehicle Miles Travelled
1.
Introduction
The Federal Motor Carrier Safety Administration (FMCSA) is developing a new OM through its Comprehensive Safety Analysis 2010 (CSA 2010) Initiative. The goal of CSA 2010 is to develop and implement more effective and efficient ways for FMCSA, its state partners, and the trucking industry to reduce CMV crashes, fatalities, and injuries. CSA 2010 will help FMCSA and its state partners to impact the safety behavior of more carriers and drivers, use continually improving data to better identify high-risk carriers and drivers, and apply a wider range of interventions to reduce high-risk behavior.1
As part of this effort, FMCSA has identified the attributes of a model for safety oversight that it considers ideal: flexibility, efficiency, effectiveness, innovation, and equity. The CSA 2010 OM, shown below, features continuous monitoring and tracking of entities‘ safety performance. Entities may be either carriers or drivers. All entities found with problematic safety behavior will be subject to the intervention process.
Figure 1-1. CSA 2010 Operational Model
The Safety Measurement System
Within the CSA 2010 OM, the Safety Measurement System (SMS) quantifies the on-road safety performance of individual entities to:
Identify entities for interventions. The SMS will be a key component in determining the inclusion of entities with significant safety problems into the CSA 2010 intervention process.
Determine the specific safety problems an entity exhibits. The SMS allows enforcement officers to identify the specific safety problems the system highlights and to surgically address them through a tailored set of interventions.
Monitor safety problems throughout the intervention process. The SMS will continuously monitor on-road performance to assess whether an entity‘s safety performance has improved enough for it to exit the intervention process, or if further intervention is warranted.
Support FMCSA‘s proposed Safety Fitness Determination (SFD) process. The SMS results can be an important factor in determining the safety fitness of entities. The SMS will identify the entities demonstrating the worst safety performance so they can be considered for an ―Unfit‖ safety determination. Details on the proposed process will be available as for public comment as part of upcoming Notice of Proposed Rulemaking.
In addition to supporting the CSA 2010 OM, the SMS results can provide other
stakeholders with valuable safety information. The SMS results will be easily accessible via the Internet to encourage improvements in motor carrier safety. Findings from the SMS will allow the evaluated entities an assessment of their weaknesses in various safety areas. Thus, the SMS will empower carriers and other firms (e.g. shippers, insurers) involved with the motor carrier industry to make safety-based business decisions.
2.
Design of the SMS
The SMS is a tool for assessing available roadside performance data. These data are used to rank an entity‘s relative performance in any of six Behavior Analysis and Safety Improvement Categories (BASICs) as well as crash involvement (Crash Indicator). Law enforcement will use rankings within these BASICs and the Crash Indicator to select entities for appropriate interventions.
2.1 Description of BASICs and Crash Indicator
The CSA 2010 team developed the BASICs under the premise that CMV crashes can be traced to the behavior of motor carriers and/or drivers. The behavior categories are derived based on information from a number of sources: Large Truck Crash Causation Study (LTCCS);2 CSA 2010 Driver History Study; the existing FMCSA regulatory structure; and analysis conducted under FMCSA‘s Compliance Review Workgroup (CRWG), the predecessor to CSA 2010. The BASICs are defined as follows:
Unsafe Driving BASIC—Operation of CMVs in a dangerous or careless manner. Example violations: speeding, reckless driving, improper lane change, and
inattention.
Fatigued Driving (Hours-Of-Service) BASIC—Operation of CMVs by drivers who are ill, fatigued, or in non-compliance with the Hours-Of-Service (HOS) regulations. This BASIC includes violations of regulations surrounding the complete and accurate recording of logbooks as they relate to HOS requirements and the management of CMV driver fatigue. Instances related to the Fatigued Driving (HOS) BASIC are distinguished from incidents where unconsciousness or an inability to react is brought about by the use of alcohol, drugs, or other controlled substances. Example violations: HOS, logbook, and operating a CMV while ill or fatigued.
Driver Fitness BASIC—Operation of CMVs by drivers who are unfit to operate a CMV due to lack of training, experience, or medical qualifications. Example violations: failing to have a valid and appropriate commercial driver's license and being medically unqualified to operate a CMV.
Controlled Substances/Alcohol BASIC—Operation of CMVs by drivers who are impaired due to alcohol, illegal drugs, and misuse of prescription or over-the-counter medications. Example violations: use or possession of controlled substances or alcohol.
Vehicle Maintenance BASIC—Failure to properly maintain a CMV. Example violations: brakes, lights, and other mechanical defects, and failure to make required repairs.
2 Daniel Blower and Kenneth L. Campbell, Large Truck Crash Causation Study Analysis Brief, February
Cargo-Related BASIC—Failure to properly prevent shifting loads, spilled or dropped cargo, and unsafe handling of hazardous materials on a CMV. Example violations: improper load securement, cargo retention, and hazardous material handling.
Additionally, the SMS evaluates an entity‘s crash history. Crash history is not specifically a behavior. Rather, it is a consequence of a behavior and may indicate a problem with the entity that warrants intervention. The Crash Indicator is defined as follows:
Crash Indicator—Histories or patterns of high crash involvement, including frequency and severity. It is based on information from state-reported crash reports.
The SMS will initially focus on the two types of entities most likely to impact the BASICs and Crash Indicator: motor carriers and CMV drivers. Therefore, two measurement systems were designed for CSA 2010:
Carrier Safety Measurement System (CSMS) Driver Safety Measurement Systems (DSMS)
2.2 Data Sources
Both CSMS and DSMS assess an individual entity‘s performance by BASIC and Crash Indicators calculated from information collected during on-road safety inspections and state-reported CMV crash records. These data are recorded in the Motor Carrier
Management Information System (MCMIS). In addition, motor carrier Census data, also recorded in MCMIS, are used for the identification and normalization of safety event data. Below are more detailed descriptions of each data source:
Roadside Inspections are examinations a Motor Carrier Safety Assistance Program (MCSAP) inspector conducts on individual CMVs and drivers to determine if they are in compliance with the Federal Motor Carrier Safety Regulations (FMCSRs) and/or Hazardous Materials Regulations (HMRs). Violations are recorded during inspections and are entered into the MCMIS database. A subset of these violations results in driver or vehicle Out-of-Service (OOS) orders. These OOS violations must be corrected before the affected driver or vehicle is allowed to return to service. The SMS assessments are based on the safety violations listed in Appendix A. These assessments, however, do not include those violations that are: (1) a result of a crash3or (2) assigned to another
entity such as a shipper or Intermodal Equipment Provider.
Note: Some roadside inspections are performed following a traffic enforcement
stop for a moving violation. Violations reported during such stops do not always
3Only pre-existing violations from post-crash inspections are used in the SMS. Violations recorded in
result in the issuance of a citation to the driver, but are used in the SMS whether or not a citation is issued.
State-Reported Commercial Vehicle Crash Data are taken from MCMIS and provide information on crashes as reported by state and local police officials. The reporting of these crashes follows National Governors Association (NGA)
standards.
Motor Carrier Census Dataare first collected when a carrier obtains a USDOT number. The Census data are primarily collected from: (1) Form MCS-150, filled out by the carrier, and (2) Form MCS-151, filled out by law enforcement as part of an investigation. Carriers are required to update their MCS-150 information biennially. Carriers domiciled in states participating in Performance and
Registration Information Systems Management (PRISM) Program update their Census data as part of the CMV registration process. The CSMS uses Census data for identification and normalization of safety-related data. Examples of Census data include USDOT number, carrier name, number and type of Power Units (PUs), annualized vehicle miles travelled (VMT), physical location, current status, and types of cargo hauled.
2.3 Carrier BASICs Rankings in SMS
Four principal steps are used to assess an entity‘s performance in each BASIC and the Crash Indicator. First, relevant inspection, violation, and crash data obtained from MCMIS are attributed to an entity to create a safety event history for the entity. Each entity‘s violations are classified into a BASIC and are then time weighted, severity weighted, and normalized to form a quantifiable measure for an entity in each BASIC. Based on a comparison of each entity‘s BASIC measure to other entities with a similar number of safety events, a rank and percentile are assigned. These steps are illustrated in Figure 2-1. The SMS applies similar steps to crash data to calculate carrier Crash
Indicator percentiles. Safety Events by Entity BASIC Data Rank/ Percentile BASIC Measures
2.4 SMS Design Features
The conversion of an entity‘s safety data into a BASIC measure, and rank/percentile involves the application of several SMS design features as discussed below.
2.4.1 Violation Severity
All roadside inspection violations that pertain to a BASIC are assigned severity weights that reflect their association with crash occurrence and crash consequences. The severity weights help differentiate the levels of crash risk associated with the various violations attributed to each BASIC. The violation severity weights are assigned on a 1 to 10 scale, where 1 represents the lowest crash risk and 10 represents the highest crash risk relative to the other violations in the BASIC. Within certain BASICs, additional severity weight is applied to violations that resulted in driver or vehicle OOS orders. The severity
weighting is based on analysis that quantified the extent of these associations between violation and crash risk, as well as on input from enforcement subject matter experts. Because the weights reflect the relative importance of each violation within each particular BASIC, they cannot be compared meaningfully across the various BASICs. See Appendix A for more information about the severity weights.
2.4.2 Crash Severity
Crashes are assigned severity weights according to their impact. Greater weight is attributed to crashes involving injuries, fatalities, and/or crashes involving the release of hazardous materials than to crashes only resulting in a vehicle tow-away.
2.4.3 Time Weights
All safety events are assigned a time weight. The time weight of an event decreases with time. This decline results in more recent events having a greater impact on an entity‘s BASIC and Crash Indicator measures than events from the more distant past. When safety events become older than two years, they are no longer used to assess a carrier‘s safety in the SMS.
2.4.4 Normalization
BASIC and Crash Indicator measures are normalized to reflect differences in exposure among entities. The normalization approach varies depending on what is being
measured.
The SMS normalizes for the number of driver inspections with driver-related BASICs, whereas vehicle inspections are used for normalization within vehicle-related BASICs. Therefore, the number of driver inspections normalizes the Fatigued Driving (HOS), Driver Fitness and Controlled Substances/Alcohol measures, while the number of vehicle inspections normalizes the Vehicle Maintenance and Cargo-Related measures.
While violations of the above BASICs are discovered during an inspection, a distinction is made for behaviors that usually prompt an inspection. For this reason, the SMS normalizes the Unsafe Driving BASIC measure by carrier size (i.e., a hybrid power unit (PU) and vehicle miles travelled (VMT) measure), instead of by number of inspections. Similarly, the Crash Indicator is also normalized by carrier size.
2.4.5 Segmentation
The Unsafe Driving BASIC and Crash Indicator account for carrier differences by segmenting the carrier population into two groups based on the types of vehicles operated. The segmentation of the carriers means companies that have fundamentally different types of vehicles/operations are not compared to each other. The two segments are: ―Combo‖ or combination trucks/motor coach buses constituting 70% or more of the total power units and ―Straight‖ or straight trucks/other vehicles constituting more than 30% of the total power units.
2.4.6 Safety Event Groups
To further account for the differences among carriers, the SMS places carriers in safety event groups based on the number of safety events (e.g., inspections, crashes) in which the carriers have been involved. This tiered approach accounts for the inherent greater variability in rates based on small samples or limited levels of exposure and the stronger level of confidence in measures based on larger levels of exposure. The safety event grouping also allows the CSMS to handle the widely diverse motor carrier population, while ensuring that similarly situated carriers are treated with the same standards.
2.4.7 Data Sufficiency
The SMS employs data sufficiency standards to ensure that there are enough inspections or crashes to produce meaningful measures of safety for carriers. In instances where the safety performance of an entity can potentially lead to incursion of CSA 2010
interventions or detrimental SFD outcome, additional data sufficiency tests are employed. These tests ensure a ―critical mass‖ of poor performance data or a pattern of violations before adverse action is taken upon an entity.
2.4.8 Percentile Rank
The SMS uses the measures to assign a percentile ranking to each BASIC and Crash Indicator. Each measure is a quantifiable determination of safety behavior. Percentile ranking allows the safety behavior of a carrier to be compared with the safety behavior of carriers with similar numbers of safety events. Within each safety event group, a
percentile is computed on a 0 –100 scale for each entity that receives a non-zero measure, with 100 indicating the worst performance.
Carriers with percentiles above a certain threshold and meeting minimum data sufficiency requirements in a BASIC or Crash Indicator can be deemed poor safety performers. These entities will be identified for CSA 2010‘s Intervention process.
2.5 Differences Between SafeStat and the SMS
The SMS offers several improvements over FMCSA‘s existing carrier measurement system, SafeStat. Some of the key differences are listed below.
The SMS is organized by specific behaviors whereas SafeStat is organized into four general Safety Evaluations Areas (SEAs).
SafeStat assesses carriers in four Safety Evaluation Areas (SEAs)—Accident, Driver, Vehicle, and Safety Management—whereas the SMS measures each entity in six
behavioral categories (i.e., the BASICs) and the Crash Indicator. The specific behavioral metrics in the SMS provide a more detailed level of measurement that can be used to describe, evaluate, and address entity safety. For example, SafeStat indicates that an entity has general driver issues according to its Driver SEA value, while the SMS
provides information on the specific driver behavior (i.e., Controlled Substances/Alcohol, Fatigued Driving (HOS), Unsafe Driving, and Driver Fitness) that needs modification and/or attention. The more specific organization of the SMS‘s BASICs often allows the discovery of serious safety problems that go undetected under SafeStat‘s more
generalized SEA structure. This is particularly important for BASICs related to driver behavior given that recent research (e.g. the LTCCS) has highlighted driver behavior as increasingly relevant to crash occurrence.
The SMS identifies specific safety problems so that CSA 2010 interventions can address them in a surgical manner; the SafeStat score is based on grouping safety problems together to identify carriers for a one-size-fits-all CR.
Through the measurement of an entity‘s safety performance by behavior, and the
targeting of an intervention to the entity‘s specific behavior, the CSA 2010 OM provides an integrated approach to measuring and improving CMV safety. The alignment of both the SMS and intervention selection through BASICs and the Crash Indicator allows FMCSA to identify both the entity for intervention as well as the specific safety problem that should be surgically addressed. This approach will lead to more efficient and effective use of enforcement resources directed towards improving motor carrier safety.
The SMS uses all safety-based inspection violations while SafeStat uses only OOS violations and selected moving violations from inspections.
The inclusion of all safety-based inspection violations in the SMS fully leverages the results of the roadside inspection program (3.5 million inspections annually) and provides a more comprehensive evaluation of an entity‘s on-road safety performance.
The SMS utilizes risk-based violation weightings while SafeStat does not.
Although the SMS utilizes all safety-based inspection violations in the SMS, it is recognized that not all violations pose the same crash risk. Therefore, violations in the SMS are weighted according to the relationship that the violation may cause, contribute to, or exacerbate the outcome of CMV crash. Violations shown to have a larger impact on crash risk will have a stronger detrimental impact on an entity‘s BASIC measure. The risk-based weighting of violations will provide a risk-based assessment of an entity‘s performance in each BASIC.
The SMS will feed the Safety Fitness Determination (SFD) of an entity while SafeStat has no impact on an entity’s safety rating.
Currently SafeStat prioritizes carriers for CRs. Based strictly on the results of the CR, FMCSA provides a SFD in the form of a safety rating to a carrier. Under CSA 2010, FMCSA will consider the results of the SMS along with the results of interventions in
generating a carrier‘s SFD. With this approach, all violations can be considered when determining safety fitness, not just the more severe ones from CRs as is now done with SFD. Carrier SMS results can impact the SFD in two ways. First, poor CSMS results can prompt further examination through the CSA 2010 Intervention Process. Major violations found during the Intervention Process can adversely impact a carrier‘s SFD. Secondly, the SFD can be calculated solely on the basis of on-road performance by comparing a carrier‘s absolute BASIC measures, not relative percentiles, to a pre-set BASIC measurement standard. Adverse SFD can occur when a carrier‘s measures do not meet or exceed the standard. This new SFD procedure places strong emphasis on carrier on-road performance in determining overall carrier safety fitness. This approach
addresses one of the National Transportation Safety Board‘s (NTSB) long-standing recommendations that a carrier‘s poor on-road performance alone should have a detrimental impact on its SFD.
The SMS assesses individual drivers and carriers while SafeStat assesses only carriers.
Currently, most of the focus of FMCSA safety programs and enforcement has been on motor carriers. In the future, the DSMS will allow FMCSA to identify unsafe drivers for interventions based on their inspection and crash history across all employers (former and current). Given the often transient nature of driver employment, the DSMS will be a valuable tool for FMCSA to address driver-specific problems that cannot be easily handled at the motor carrier level. The DSMS may eventually be a valuable tool for motor carriers to monitor their own drivers and assess prospective hires. These efforts will encourage safe and compliant behavior among CMV drivers and will enable carriers to consider drivers‘ safety histories when making hiring decisions.
3.
CSMS Methodology
The following sections describe the CSMS methodology used to calculate the
measurement and percentile of each BASIC and the Crash Indicator for individual motor carriers.
3.1 Unsafe Driving BASIC Assessment
This section describes the calculation of carrier measures and percentile ranks in the Unsafe Driving BASIC. This BASIC is defined as:
Operating CMVs in a dangerous or careless manner. Example violations: speeding, reckless driving, improper lane change, and inattention. See Appendix A for a complete list of roadside inspection violations used in the SMS.
The CSMS assesses the Unsafe Driving BASIC using relevant violations of FMCSRs recorded during roadside inspections and reported in MCMIS. Individual carriers‘ BASIC measures also incorporate carrier size in terms of power units (PUs) and annual vehicle miles travelled (VMT). These measures are used to generate percentile ranks that reflect each carrier‘s driver safety posture relative to carriers in the same segment with similar numbers of inspections with violations.
3.1.1 Calculation of BASIC Measure
The BASIC measures for the Unsafe Driving BASIC are calculated as the sum of severity and time weighted applicable violations divided by carrier average PUs times a
Utilization Factor, as follows:
Factor n Utilizatio PUs Average violations applicable weighted severity and time of Total Measure BASIC * Equation 3-1
In this equation, the terms are defined as follows:
Applicable Violation is defined as any violation recorded in any level roadside inspection that matches the FMCSR and HMR cites listed for Unsafe Driving (Table 1, Appendix A) and during the past 24 months. In cases of multiple counts of the same violation, the CSMS only uses each violation cite once per inspection.
Note: Some roadside inspections are performed following a traffic enforcement
stop for a moving violation. Violations reported during such stops do not always result in the issuance of a citation to the driver, but are used in the SMS whether or not a citation is issued.
A Severity Weight from 1 (less severe) to 10 (most severe) is assigned to each applicable violation. See the Unsafe Driving Table (Table 1, Appendix A) for the severity weights corresponding to each violation. The severity weighting of each
violation cite accounts for the level of crash risk relative to the other violation cites used in the BASIC measurement. The sum of all severity weights yielded by any one inspection for violations in any one BASIC is capped at a maximum of 30. This cap of 30 is applied before the severity weights are multiplied by the time weight.
A Time Weight of 1, 2 or 3 is assigned to each applicable violation based on how long ago it was recorded. Violations recorded in the past 6 months receive a time weight of 3. Violations recorded between 6 and 12 months ago receive a time weight of 2. All violations recorded earlier (older than 12 months but within the past 24 months) receive a time weight of 1. This time weighting places more emphasis on recent violations relative to older violations.
Time and Severity Weighted Violation is a violation‘s severity weight multiplied by its time weight.
Average Power Units (PUs) is used in part to account for each carrier‘s level of exposure when calculating the BASIC measure. The BASIC violations are normalized by the number of owned, term-leased, and trip-leased PUs (trucks, tractors, hazardous-material tank trucks, motor coaches, and school buses) contained in the Census data. The average PUs for each carrier is calculated using (i) the carrier‘s current number of PUs, (ii) the number of PUs the carrier had 6 months ago, and (iii) the number of PUs the carrier had 18 months ago. The average PU calculation is shown below:
3 ) 18 ( ) 6 ( ) ( )
(average PU current PU Months PU Months PU
Equation 3-2
Utilization Factor is a multiplier that adjusts the Average PU values based on the utilization in terms of vehicle miles travelled (VMT) per Average PU where VMT data in the past 24 months are available. The primary sources of VMT
information in the Census are: (1) Form MCS-150, filled out by the carrier, and (2) Form MCS-151, filled out by law enforcement as part of an investigation. Carriers are required to update their MCS-150 information biennially. In cases where the VMT data has been obtained multiple times over the past 24 months for the same carrier, the most current positive VMT figure is used. The Utilization Factor is calculated by the following three steps:
(i) Carrier Segment
There are two segments that each motor carrier falls into:
―Combo‖ – combination trucks/motor coach buses constituting 70% or
more of the total PU.
―Straight‖ – straight trucks/other vehicles constituting more than 30% of the total PU.
(ii) VMT per Average PU
The VMT per Average PU is derived by taking most recent positive VMT data and dividing it by the average PUs (defined above).
(iii) Utilization Factor
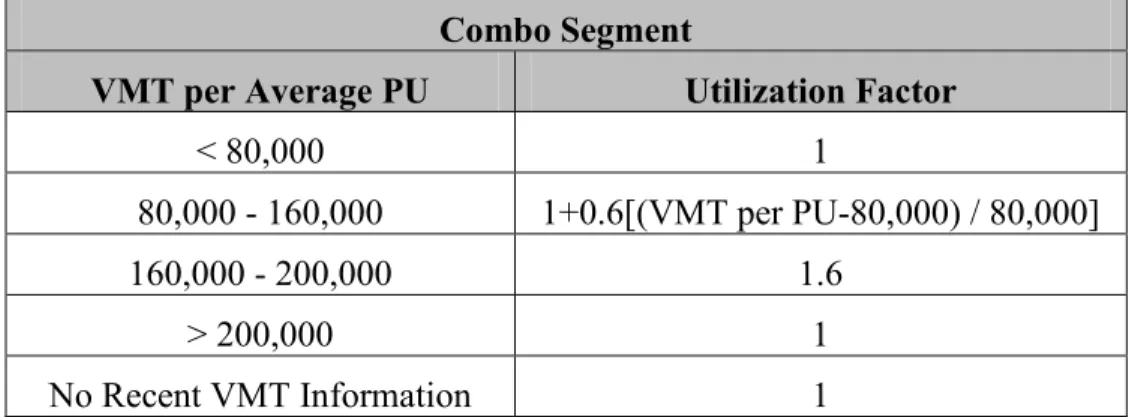
Given the information in (i) and (ii) the Utilization Factor are determined from the following tables:
Combo Segment
VMT per Average PU Utilization Factor
< 80,000 1
80,000 - 160,000 1+0.6[(VMT per PU-80,000) / 80,000]
160,000 - 200,000 1.6
> 200,000 1
No Recent VMT Information 1
Table 3-1. VMT per PU for Combo Segment Straight Segment
VMT per Average PU Utilization Factor
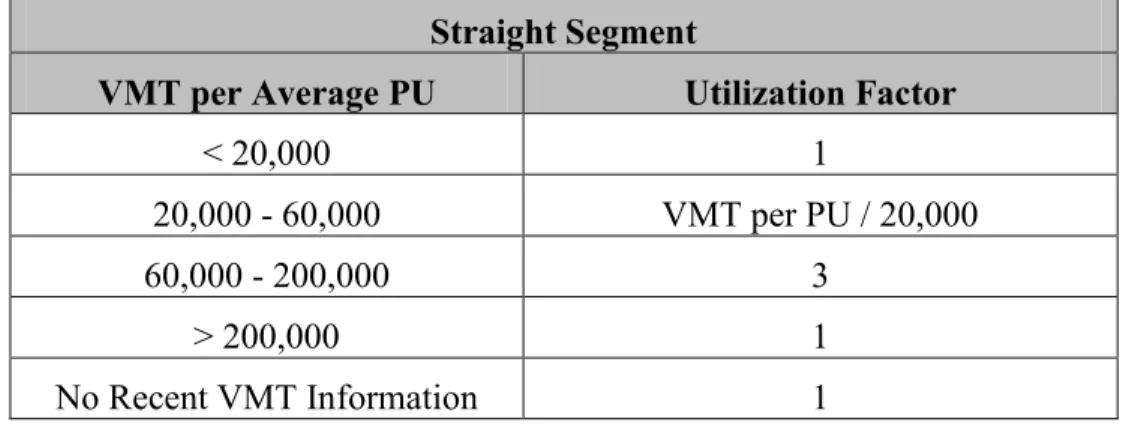
< 20,000 1
20,000 - 60,000 VMT per PU / 20,000
60,000 - 200,000 3
> 200,000 1
No Recent VMT Information 1
Table 3-2. VMT per Average PU for Straight Segment 3.1.2 Calculation of BASIC Percentile Rank
Based on the BASIC measures, the CSMS applies data sufficiency standards and safety event grouping to assign a percentile rank to carriers that can then potentially receive a CSA 2010 intervention or detrimental SFD. The calculation is as follows:
A. Determine the carrier‘s segment:
―Combo‖ – combination trucks/motor coach buses constituting 70% or
more of the total PU.
―Straight‖ – straight trucks/other vehicles constituting more than 30% of the total PU.
B. Determine the total number of inspections with at least one BASIC violation and remove carriers with less than three such inspections. For the remaining carriers, place each carrier into one of five groups based on the carrier segment and the number of inspections with an Unsafe Driving violation:
Safety Event Group Category
Combo Segment: Number of Inspections with
Unsafe Driving Violations
Straight Segment: Number of Inspections with
Unsafe Driving Violations
1 3-8 3-4
2 9-21 5-8
3 22-57 9-18
4 58-149 19-49
5 150+ 50+
Table 3-3. Safety Event Group Categories for Unsafe Driving BASIC C. Within each group, rank all the carriers‘ BASIC measures in ascending order.
Transform the ranked values into percentiles from 0 (representing the lowest BASIC measure) to 100 (representing the highest BASIC measure).
Eliminate carriers whose violations in the BASIC are all older than twelve months. Carriers that remain retain the previously calculated percentile.
3.2 Fatigued Driving (HOS) BASIC Assessment
This section describes the calculation of carrier measures and percentile ranks in the Fatigued Driving (HOS) BASIC. This BASIC is defined as:
Operating CMVs by drivers ill, fatigued, or in non-compliance with the Hours-Of-Service (HOS) regulations. This BASIC includes violations of regulations surrounding the complete and accurate recording of logbooks as they relate to HOS requirements and the management of CMV driver fatigue. Instances related to the Fatigued Driving (HOS) BASIC are distinguished from incidents where unconsciousness or an inability to react is brought about by the use of alcohol, drugs, or other controlled substances. Example violations include: HOS, logbook, and operating a CMV while ill or fatigued. See Appendix A for a complete list of roadside inspection violations used in the SMS.
The CSMS assesses the Fatigued Driving (HOS) BASIC using relevant violations recorded during roadside inspections to calculate a measure for motor carriers. These measures are used to generate percentile ranks that reflect each carrier‘s safety posture relative to carriers with similar numbers of relevant inspections.
3.2.1 Calculation of BASIC Measure
The equation used for calculating Fatigued Driving (HOS) BASIC measures is as follows: s inspection relevant of weight time Total violations applicable weighted severity and time of Total Measure BASIC Equation 3-3
In this equation, the terms are defined as follows:
Applicable Violation is any violation recorded in any level roadside inspection that matches the FMCSRs and HMRs listed for Fatigued Driving (HOS) (Table 2, Appendix A) during the past 24 months. The CSMS only uses each violation cite once per inspection in cases of multiple counts of the same violation.
A Relevant Inspection is any Driver Inspection (Level 1, 2, 3 or 6), including those that do not result in a violation in the BASIC, or any other inspection resulting in applicable BASIC violation.
A Severity Weight is assigned to each applicable violation, with a value
dependent on two parts: (i) the level of crash risk relative to the other violations comprising the BASIC measurement, and (ii) whether or not the violation resulted in an OOS condition.
(i) The level of crash risk is assigned to each applicable violation ranging from 1 (less severe) to 10 (most severe); see the Fatigued Driving (HOS) table (Table 2, Appendix A) for the violations‘ corresponding severity weights.
(ii) An OOS weight of 2 is then added to the severity weight of OOS violations. In cases of multiple counts of the same violation, the OOS weight of 2 applies if any of the counts of the violation are OOS. The sum of all severity weights yielded by any one inspection for violations in any one BASIC is capped at a maximum of 30. This cap of 30 is applied before the severity weights are multiplied by the time weight.
A Time Weight of 1, 2 or 3 is assigned to each applicable violation and each relevant inspection based on its age. Violations recorded in the past 6 months receive a time weight of 3. Violations recorded between 6 and 12 months ago receive a time weight of 2. All violations recorded earlier (older than 12 months but within the past 24 months) receive a time weight of 1. Using the exact same time weight scheme, time weights are assigned to each relevant inspection, regardless of whether or not an inspection yielded an applicable violation. This time weighting places more emphasis on results of recent inspections relative to older inspections.
Time and Severity Weighted Violation is a violation‘s severity weight multiplied by its time weight.
3.2.2 Calculation of BASIC Percentile Rank
Based on the BASIC measures, the CSMS applies data sufficiency standards and safety event grouping to assign a percentile rank to carriers that can then potentially receive a CSA 2010 intervention or detrimental SFD. The calculation is as follows:
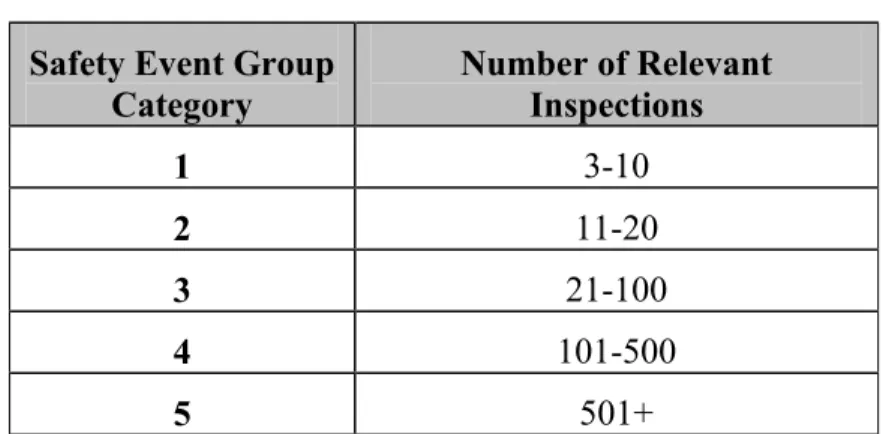
A. Determine the total number of relevant inspections and number of inspections with at least one BASIC violation. For the Fatigued Driving (HOS) BASIC, remove carriers with (1) less than three relevant driver inspections or (2) no inspections resulting in at least one BASIC violation. For the remaining carriers, place each carrier into one of five groups based on the number of relevant inspections:
Safety Event Group
Category Number of Relevant Inspections
1 3-10
2 11-20
3 21-100
4 101-500
5 501+
Table 3-4. Safety Event Group Categories for the Fatigued Driving (HOS) BASIC
B. Within each group, rank all the carriers‘ BASIC measures in ascending order. Transform the ranked values into percentiles from 0 (representing the lowest BASIC measure) to 100 (representing the highest BASIC measure).
Eliminate carriers that meet both of the following criteria: (1) no violation was recorded in the BASIC during the previous twelve months, and (2) no
violation in the BASIC was recorded during the latest relevant inspection. For the remaining carriers with three or more relevant inspections resulting in a Fatigued Driving (HOS) BASIC violation, assign the percentile values to each carrier‘s BASIC.
3.3 Driver Fitness BASIC Assessment
This section describes the calculation of carrier measures and percentile ranks in the Driver Fitness BASIC. This BASIC is defined as:
Operating CMVs by drivers who are unfit to operate a CMV due to lack of training, experience, or medical qualifications. Example violations: failing to have a valid and appropriate commercial driver's license and being medically unqualified to operate a CMV. See Appendix A for a complete list of roadside inspection violations used in the SMS.
The CSMS assesses the Driver Fitness BASIC using relevant violations recorded during roadside inspections to calculate a measure for individual motor carriers. These measures are used to generate percentile ranks that reflect each carrier‘s driver safety posture relative to carriers with similar numbers of relevant inspections.
3.3.1 Calculation of BASIC Measure
The equation used for calculating the BASIC measure for Driver Fitness is as follows:
s inspection relevant of weight time Total violations applicable weighted severity and time of Total Measure BASIC Equation 3-4
In this equation, the terms are defined as follows:
Applicable Violation is any violation recorded in any level roadside inspection that matches the FMCSRs and HMRs listed for Driver Fitness (Table 3, Appendix A) during the past 24 months. The CSMS only uses each violation cite once per inspection in cases of multiple counts of the same violation.
A Relevant Inspection is any Driver Inspection (Level 1, 2, 3 or 6), including those that do not result in a violation in the BASIC, or any other inspection resulting in applicable BASIC violation.
A Severity Weight is assigned to each applicable violation, with a value
dependent on two parts: (i) the level of crash risk relative to the other violations comprising the BASIC measurement, and (ii) whether or not the violation resulted in an OOS condition.
(i) The level of crash risk is assigned to each applicable violation ranging from 1 (less severe) to 10 (most severe); see the Driver Fitness table (Table 3, Appendix A) for the violations‘ corresponding severity weights.
(ii) An OOS weight of 2 is then added to the severity weight of OOS violations. In cases of multiple counts of the same violation, the OOS weight of 2 applies if any of the counts of the violation are OOS. The sum of all severity weights yielded by any one inspection for violations in any one BASIC is capped at a maximum of 30. This cap of 30 is applied before the severity weights are multiplied by the time weight.
A Time Weight of 1, 2 or 3 is assigned to each applicable violation and each relevant inspection based on its age. Violations recorded in the past 6 months
receive a time weight of 3. Violations recorded between 6 and 12 months ago receive a time weight of 2. All violations recorded earlier (older than 12 months but within the past 24 months) receive a time weight of 1. Using the exact same time weight scheme, time weights are assigned to each relevant inspection, regardless of whether or not an inspection yielded an applicable violation. This time weighting places more emphasis on results of recent inspections relative to older inspections.
Time and Severity Weighted Violation is a violation‘s severity weight multiplied by its time weight.
3.3.2 Calculation of BASIC Percentile Rank
Based on the BASIC measures, the CSMS applies data sufficiency standards and safety event grouping to assign a percentile rank to carriers that can then potentially receive a CSA 2010 intervention or detrimental SFD. The calculation is as follows:
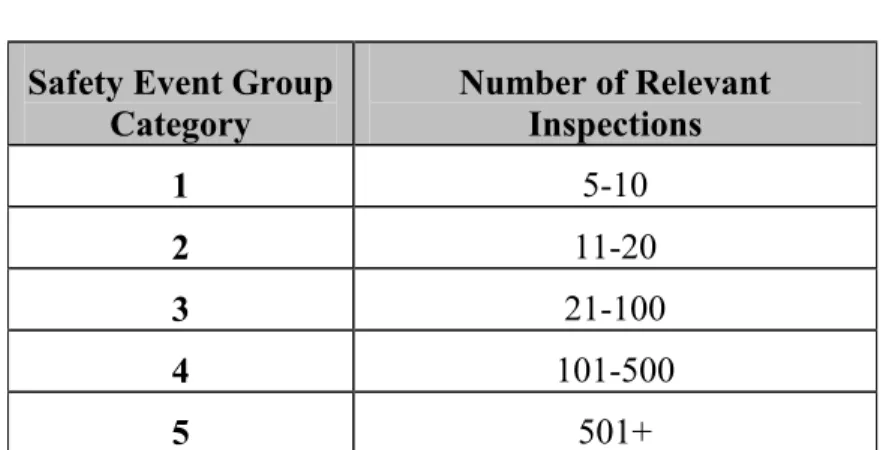
A. Determine the total number of relevant inspections and number of inspections with at least one BASIC violation. For the Driver Fitness BASIC, remove carriers with (1) less than five relevant driver inspections or (2) no inspections resulting in at least one BASIC violation. For the remaining carriers, place each carrier into one of five groups based on the number of relevant inspections:
Safety Event Group
Category Number of Relevant Inspections
1 5-10
2 11-20
3 21-100
4 101-500
5 501+
Table 3-5. Safety Event Group Categories for the Driver Fitness BASIC
B. Within each group, rank all the carriers‘ BASIC measures in ascending order. Transform the ranked values into percentiles from 0 (representing the lowest BASIC measure) to 100 (representing the highest BASIC measure). Eliminate carriers that meet both of the following criteria: (1) no violation was recorded in the BASIC during the previous twelve months, and (2) no violation in the BASIC was recorded during the latest relevant inspection. For the remaining carriers with five or more relevant inspections resulting in a Driver Fitness BASIC violation, assign the percentile values to each carrier‘s BASIC.
3.4 Controlled Substances/Alcohol BASIC
This section describes the calculation of carrier measures and percentile ranks in the Controlled Substances/Alcohol BASIC. The definition of this BASIC is as:
Operating CMVs by drivers cited in roadside inspections for impairment due to alcohol, illegal drugs, and misuse of prescription or over-the-counter
medications. Example violations: use or possession of controlled substances or alcohol. See Appendix A for a complete list of roadside inspection violations used in the SMS.
The CSMS assesses the Controlled Substances/Alcohol BASIC using relevant violations of FMCSRs recorded during roadside inspections and reported in MCMIS. Individual carriers‘ BASIC measures also incorporate quantity of relevant roadside inspections. These measures are used to generate percentile ranks that reflect each carrier‘s driver safety posture relative to carriers with similar numbers of inspections with violations.
3.4.1 Calculation of BASIC Measure
The BASIC measures for the Controlled Substances/Alcohol BASIC are calculated as the sum of severity and time weighted applicable violations divided by time weighted
relevant inspections, as follows:
s inspection relevant of weight time Total violations applicable weighted severity and time of Total Measure BASIC Equation 3-5
In this equation, the terms are defined as follows:
Applicable Violation is defined as any violation recorded in any level roadside inspection that matches the FMCSR and HMR cites listed for Controlled Substances/Alcohol (Table 4, Appendix A) and during the past 24 months. In cases of multiple counts of the same violation, the CSMS only uses each violation cite once per inspection.
Note: Some roadside inspections are performed following a traffic enforcement
stop for a moving violation. Violations reported during such stops do not always result in the issuance of a citation to the driver, but are used in the SMS whether or not a citation is issued.
A Relevant Inspection is any Driver Inspection (Level 1, 2, 3 or 6), including those that do not result in a violation in the BASIC, or any other inspection resulting in applicable BASIC violation.
A Severity Weight from 1 (less severe) to 10 (most severe) is assigned to each applicable violation. See the Controlled Substances/Alcohol Table (Table 4, Appendix A) for the severity weights corresponding to each violation. The
severity weighting of each violation cite accounts for the level of crash risk relative to the other violation cites used in the BASIC measurement. The sum of all severity weights yielded by any one inspection for violations in any one BASIC is capped at a maximum of 30. This cap of 30 is applied before the severity weights are multiplied by the time weight.
A Time Weight of 1, 2 or 3 is assigned to each applicable violation and each relevant inspection based on its age. Violations recorded in the past 6 months receive a time weight of 3. Violations recorded between 6 and 12 months ago receive a time weight of 2. All violations recorded earlier (older than 12 months but within the past 24 months) receive a time weight of 1. Using the exact same time weight scheme, time weights are assigned to each relevant inspection, regardless of whether or not an inspection yielded an applicable violation. This time weighting places more emphasis on results of recent inspections relative to older inspections.
Time and Severity Weighted Violation is a violation‘s severity weight multiplied by its time weight.
3.4.2 Calculation of BASIC Percentile Rank
Based on the BASIC measures, the CSMS applies data sufficiency standards and safety event grouping to assign a percentile rank to carriers that can then potentially receive a CSA 2010 intervention. The calculation is as follows:
A. Remove carriers with no violations in this BASIC. For the remaining carriers, place each carrier into one of four groups based on the number of carrier relevant inspections:
Safety Event Group Category
Number of inspections with Controlled Substance/Alcohol Violations 1 1 2 2 3 3 4 4+
Table 3-6. Safety Event Group Categories for Controlled Substances/Alcohol BASIC
B. Within each group, rank all the carriers‘ BASIC measures in ascending order. Transform the ranked values into percentiles from 0 (representing the lowest BASIC measure) to 100 (representing the highest BASIC measure).
Eliminate carriers whose violations in the BASIC are all older than twelve months. Carriers that remain retain the previously calculated percentile.
3.5 Vehicle Maintenance BASIC Assessment
This section describes the calculation of carrier measures and percentile ranks in the Vehicle Maintenance BASIC. This BASIC is defined as:
Failure to properly maintain a CMV. Example violations: brakes, lights, and other mechanical defects, and failure to make required repairs. See Appendix A for a complete list of roadside inspection violations used in the SMS. The CSMS assesses the Vehicle Maintenance BASIC using relevant violations recorded during roadside inspections to calculate a measure of each BASIC for individual motor carriers. These measures are used to generate percentile ranks that reflect each carrier‘s safety posture relative to carriers with similar numbers of relevant inspections.
3.5.1 Calculation of BASIC Measure
The equation used for calculating Vehicle Maintenance BASIC measures is as follows:
s inspection relevant of weight time Total violations applicable weighted severity and time of Total Measure BASIC Equation 3-6
In this equation, the terms are defined as follows:
Applicable Violation is defined as any violation recorded in any level roadside inspection that matches the FMCSR and HMR cites listed for Vehicle
Maintenance (Table 5, Appendix A) during the past 24 months. In cases of multiple counts of the same violation, the CSMS only uses each violation cite once per inspection.
A Relevant Inspection is any Vehicle Inspection (Level 1, 2, 5 or 6), including those that do not result in a violation in the BASIC, or any other inspection resulting in applicable BASIC violation.
A Severity Weight is assigned to each applicable violation with a value dependent on two parts: (i) the level of crash risk relative to the other violation cites used in the BASIC measurement, and (ii) whether or not the violation resulted in an OOS condition.
(i) The level of crash risk is assigned to each applicable violation ranging from 1 (less severe) to 10 (most severe); see the Vehicle Maintenance table (Table 5, Appendix A) for the corresponding severity weights of each violation cite.
(ii) An OOS weight of 2 is then added to the severity weight of OOS violations. In cases of multiple counts of the same violation, the OOS weight of 2 applies if any of the counts of the violation are OOS.
The sum of all severity weights yielded by any one inspection for violations in any one BASIC is capped at a maximum of 30. This cap of 30 is applied before the severity weights are multiplied by the time weight.
A Time Weight of 1, 2 or 3 is assigned to each applicable violation and each relevant inspection based on its age. Violations recorded in the past 6 months receive a time weight of 3. Violations recorded between 6 and 12 months ago receive a time weight of 2. All violations recorded earlier (older than 12 months but within the past 24 months) receive a time weight of 1. Using the exact same time weight scheme, time weights are assigned to each relevant inspection, regardless of whether or not an inspection yielded an applicable violation. This time weighting places more emphasis on results of recent inspections relative to older inspections.
Time and Severity Weighted Violation is a violation‘s severity weight multiplied by its time weight.
3.5.2 Calculation of BASIC Percentile Rank
Based on the BASIC measures, the CSMS applies data sufficiency standards and safety event grouping to assign a percentile rank to carriers that can then potentially receive a CSA 2010 intervention or detrimental SFD. The calculation is as follows:
A. Determine the total number of relevant vehicle inspections and the number of inspections with at least one BASIC violation. Remove carriers with (1) less than five relevant inspections or (2) no inspections resulting in at least one BASIC violation. For the remaining carriers, place each carrier into one of five groups based on the number of relevant inspections:
Safety Event Group
Category Number of Relevant Inspections
1 5-10
2 11-20
3 21-100
4 101-500
5 501+
Table 3-7. Safety Event Group Categories for the Vehicle Maintenance BASIC
B. Within each group, rank all the carriers‘ BASIC measures in ascending order. Transform the ranked values into percentiles from 0 (representing the lowest BASIC measure) to 100 (representing the highest BASIC measure).
recorded in the BASIC during the previous twelve months, and (2) no
violation in the BASIC was recorded during the latest relevant inspection. For the remaining carriers with five or more relevant inspections resulting in a Vehicle Maintenance BASIC violation, assign the percentile values to each carrier‘s BASIC.
3.6 Cargo-Related BASIC Assessment
This section describes the calculation of carrier measures and percentile ranks in the Cargo-Related BASIC. This BASIC is defined as:
Failure to properly prevent shifting loads, spilled or dropped cargo, and unsafe handling of hazardous materials on a CMV. Example violations: improper load securement, cargo retention, and hazardous material handling. See Appendix A for a complete list of roadside inspection violations used in the SMS.
The CSMS assesses the Cargo-Related BASIC using relevant violations recorded during roadside inspections to calculate a measure of each BASIC for individual motor carriers. These measures are used to generate percentile ranks that reflect each carrier‘s safety posture relative to carriers with similar numbers of relevant inspections
3.6.1 Calculation of BASIC Measure
The equation used for calculating Cargo-Related BASIC measures is as follows:
s inspection relevant of weight time Total violations applicable weighted severity and time of Total Measure BASIC Equation 3-7
In this equation, the terms are defined as follows:
Applicable Violation is defined as any violation recorded in any level roadside inspection that matches the FMCSR and HMR cites listed in the Cargo-Related BASIC (Table 6, Appendix A) during the past 24 months. In cases of multiple counts of the same violation, the CSMS only uses each violation cite once per inspection.
A Relevant Inspection is any Vehicle Inspection (Level 1, 2, 5 or 6), including those that do not result in a violation in the BASIC, or any other inspection resulting in applicable BASIC violation.
A Severity Weight is assigned to each applicable violation with a value dependent on two parts: (i) the level of crash risk relative to the other violation cites used in the BASIC measurement, and (ii) whether or not the violation resulted in an OOS condition.
(i) The level of crash risk is assigned to each applicable violation ranging from 1 (less severe) to 10 (most severe); see the Cargo-Related table (Table 6, Appendix A) for the corresponding severity weights of each violation cite.
(ii) An OOS weight of 2 is then added to the severity weight of OOS violations. In cases of multiple counts of the same violation, the OOS weight of 2 applies if any of the counts of the violation are OOS. The sum of all severity weights yielded by any one inspection for violations in any one BASIC is capped at a maximum of 30. This cap of 30 is applied before the severity weights are multiplied by the time weight.
A Time Weight of 1, 2 or 3 is assigned to each applicable violation and each relevant inspection based on its age. Violations recorded in the past 6 months receive a time weight of 3. Violations recorded between 6 and 12 months ago receive a time weight of 2. All violations recorded earlier (older than 12 months but within the past 24 months) receive a time weight of 1. Using the exact same time weight scheme, time weights are assigned to each relevant inspection, regardless of whether or not an inspection yielded an applicable violation. This time weighting places more emphasis on results of recent inspections relative to older inspections.
Time and Severity Weighted Violation is a violation‘s severity weight multiplied by its time weight.
3.6.2 Calculation of BASIC Percentile Rank
Based on the BASIC measures, the CSMS applies data sufficiency standards and safety event grouping to assign a percentile rank to carriers that can then potentially receive a CSA 2010 intervention or detrimental SFD. The calculation is as follows:
A. Determine the total number of relevant vehicle inspections and the number of inspections with at least one BASIC violation. Remove carriers with (1) less than five relevant inspections or (2) no inspections resulting in at least one BASIC violation. For the remaining carriers, place each carrier into one of five groups based on the number of relevant inspections:
Safety Event Group
Category Number of Relevant Inspections
1 5-10
2 11-20
3 21-100
4 101-500
5 501+
Table 3-8. Safety Event Group Categories for the Cargo-Related BASIC
B. Within each group, rank all the carriers‘ BASIC measures in ascending order. Transform the ranked values into percentiles from 0 (representing the lowest BASIC measure) to 100 (representing the highest BASIC measure).
Eliminate carriers that meet both of the following criteria: (1) no violation was recorded in the BASIC during the previous twelve months, and (2) no
violation in the BASIC was recorded during the latest relevant inspection. For the remaining carriers with five or more relevant inspections resulting in a Cargo-Related BASIC violation, assign the percentile values to each carrier‘s BASIC.
3.7 Crash Indicator Assessment
This section describes the calculation of carrier measures and percentile ranks for the Crash Indicator. The Crash Indicator is defined as:
Histories or patterns of high crash involvement, including frequency and severity, based on information from state-reported crash reports.
Although the BASICs are used to measure an entity‘s behaviors, the crash history utilized by the Crash Indicator is not specifically a behavior; instead, it is the consequence of behavior and may indicate a problem with the entity that warrants intervention.
The CSMS assesses the Crash Indicator using relevant state-reported crash data reported in MCMIS. Individual carriers‘ Crash Indicator measures also incorporate carrier size in terms of PUs and annual VMT. These measures are used to generate percentile ranks that reflect each carrier‘s safety posture relative to carriers in the same segment with similar numbers of crashes.
3.7.1 Calculation of Crash Indicator Measure
Factor n Utilizatio PUs Average crashes applicable weighted severity and time of Total Measure Indicator Crash * Equation 3-8
In this equation, the terms are defined as follows:
Applicable Crash is a state-reported crash that meets the reportable crash standard during the past 24 months. A reportable crash is one that results in at least one fatality; one injury where the injured person is taken to a medical facility for immediate medical attention; or, one vehicle having been towed from the scene as a result of disabling damage caused by the crash (i.e. tow-away).
Crash Severity Weight places more weight on crashes with more severe consequences. For example, a crash involving an injury or fatality is weighted more heavily than a crash where only a tow-away occurred. A hazmat release also increases the weighting of a crash, as shown in Table 3-9.
Crash Type Crash Severity Weight
Involves tow-away but no
injury or fatality 1
Involves injury or fatality 2
Involves a hazmat release Crash Severity Weight (from above) + 1
Table 3-9. Crash Severity Weights for Crash Indicator
A Time Weight of 1, 2 or 3 is assigned to each applicable crash based on the time elapsed since the crash occurred. Crashes that occurred within 6 months of the measurement date receive a time weight of 3. Crashes that occurred between 6 and 12 months prior to the measurement date receive a time weight of 2. All crashes that happened later (older than 12 months but within the past 24 months of the measurement date) receive a time weight of 1. This time weighting places more emphasis on recent crashes relative to older crashes.
Time and Severity Weighted Crash is a crash‘s severity weight multiplied by its time weight.
Average Power Units (PUs) is used in part to account for each carrier‘s level of exposure when calculating the BASIC measure. The BASIC violations are normalized by the number of owned, term-leased, and trip-leased PUs (trucks, tractors, hazardous-material tank trucks, motor coaches, and school buses) contained in the Census data. The average PUs for each carrier is calculated using (i) the carrier‘s current number of PUs, (ii) the number of PUs the carrier
had 6 months ago, and (iii) the number of PUs the carrier had 18 months ago. The average PU calculation is shown below:
3 ) 18 ( ) 6 ( ) ( )
(average PU current PU Months PU Months PU
Equation 3-9
Utilization Factor is a multiplier that adjusts the Average PU values based on the utilization in terms of vehicle miles travelled (VMT) per Average PU where VMT data in the past 24 months are available. The primary sources of VMT
information in the Census are: (1) Form MCS-150, filled out by the carrier, and (2) Form MCS-151, filled out by law enforcement as part of an investigation. Carriers are required to update their MCS-150 information biennially. In cases where the VMT data has been obtained multiple times over the past 24 months for the same carrier, the most current positive VMT figure is used. The Utilization Factor is calculated by the following three steps:
(i) Carrier Segment
There are two segments that each motor carrier falls into:
―Combo‖ – combination trucks/motor coach buses constituting 70% or
more of the total PU.
―Straight‖ – straight trucks/other vehicles constituting more than 30% of the total PU.
(ii) VMT per Average PU
The VMT per Average PU is derived by taking most recent positive VMT data and dividing it by the average PUs (defined above).
(iii) Utilization Factor
Given the information in (i) and (ii) the Utilization Factor are determined from the following tables:
Combo Segment
VMT per Average PU Utilization Factor
< 80,000 1
80,000 - 160,000 1+0.6[(VMT per PU-80,000) / 80,000]
160,000 - 200,000 1.6
> 200,000 1
No Recent VMT Information 1
Straight Segment
VMT per Average PU Utilization Factor
< 20,000 1
20,000 - 60,000 VMT per PU / 20,000
60,000 - 200,000 3
> 200,000 1
No Recent VMT Information 1
Table 3-11. VMT per Average PU for Straight Segment 3.7.2 Calculation of Crash Indicator Percentile Rank
Based on the Crash Indicator measures, the CSMS applies data sufficiency standards and Safety Event Grouping to assign a percentile rank to carriers that can potentially receive a CSA 2010 intervention. The calculation is as follows:
A. Determine the carrier‘s segment:
―Combo‖ – combination trucks/motor coach buses constituting 70% or more of the total PU.
―Straight‖ – straight trucks/other vehicles constituting more than 30% of the total PU.
B. For carriers with two or more applicable crashes, place each carrier into one of five groups based on the carrier segment and number of crashes:
Safety Event Group Category Combo Segment: Number of Crashes Straight Segment: Number of Crashes 1 2-3 2 2 4-6 3-4 3 7-16 5-8 4 17-45 9-26 5 46+ 27+
Table 3-12. Safety Event Group Categories for Crash Indicator
C. Within each group, rank all the carriers‘ Crash Indicator measures in ascending order. Transform the ranked values into percentiles from 0 (representing the lowest indicator measure) to 100 (representing the highest indicator measure). Remove carriers that did not have a crash recorded in
the previous twelve months. Carriers that remain retain the previously calculated percentile.
4.
DSMS Methodology
The DSMS is the second major component of the SMS, along with the CSMS. Law enforcement officials use the DSMS results to examine the safety performance of individual CMV drivers when conducting CSA 2010 investigations. Currently, the DSMS results are being used strictly as an investigative tool for law enforcement and are not available to carriers, drivers, or the public. However, the raw safety information from roadside inspections and crashes that feeds the DSMS is compiled by the same system that will provide CMV driver-based data to FMCSA‘s Driver Pre-Employment Screening Program (PSP). This new program will allow motor carriers to access driver inspection and crash records electronically as a part of the hiring process.4
This section describes the algorithms used in the DSMS methodology and the
computational logic used to calculate the driver measures and percentiles for each BASIC and the Crash Indicator for individual CMV drivers. BASICs that are evaluated similarly are described together.
Unsafe Driving BASIC and Controlled Substances/Alcohol BASIC Fatigued Driving (HOS) BASIC and Driver Fitness BASIC
Vehicle Maintenance BASIC and Cargo-Related BASIC Crash Indicator
4.1 Unsafe Driving BASIC and Controlled Substances/Alcohol BASIC Assessment
This section describes the measurement of the Unsafe Driving BASIC and the Controlled Substances/Alcohol BASIC. The definition of each BASIC is as follows:
Unsafe Driving BASIC—Operation of CMVs in a dangerous or careless manner. Example violations: speeding, reckless driving, improper lane change, and inattention.
Controlled Substances/Alcohol BASIC—Operation of CMVs by drivers who are impaired due to alcohol, illegal drugs, and misuse of prescription or over-the-counter medications. Example violations: use or possession of controlled substances or alcohol.
The DSMS assesses both the Unsafe Driving BASIC and Controlled Substances/Alcohol BASIC by using applicable violations recorded during roadside inspections to calculate a measure in each BASIC for individual drivers. These measures are used to generate percentile ranks that reflect drivers‘ safety postures relative to drivers with applicable violations.
4 More information about the PSP program can be found on FMCSA‘s PSP website at