Analytics Help Home...15
Admin Tools...17
Administration API...17
ASI Slots...17
Segment Definitions...18
Segment Builder Elements...20
Billing...22
Bot Rules...24
Create a custom bot rule...25
Upload bot rules...25
Classifications...26
About Classifications...27
Conversion Classifications...31
Traffic Classifications...32
Classification Hierarchies...33
Classifications Importer (Upload)...34
Classification Rule Builder...47
Numeric 2 Classifications...66
Troubleshooting Classifications...73
Co-Branding...73
Code Manager...73
Legacy Code Manager...73
Company Settings...76
Conversion...76
Conversion Variables (eVar)...76
Edit conversion variables...79
Cross Product Login...79
Currency Codes...79
Analytics Help and Reference Last updated 12/16/2015
Custom Report Descriptions...85
Customize Calendar...86
Set up the custom calendar...86
Data Sources...87
Default Metrics...87
Specify default metrics...87
Exclude By IP Address...87
Finding Methods...89
General Account Settings...89
Group Management...91
Hide Report Suites...91
Internal URL Filters...92
Add internal URL filters...92
Key Visitors...92
Add a key visitor...93
Logs...93
Manage P3P Policy...94
Marketing Channels...94
Menu Customizing...95
Customize the reports menu...95
Locate a customized report...95
Mobile Management...96
Name Pages...96
Paid Search Detection...97
Configure paid search detection...97
Pending Actions...97
Publishing Lists...98
Add a publishing list...98
Filter the publishing lists table...98
Publishing Widget ...99
Add a publishing Widget...100
Publishing Widget Code on a Web Page...100
Analytics Help and Reference Last updated 12/16/2015
Privacy Settings...101
Processing Rules...101
How Processing Rules Work...103
Dimensions Available to Processing Rules...105
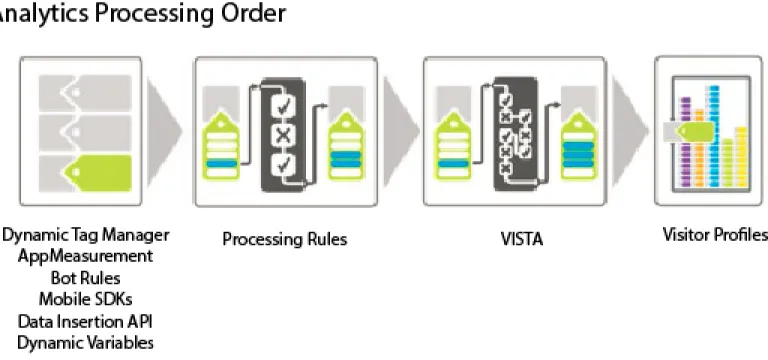
Processing Order...108
Examples of Processing Rules...110
Processing Rules Tips & Tricks...116
Managing Processing Rules...119
Real-Time Reports Configuration...121
Report Builder Reports...123
Report Suite Manager...123
Individual Report Suite Settings...124
New Report Suite...125
Report Suite Groups...127
Report Suite Templates...127
Rollup and Global Report Suites...136
Save a report suite search...138
Scheduled Reports Queue...138
Security Manager...140
Single Sign-On...141
Simplified Reports Menu...141
Social Management...143
Success Events...143
Configure success events...144
About Changing the Event Type...145
Survey Settings...145
Timestamps Optional...146
Traffic Variable...146
Enable traffic variable reports...147
Traffic...147
Traffic Management...147
Schedule a traffic spike...147
Analytics Help and Reference Last updated 12/16/2015
Specify permanent traffic increase...148
Required Lead Time for Traffic Increases...148
Unique Visitor Variable...149
Specify the Unique Visitor variable...149
Use Case - Extracting Visitor IDs...149
User Management...150
Report Suites...151 Users...151 Groups...154 Email users...158Video Management...159
Web Services...159
Data Collection...160
Data Collection in Analytics...160
Current Data...164
Data Availability Troubleshooting...166
Reporting High Numbers of Unique Values (Low-Traffic)...167
Data Availability, Security, and Recovery Whitepapers...168
Privacy Overview...169
Variables - How They Are Used in Reporting...171
Data Warehouse...179
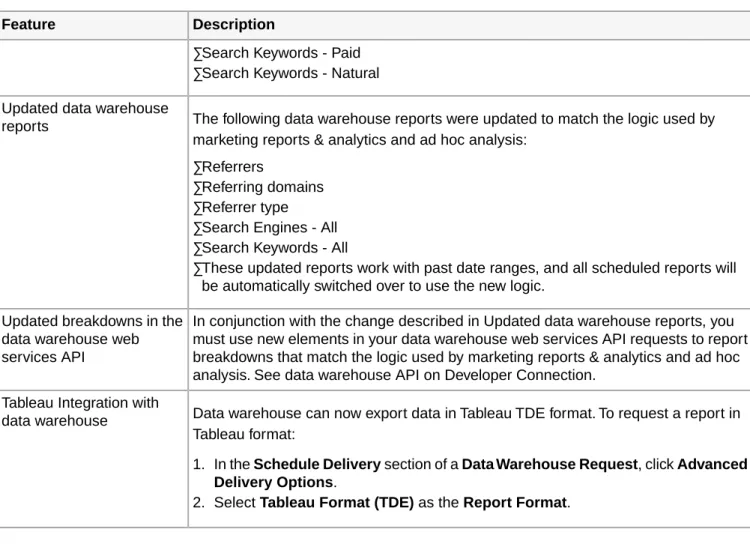
Data Warehouse Release Notes...180
Add data warehouse user group...192
Create a data warehouse request...192
Tableau data file...192
Sort by Metric...193
Manage data warehouse requests...194
Data Warehouse Best Practices...194
Developer...196
Analytics Help and Reference Last updated 12/16/2015
Metrics Quick Reference...199
Metric Calculations...202
Average Page Depth ...203
Average Time Spent...204
Bounces...204
Bounce Rate...204
Calculated Metrics...204
Campaign-Specific Metrics...205
Cart Additions...205
Cart Open...205
Cart Removals...205
Cart Views...205
Checkouts...206
Click-throughs...206
Custom Metrics...206
Daily Unique Visitors...207
Entries...207
Exits...207
Instances...207
Lifetime...208
Mobile Views...208
Monthly Unique Visitors...208
New Engagements...208
Occurrences...209
Orders...209
Page Depth...209
Page Events...209
Page View...210
Participation...210
Add Participation Metrics...211
Analytics Help and Reference Last updated 12/16/2015
Path Views...211
Product Views...211
Quarterly Unique Visitors...212
Reloads...212
Revenue...212
Searches...212
Single Access...213
Time Spent...213
Time Spent - Page Calculation Example...215
Time Spent - Site Sections Calculation Example...216
Time Spent - eVar Calculation Example...218
Total...219
Unique Visitors...219
Units...220
Visit...220
Visits and Launches...221
Visitors...228
Visitor Participation - Ad Hoc Analysis...228
Weekly Unique Visitors...229
Yearly Unique Visitors...229
Report Descriptions...231
Reporting Best Practices and Troubleshooting...231
Anomaly Detection...232
Version 14 Report Descriptions...233
Report Categories...252
Ranked Reports...252
Trended Reports...252
Totals Report...252
Flow Reports...252
Bookend Pattern Report...253
Bookmark URL Length Report...253
Analytics Help and Reference Last updated 12/16/2015
Breakdown Reports...253
Break Down a marketing report...254
Add a Correlation Filter...254
Browser Height Report...255
Browser Types Report...255
Browser URL Length Report...255
Browser Width...255
Browsers Report...256
Campaigns Report...257
Campaign Conversion Funnel...257
Categories Report...258
Color Depth Report...258
Complete Path...258
Connection Types Report...258
Content Types Report...258
Conversion Reports...258
Conversion Funnel Reports...259
Conversions and Averages Report...260
Cross-Sell Report...260
Custom Events Report...260
Custom Insight Report...260
Custom Links Report...260
Customer Attributes Report...261
Customer Loyalty Report...263
Custom Report...264
Custom Traffic Report...264
Daily Return Visits Report...265
Days Before First Purchase Report...265
Days Before Last Purchase Report...265
Daily Return Visits Report...265
Designated Market Area Report...265
Analytics Help and Reference Last updated 12/16/2015
Device Number Transit Report...265
Device Types Report...266
Devices Report...266
DRM Report...266
Entries and Exits Reports...266
Exit Links Report...267
Fallout Report...268
File Downloads Report...268
Finding Methods Report...269
Flow Reports...269
Full Paths Report...269
GeoSegmentation Reports...269
Map View...271
GeoSegmentation Regions and Postal Code usage by Country...271
Hierarchy Report...279
Image Support Report...279
Information Services Report...279
JavaScript Report...280
Java Version Report...280
Key Metrics Report...280
Key Visitor Report...281
Languages Report...281
Last 100 Visitors Report...281
Links Report...282
Longest Path Report...282
Mail URL Length Report...282
Manufacturer Report...282
Marketing Channel Overview Report...282
Marketing Channel Detail - First and Last Touch...283
Mobile Reports...284
Mobile Carrier Report...287
Monitor Color Depth Report...287
Analytics Help and Reference Last updated 12/16/2015
Most Popular Servers Report...288
Most Popular Site Sections Report...288
Net Protocols Report...288
Next Page Report...288
Next Page Flow Report...288
Next Section Flow Report...289
Next Server Flow Report...289
Operating Systems Report...289
Operating System Types Report...290
Orders Report...291
Original Referring Domains Report...291
Over Time Report...291
Social Owned Property Reports...291
Page Depth Report...295
Page Summary Report...295
Page Value Report...295
Page Viewed by Key Visitors Report...296
Page Views Report...296
Pages Report...297
Pages Not Found Report...298
Paid Search Engines Report...298
Paid Search Keywords Report...298
Path Length Report...298
Pathing Reports...299
Paths Reports...301
Previous Page Report...302
Previous Page Flow Report...303
Previous Section Flow Report...303
Previous Server Flow Report...303
Products Report...303
Analytics Help and Reference Last updated 12/16/2015
Products Conversion Funnel Report...304
PTT Report...304
Purchases Report...304
Real-Time Reports...305
Supported Real-Time Metrics and Dimensions...305
Referrer Type Report...306
Referrers Report...307
Referring Domains Report...308
Return Frequency Report...309
Return Visits Report...310
Revenue Report...310
Screen Height Report...311
Screen Size Report...312
Screen Width Report...312
Search Engines Report...312
Search Keywords Report...312
Servers Report...313
Shopping Cart Report...313
Single Page Visit Report...314
Site Analysis Report...314
Site Content Reports...316
Site Metrics Report...316
Site Overview Report...316
Site Sections Report...317
Site Sections Depth Report...318
Site Sections Summary Report...319
Survey Report...319
Target Report...319
Target Activities Report...319
Target Experiences Report...319
Target Lift and Confidence Report Type...320
Technology Reports...321
Analytics Help and Reference Last updated 12/16/2015
Time Spent on Page Report...322
Time Spent on Site Section Report...323
Time Spent per Visit Report...323
Time Zones Report...324
Top Level Domains Report...325
Totals Report...325
Tracking Codes Report...325
Traffic Reports...326
Traffic Sources Report...327
Unique Customers Report...329
Unique Visitors Report - Analytics...329
Units Report...334
U.S. State...334
Video Reports...334
Video Support Reports...334
Virtual Focus Group Report...334
Visitor Detail Report...335
Visit Number Report...335
Visitor Profile Report...335
Visitor Retention...335
Visitor Zip and Postal Codes Report...337
Visitors Report...337
Visits Report...338
Terms Used in Analytics...340
Acquisition...340
Activity...340
Allocation...340
Anomaly...340
Calculated Metrics...340
Campaign...341
Analytics Help and Reference Last updated 12/16/2015
Channel...341
Classification...342
Clickstream Data Feeds...342
Conversion Variable (eVar)...342
Count Repeat Instances...343
Correlation...343
CPM...343
CPMM...343
Creative Element...343
Custom Traffic Variable (s.prop)...343
Current Data...344
Data Connectors...344
Data Sources...344
Decision Tree...344
Deduplication...344
Dimensions...345
Event Serialization...347
Exit Link...347
Expiration Trigger...347
Gantt View...347
Gauge Reportlet...347
Granularity...347
Hierarchy...347
Hit...348
Image Request...348
Internal Search Term...348
KPI - Key Performance Indicator...348
Lifetime Value...348
List Prop...348
Login Company...349
Marketing Cloud...349
Analytics Help and Reference Last updated 12/16/2015
Metric...349
Multi-Suite Tagging...350
Normalization...350
Original Referring Domain...351
Pathing...351
Persistence...352
Ranked Report...352
Real Time...352
Report...352
Report Suite...353
Segment Container...353
Segmentation...353
Server Call...354
Subrelation...354
Success Event...355
Transaction Unique Customer URL...355
Trended Report...355
Unique Visitors...355
Visit Depth...356
VISTA Rules...356
Documentation Updates...358
System Requirements...360
Contact and Legal Information...361
Analytics Help and Reference Last updated 12/16/2015
Analytics Help Home
This help is intended for users and administrators of Reports & Analytics.You can browse for help on reports, metrics, data collection, and admin tools.
Interface Help Now Playing
YouTube Video:https://www.youtube.com/watch?v=lDQ4Sm0FRtA •Analysis Workspace
More videos available at: •Reports & Analytics User Help
•Ad Hoc Analysis Help
• YouTube:Adobe Analytics Videos
•Analytics Segmentation
•Enterprise TV
•Report Descriptions
Have a question? Visit the Adobe Analytics Community. •Metric Descriptions
Latest News and Topics •Data Workbench
•Report Builder 5.0
•What's New in Analytics - Fall 2015 •Marketing Channels Help
Feature overviews for Fall 2015. •Data Connectors
•Visitor Click Map
•Analytics Frequently Asked Questions (FAQs)
Most popular troubleshooting tips.
•Version 14
Marketing Cloud Community Resources
•Visits and Launches
Updates about why Visits might be higher than Launches. •Adobe Analytics Community
•Marketing Cloud Release Notes
•Unified Calculated Metrics
Create and manage Global Calculated Metrics. ••Product Documentation HomeDeveloper •Customer Attributes Report
Run reports on CRM data uploaded to the Marketing Cloud.
•Idea Exchange
•Adobe Training and Tutorials
•Featured Solutions Center
•Scheduled Reports Queue
Better queue management and advanced filtering capabilities for scheduled reports. Admin-level users can now view, manage, and filter on all reports in their organization.
•Reporting Best Practices and Troubleshooting
Learn about common reasons why reports fail and what you can do to avoid timeouts and failures.
•Processing rule limits were increased from 50 to 100 per report suite, and a new "Else" operator was added to let you take action when a condition is not met.
• Classifications are now supported by real-time reports and anomaly detection.
See Documentation Updates to learn about recent additions to Analytics help.
Administration Help
•Admin Tools
•Classifications
•Common SAINT Upload Issues
•Data Sources
•Data Warehouse
•Marketing Cloud Core Services
•Dynamic Tag Management
•Single Sign-On (Important information about legacy single sign-on.)
Implementation and Developer
•Marketing Cloud ID Service (visitor ID) •Analytics Implementation
•JavaScript Implementation
•Debugger Installation
•Variables - How They Are Used in Reporting
•Clickstream Data Column Reference
•Regional Data Collection (RDC) •Developer Documentation
Admin Tools
A help system for administrators using Admin Tools.
Analytics > Admin
Important: Do not to open multiple Admin Console tabs in the same browser. This can lead to you inadvertently
saving settings to the wrong report suite. If you need to, for example, compare rule sets and copy them to a new report suite, we suggest that you open a new browser or take a screen shot to compare rule sets. The Admin Tools let you configure the following Analytics features:
Administration API
Adobe's Administration API lets you change report suite and user settings without the need to use Admin Tools. This feature is useful if you have a custom reporting interface, letting you make changes to the report suite without having to log in to the interface. There are no limitations to using this API, as compared to Admin Tools. Meaning, if a certain action can be done within Admin Tools, that same action can be done using the Administration API. For additional information, see Developer Connection.
Customer Care does not provide support for the Administration API. If you require assistance regarding this, refer to the developer connection forums.
ASI Slots
Advanced Segment Insight (ASI) is a legacy version 14 feature that is replaced by native segmentation in analytics
reports.
Note: The ASI interface is not available in marketing reports & analytics.
ASI slots no longer process after you upgrade to Analytics version 15 or above. However, most use cases should be resolved through segmentation. Here are a few distinctions to be aware of:
Interface
For more information on the Analytics marketing reports segment interface, see the Analytics Segmentation Guide.
Data Availability
ASI processes from a specified date forward. Creating a segment for historical data is possible but time consuming. Marketing report segments apply to all data on the new platform, as of your upgrade date. After you create a segment, you can immediately apply it to a report.
Processing vs. Filtering
ASI reprocesses data. This can cause some data discrepancies due to eVar persistence and similar factors. As such, VISTA rules running on the ASI report suite can change the data, rather than just filter out some traffic. Marketing report segments act as filters at the Visit, Visitor, or Hit level. Rather than re-processing data, the filters remove data that falls outside of the criteria. As such, VISTA rules cannot change the data in a report segment. (If you need to re-process data after upgrading, contact Engineering Services.)
Permissions
With ASI, users can be restricted to see just one or more ASI report suites, if needed. Segment permissions in marketing reports differ between Admin-level and non-Admin users.
Segment Definitions
The Segment Definition Builder allows you to define visitor segment filters based on visitor behavior.
You can use the Segment Definition Builder to create new segment filters or to edit an existing filter. When submitting a data warehouse request, you can apply a segment filter to the result set to analyze your website traffic. Segments created in data warehouse are also available in the ASI feature.
For example, the segment of visitors that purchased $300 during a sales promotion held during the past eight days is a segment filter.
Build segment definitions - ASI slots
Steps that describe how to build segment definitions in Admin > ASI Slots.
Note: Advanced Segment Insight (ASI) is a legacy version 14 feature that is replaced by the native
segmentation in Version 15. ASI slots are no longer process after you upgrade to Version 15. 1. Log in to the Suite.
2. In the Suite header, click Admin > ASI Slots.
3. On the ASI Slots page, perform one of the following tasks, depending on your needs:
This is the first ASI Slot: The ASI Slots Manager opens directly to the Create Segment page where you can
create the ASI slot.
There is one or more existing ASI slot: Click Set Up next to the unconfigured ASI slot that you want to use. To reconfigure an existing ASI slot: Click Add Data next to the ASI Slot that you want to modify.
4. In the Step 2: Choose a Segment Definition section, open the Segment Definition Builder by clicking New. Or
Select an existing segment definition, then click Edit.
5. (Conditional) If you are creating a new segment definition, specify a segment name in the Title field. 6. Click the Components or Library tab, as desired.
For more information about the Library, see Add components to the segment definition library.
7. Drag an item from either the Components or the Library tab to the Drag and Drop Here field in the Include tab.
You can also click the Exclude tab and drag an item from either the Components or the Library tab to the Drag
and Drop Here field.
8. Click the Define Rule icon for each element you added to the canvas (you can also click the underlined element link).
9. Type a name for the canvas element in the Name field. 10. Select an item from the This Visit Must Match drop-down list.
11. Select an item from the Item drop-down list.
12. Select an operator value from the middle drop-down list:
Description Operator
The selected item must exactly equal the value you enter. equals
The value of selected item must be greater than the value you enter. is greater than
The value of the selected item must be less than value you enter. is less than
The selected item must equal or be greater than the value you enter. is greater than or equal to
The selected item must equal or be less than the value you enter. is less than or equal to
The item must contain the value you enter. contains
The selected item must contain all of the values you enter. contains all of
The selected item must contain all of the values you enter. contains at least one of
13. Enter a value for the filter parameter in the Value field. Or
Click Select Item to select from a list of values. 14. Click Add to add the filter to the Filter list.
15. (Optional)Repeat Steps 11 through 14 for each filter parameter you want to specify. 16. Click OK > Save to save the new segment and to close the Segment Definition Builder. For example, to create a segment identifying visitors who purchased $300:
1. Add "Visitor" to the canvas. 2. Click the Visitor link.
3. Select "Total Revenue" from the Item field.
4. Select "is greater than or equal" from the Operator list. 5. Enter "300" in the Value field.
6. Click Add. 7. Click OK. 8. Click Save.
Add components to the segment definition library
The Library is a repository of frequently used elements (defined or undefined events or containers) that you can use when defining segment definitions.
To add components to your library:
1. Build a segment definition (see Build segment definitions - ASI slots). 2. Click Library.
3. Drag any block from the canvas on the right into the Library area.
All details (including nested blocks) contained within that block will be preserved.
If you added a container (Page View, Visit, or Visitor) to the right-side canvas, add at least one event to the canvas. The Visitor container can contain Visit and Page View containers, with their respective events. The Visit container can contain the Page View container with its respective event. The Page View container can contain only events.
Segment Builder Elements
Descriptions of the interface elements in marketing report segmentation. •Segment Definition Builder Descriptions
•Rule Definitions
Segment Definition Builder Descriptions
Description Element
The name of your segment. You can browse to locate an existing segment to use as a template.
Title
The containers and events you can use to build a segment. Drag and drop components from Segment
Definition Components to the Segment Canvas. Components
Stores commonly used segment definition components. To add components to your library, drag any block from
Library
the canvas on the right into this area. All details (including nested blocks) contained within that block are preserved. Containers are used to build segments that relate to traffic data. Three types of segment containers are available:
Container
• Page Views: Use page segments to understand the traffic going to different areas of your site, including multiple levels of hierarchy.
• Visit: Use visit segments to understand the path a visitor follows and the interaction a visitor takes, such as visits that include specific pages, campaigns, conversions, and so on.
• Visitor: Visitor segments are based on the visitor details, such as where a visitor comes from, buyers or window shoppers, authentication status, gender, age,
geography, and so on.
Note: Visitor segmentation applies to visitor
activity only during the reporting period. However, a visit could potentially include a persistent eVar from previous activity outside the reporting period. If that visitor returns to your site during the
Description Element
segment's reporting period, and the segment includes the eVar value, the visitor would be counted in the segment.
Containers are listed in order from most granular (Page Views) to least granular (Visitors).
Events are generally for conversion data and conversion events. You can make a container subordinate to an
Event
event or vice versa. When the component is in place, additional boxes appear that let you add subordinate components and more main-level components.
Specifies whether to include components (visits, visitors, referring domains, campaigns, browser type, and so on) if the requirements of the events and rules are met.
Include
Specifies a condition that excludes components when the requirements of the events and rules that you
Exclude
configure are met. For example, you can set up a referring domains segment that excludes certain referrers or pages viewed.
Rule Definitions
Description Element
(Optional) The name of the component. This name carries over from the Segment Definition Builder. Changing
Name
this name does not change the core properties for the event or component. Change this name to account for the definitions you have added.
The logic rule that specifies whether all of the rules are true, or at least one of the rules are true.
Match
Lets you use Boolean logic to create a filter for the rule. Select an event (instance, date, eVar, and so on) to use as an operator. Valid selections include:
Include Only
• equals: The selected item must exactly equal the value you enter.
• does not equal: The selected item must not equal the value you enter.
Description Element
• is greater than: The value of selected item must be greater than the value you enter.
• is less than: The value of the selected item must be less than value you enter.
• is greater than or equal to: The selected item must equal or be greater than the value you enter.
• is less than or equal to: The selected item must equal or be less than the value you enter.
• contains: The item must contain the value you enter. • contains all of: The selected item must contain all of
the values you enter.
• contains at least one of: The item must contain at least one of the values you enter.
Lets you type a value for the rule operand. You can click
Select Item to locate additional items. On the resulting Select Item page, only valid values are shown.
Value
Billing
The Billing page lets you access billing information, including traffic details for each report suite. Only an authorized administrator has access to this page.
Note: If access to the billing tab is disabled for your company, contact your Account Manager.
The traffic overview data from the billing page lets you correlate page view data in reports with billable server calls on your invoice. The Billing page lets you do the following:
• Audit your invoice.
• Break down costs by report suite for internal accounting allocations. • View the distribution of primary and secondary server calls.
The Billing page organizes information by month.
To view monthly traffic overview data, locate the month where you want to view traffic data, then click View. The resulting Monthly Invoice report includes the following information:
Description Column
The report suite involved in the data collection activity.
Report Suite
The data center that stores the report suite data: San Jose (California), Dallas (Texas), Pacific Northwest (US), London (UK), or Singapore.
Description Column
In most cases, all company report suites are located in the same data center.
Requests received directly from website visitor browsers or the Data Insertion API. Includes Primary Hits (Page Views), Primary Custom Events, Primary Download Events, and Primary Exit Events.
Primary Server Calls
Copies of primary server calls created by multi-suite tags or copied/moved by a VISTA rule.
Secondary Server Calls
If a secondary server call has been moved (not copied) to a different report suite by a VISTA rule, the Billing page identifies this transfer with a negative number. In this case, the accumulated secondary calls are deducted from the primary server calls.
The combined total of primary and secondary server calls for this report suite at the given location.
Total Server Calls
Page view totals for each report suite. You can confirm page view values in Site Metrics > Page Views.
Page Views
Download totals for each report suite. You can confirm the download values in Site Content > Links > File Downloads.
Downloads
Custom link totals for each report suite. You can confirm the custom link values in Site Content > Links > Custom Links.
Custom Links
Exit link totals for each report suite.You can confirm the exit link values in Site Content > Links > Exit Links.
Exit Links
Note: To obtain a working copy of the Monthly Invoice report, copy it onto your clipboard, then paste it into
a spreadsheet program such as Microsoft Excel*.
Reporting Date vs. Processing Date
In the reporting user interface, the data presented is always attached to the Reporting Date, which is the timestamp that is attached to the event.
Usage/Billing, on the other hand, always uses the Processing Date, or when the data was actually processed in the system. Due to basic latency, data imports, or event time zone differences (everything is processed in Pacific Time) the Reporting Date and Processing Date do not typically match up completely.
Bot Rules
Bot Rules let you remove traffic that is generated by known spiders and bots from your report suite. Removing bot traffic can provide a more accurate measurement of user activity on your website.
After bot rules are defined, all incoming traffic is compared against the defined rules. Traffic that matches any of these rules is not collected in the report suite and is not included in traffic metrics.
Removing bot traffic typically reduces the volume of traffic and conversion metrics. Many customers find that removing bot traffic results in increased conversion rates and increases in other usability metrics. Before removing bot traffic, communicate with stakeholders to make sure they can make the necessary adjustments to key performance indicators as a result of this change. If possible, it is recommended to first remove bot traffic from a small report suite to estimate the potential impact.
We recommend defining no more than 200 bot rules per report suite.
Bot traffic data is stored in a separate repository for display in the Bots and Bot Pages reports.
Description Rule Type
Selecting Include IAB uses the IAB/ABCe International Spiders & Bots List to remove bot traffic. This list is updated monthly by the IAB.
IAB
To submit a bot to the IAB list, visit http://www.iab.net/sites/spiders/form.php. Adobe is unable to provide the detailed IAB bot list to customers, though you can use the Bots Report to view a list of bots that have accessed your site.
See Create a custom bot rule. Custom Bot Rules
Impact of Bot Rules on Data Collection
Bot Rules are applied to all analytics data. Data removed by Bot Rules is visible only in the Bots and Bot Pages Reports. ASI Slots honor bot rules on historical data if they are enabled at the time of reprocessing.
VISTA rules are applied after Bot Rules (see Data Processing Order).
High-Hit Visit Processing: If more than 100 hits occur in a visit, reporting determines if the time of the visit in
seconds is less than or equal to the number of hits in the visit. In this situation, due to the cost of processing long, intense visits, reporting starts over with a new visit. High-hit visits are typically caused by bot attacks and are not considered normal visitor browsing.
Impact of IP Obfuscation on Bot Filtering
The IAB bot list is based solely on user agent, so filtering based on that list is not impacted by IP obfuscation settings. For non-IAB bot filtering (custom rules), IP may be part of the filtering criteria. If filtering bots using IP, bot filtering happens after the last octet has been removed if that setting is enabled, but before the other IP obfuscation options, such as deleting the entire IP or replacing it with some unique ID.?
If IP obfuscation is enabled, IP exclusion happens before the IP address is obfuscated, so customers don’'t need to change anything when they enable IP obfuscation.
If the last octet is removed, that is done before IP filtering. As such, the last octet is replaced with a 0, and IP exclusion rules should be updated to match IP addresses with a zero on the end. Matching * should match 0.
Create a custom bot rule
Custom bot rules let you filter traffic based conditions you define. Custom bot rules are defined using the following condition types: • User Agent
• IP Address • IP Range
Multiple conditions can be defined for a single rule. Multiple conditions are matched using "or". For example, if you provide a value for User Agent and IP Address, the traffic is considered bot traffic if either condition is met.
User Agent
A User Agent condition checks the user agent value to see if it starts with or contains the specified string. If
contains is selected, the substring is matched if it occurs anywhere in the user agent.
Optional values can be included in the does not contain list to define values that the user agent must not contain for a successful match. Multiple values can be specified by including one value per line. If the user agent meets the criteria specified in the match string, but also contains a string on the does not contain list, it is not considered a match.
The contains field is limited to 100 characters. The does not contain list is limited to 255 characters minus a separator character for each new line. (This is equal to the number of strings - 1. If you specify 4 does not contain strings, 3 separator characters are required.) All string matches are case-insensitive.
IP Address (including wildcard matches)
Matches an IP address or multiple addresses in the same block using wildcards (*). Provide the numeric values of the IP address you want to match. Substitute * for any values you want to match using a wildcard. The following list contains examples of IP address match string:
10.10.10.1 10.10.10.*
IP Address Range
Provide the start and end ranges of the IP addresses to match. Substitute * for any values you want to match using a wildcard.
To define a custom bot rule
1. In Admin Tools, select one or more report suites and click General > Bot Rules. 2. Click Add Rule and define one or more match conditions.
3. Click Save. The change should take effect within 30 minutes.
Upload bot rules
To bulk import bot rules, you can upload a CSV file that defines the rules. Create a CSV file with the following columns in the order presented:
Agent Exclude (255 char limit) Agent Include (100 char limit) Agent Match Rule (contains or starts with) IP End IP Start Bot Name
You can define three types of bot rules: • User agent contains or starts with • Single IP address or wildcard match • IP range match
Each row in the import file can contain only one of the following bot definitions:
• User agent contains or starts with: Provide a single user agent string to match in the Agent Include column. Specify the type of match you want performed by placing contains or starts with in the Agent Match Rule field. An optional value can be included in the Agent Exclude column that defines one or more pipe-delimited ( | ) strings that the Agent does not contain. String matches are case-insensitive. Both the IP Start and IP End columns must be empty.
• Single IP address or wildcard match: To match a single IP address (10.10.10.1) or wildcard IP address (10.10.*.*), place the same value in both the IP Start and IP End columns. Match Rule, Agent Include, and Agent Exclude must be empty.
• IP range match: Define a range of IP addresses using the IP Start and IP End columns. Wildcards can be used to match IP ranges, for example 10.10.10.* to 10.10.20.*. Match Rule, Agent Include, and Agent Exclude must be empty.
Multiple Rules Combined with OR
To match a bot using a combination of rules joined with an OR (for example, user agent or IP address), provide an identical name for all rules that you want to combine in the bot name field. AND matches are not supported.
Overwrite All Rules with an Upload File
Select the Overwrite existing rules checkbox to delete all existing rules and replace them with the rules defined in the upload file.
Exporting Rules
The Export Uploaded Bot File button exports all rules defined in the UI in a CSV format.
Classifications
Classifications are created by grouping (classifying) granular data from a source report. For example, you might want to analyze display ads, but they are mixed with email, partner, text ad, and social media campaigns. You can create groups so that you can analyze them separately.
There are three types of classifications for marketing reporting and analytics:
• Campaign classifications: Campaign classifications are defined as elements that will not vary within the campaign, such as campaign name and owner.
• Creative elements classification: These vary between placements or instances of the campaign, and include characteristics such as media type, headline, keyword, and media vendor.
• Metric-specific classifications: These are fixed numeric values associated with a campaign, such as the hard cost for a campaign. Additionally, you can classify prop and eVar variables.
Note: If you change names of existing classifications in Admin Tools, you must update classification rules
After you create conversion or traffic classifications, you can import classification data through the import tool, or use the Classifications Rule Builder.
About Classifications
A classification is a way of categorizing reporting and analytics variable data, then displaying the data in different ways when you generate reports.
When classifying, you are establishing a relationship between the variable and the metadata related to that variable. Classifications are most frequently used in campaigns. Data collected using variables (eVars, props, and events) information can be rolled up by applying metadata to the values collected in the variables.
Once classified, any report that you can generate using the key variable can also be generated using the associated attributes. For example, you can classify Product IDs with additional product attributes, such as product name, color, size, description, and SKU. Augmenting reporting and analytics data with additional attributes provides deeper and more complex reporting opportunities.
After creating the classifications, you can leverage the new data attributes throughout Marketing Cloud reporting and analytics
Tracking Codes Example
Suppose that instead of viewing campaigns just by the tracking code, you want to see campaign results by Search Engine, Keyword, and Campaign Channel. Rather than devoting conversion variables for each of those, you can create three classifications of the campaign variable to represent Search Engine, Keyword, and Campaign Channel. This strategy allows you to see site success events by all four variables, with no additional tagging.
Reporting and analytics includes pre-defined classifications for the tracking code variable, which offers
classification-based reports called Creative Elements and Campaigns. You must manually configure classifications for all other conversion and traffic variables.
See Traffic Classifications and Conversion Classifications.
The following table describes the different types of classifications that are available, and the variable types that support them. Review the information in General File Structure before uploading data files.
DESCRIPTION AVAILABILITY
TYPE
Text classifications define a category that lets you group variable data for reporting purposes.
Conversion and Traffic Variables
Text
For example, if you sell shirts, you might want to categorize shirt sales (conversions) by color, size, and style so you can generate reports that let you see shirt sales organized by these categories.
A date-enabled text classification lets you assign date ranges to a text Conversion Variables
Date Enabled Text
classification. This is typically used with campaign classifications so that you can take advantage of the Gantt chart view in the Campaigns report. You can include the actual campaign dates in the data file that populates the classification data. For more information, see Date.
Reporting and analytics collects campaign tracking codes even if the campaign end date is already past, but the campaign data collected after the end date of the campaign is not associated with the campaign. Numeric classifications let you apply fixed numeric values to Conversion Conversion Variables
Numeric
reports. These classifications appear as metrics in reports.
When considering whether to add a
Numeric classification, the numeric
value must be fixed and unchanging over time.
Sub-Classifications
Marketing reports support both single-level and multiple-level classifications models. A classification hierarchy allows you to apply a classification to a classification.
Note: Sub-classification refers to the ability to create classifications of classifications. However, this is not the
same as a Classification Hierarchy used to create Hierarchy reports. For more information about Classification hierarchies, see Classification Hierarchies in the Administration Help.
Single-Level Classifications
Single-level classification is the simplest model for classifying variable data. Single-level classification associates each classification directly to its reporting variable.
For example:
Each classification in this model is independent and corresponds to a new sub-report for the selected reporting variable. Furthermore, each classification constitutes one data column in the data file, with the classification name as the column heading. For example:
PROPERTY 2 PROPERTY 1 KEY A12B ABC 123 C3D4 DEF 456
For more information about the data file, see About Classification Data Files.
Multiple-Level Classifications
Multiple-level classification lets you create classifications of classifications.
Multiple-level classifications are comprised of parent and child classifications. For example:
Parent classifications: A parent classification is any classification that has an associated child classification. A
classification can be both a parent and child classification. The top-level parent classifications correspond to single-level classifications (See Single-Level Classifications).
Child classifications: A child classification is any classification that has another classification as its parent instead
of the variable. Child classifications provide additional information about their parent classification. For example, a
Campaigns classification might have a Campaign Owner child classification. Numeric classifications also function
as metrics in classification reports.
Each classification, either parent or child, constitutes one data column in the data file. The column heading for a child classification using the following naming format:
<parent_name>^<child_name>
For example: Property 2 Property 1^Property 1-2 Property 1^Property 1-1 PROPERTY 1 KEY A12B Small Green ABC 123 C3D4 Large Red DEF 456
Although the file template for a multilevel classification is more complex, the power of multilevel classifications is that separate levels can be uploaded as separate files. This approach can be used to minimize the amount of data that needs to be uploaded periodically (daily, weekly, and so forth) by grouping data into classification levels that change over time versus those that don't.
Note: If the Key column in a data file is blank, Adobe automatically generates unique keys for each data row.
To avoid possible file corruption when uploading a data file with second-level or higher-level classification data, populate each row of the Key column with an asterisk (*).
See Common Classification Upload Issues for troubleshooting help.
Classifications Example
An example classification mapping the Product ID, as captured in the Products eVar, to other data attributes. These attributes include SKU (key), product name, description, gender, size, and code. Additionally, each code has a child classification with the color name.
Note: Product classification data is limited to data attributes directly related to the product. The data is not
limited to how the products are categorized or sold on the website. Data elements like sale categories, site browse nodes, or sale items are not product classification data. Rather, these elements are captured in report conversion variables.
When uploading data files for this product classification, you can upload the classification data as a single file or as multiple files (see below). By separating the color code in file 1 and the color name in file 2, the color name data (which may only be a few rows) needs to be updated only when new color codes are created. This eliminates the color name (CODE^COLOR) field from the more frequently updated file 1 and reduces file size and complexity when generating the data file.
Product Classification - Single File CODE^COLOR CODE SIZE GENDER PRODUCT DETAILS PRODUCT NAME KEY Stone 01 M M Men's Polo Shirt, Short Sleeve (M,01) Polo-SS 410390013 Heather 03 L M Men's Polo Shirt, Short Sleeve (L,03) Polo-SS 410390014 Aqua 23 S F Women's Polo Shirt, Long Sleeve (S,23) Polo-LS 410390015
Product Classification - Multiple Files (File 1)
CODE SIZE GENDER PRODUCT DETAILS PRODUCT NAME KEY 01 M M Men's Polo Shirt, Short Sleeve (M,01) Polo-SS 410390013 03 L M Men's Polo Shirt, Short Sleeve (L,03) Polo-SS 410390014 23 S F Women's Polo Shirt, Long Sleeve (S,23) Polo-LS 410390015
Product Classification - Multiple Files (File 2)
CODE^COLOR CODE KEY Stone 01 * Heather 03 * Aqua 23 *
Conversion Classifications
Classifications are used to categorize values into groups and report at the group level. For example, you can classify all Paid Search campaigns into a category like pop music terms and report on the success of that category relative to metrics like Instances (click-throughs), and conversion to success events.
Conversion classifications let you classify conversion variables. Once classified, any report that you can generate using the key data can also be generated using the associated data properties.
Conversion Classifications Descriptions
Description Element
The classification name.
Name
Indicates if the text classification is a date range for campaign variables.
Date Enabled (Text Only)
Creates a list of classification values available for this classification. Use Options with campaign variables to
Options (Text Only)
provide users with a list of supported values for the classification in the Campaign Manager.
Specifies the type of number in the numeric classification. Options include Numeric, Percent, and Currency.
Number Type (Numeric Only)
Add conversion classifications
Steps that describe how to add conversion classifications in Admin. 1. Click Admin Tools > Report Suites.
2. Select a report suite.
3. Click Edit Settings > Conversion > Conversion Classifications.
4. From the Select Classification Type drop-down list, select the variable where you want to add a classification. 5. Mouse over the Edit Classification icon, then select Add Classification.
6. In the Select Type field, select the type of classification you want to add to the variable.
Options include Text and Numeric. For more information on classification types, see About Classifications. 7. In the Text Classifications dialog box, configure the classification as desired.
See Conversion Classifications Descriptions for information about these elements.
8. In the Dropdown List dialog box, add or remove options. Adding Options creates a list of classification values available for this classification. You can use this option with Campaign variables to provide users with a list of supported values for the classification in the Campaign Manager. Use this for classification dimensions where you have a small number of allowed values that rarely or never change. For example, you might run different campaigns aimed at different levels of customer loyalty: Silver, Gold, and Platinum. You could then use the drop-down list to ensure that the only values that are accepted are those that match your three levels. If anyone tries to use a different value, it gets discarded.
9. Click Save.
Traffic Classifications
Traffic classifications allow you to classify traffic variables (props). Traffic classifications can use only text classifications.
The Traffic Classifications page lets you create classifications for the selected report suites. Once classified, any report that you can generate using the key data can also be generated using the associated attributes.
After enabling classifications, use Classifications Importer (Upload) to assign specific values to the appropriate classification.
Add or Edit a Traffic Classification
Steps that describe how to add or edit classifications for the selected report suites. 1. Click Admin >Report Suites in the Suite header.
2. Select a report suite.
3. Click Edit Settings > Traffic > Traffic Classifications.
4. In the Select Classification Type field, select the variable where you want to add a classification. 5. Mouse over the Edit Classification icon, then select Add Classification or Edit Classification. 6. In the Text Classification dialog box, configure the classification as desired:
Name: Specify the classification name.
Description: Provide a more detailed description.
7. In the Dropdown List dialog box, add or remove options. Adding Options creates a list of classification values available for this classification. You can use this option with Campaign variables to provide users with a list of supported values for the classification in the Campaign Manager. Use this for classification dimensions where you have a small number of allowed values that rarely or never change. For example, you might run different campaigns aimed at different levels of customer loyalty: Silver, Gold, and Platinum. You could then use the drop-down list to ensure that the only values that are accepted are those that match your three levels. If anyone tries to use a different value, it gets discarded.
8. Click Save.
Deleting a Conversion Classification
Delete a conversion classification when it is no longer needed.
1. Open the Report Suite Manager by clicking Admin>Report Suites in the Suite header. 2. Select a report suite.
3. Click Edit Settings > Conversion > Conversion Classifications.
4. From the Select Classification Type drop-down list, select the variable where you want to delete a classification. 5. Mouse over the Edit Classification icon, then select Delete Classification.
6. In the Delete Classification dialog box, click Delete.
Classification Hierarchies
The Classification Hierarchies page lets you define classification hierarchies that you can use to create Hierarchy reports with the same name.
A Hierarchy report lets you drill down into increasingly refined data sets, based on the classification hierarchy, so you can more easily view data relationships.
You can build classification hierarchies for web pages, campaigns, products, or any other report variable. The Hierarchy report displays units, orders, and revenue for each of the variable classifications in the hierarchy. For example, if a Product hierarchy includes Apparel > Men's Clothing > Shirts > Polo Shirts > XL Polo Shirts, the Hierarchy report displays sales data for the Apparel classification. You can then drill down to see data about Men's Clothing, Shirts, Polo Shirts, and XL Polo Shirts. Classification hierarchies let you quickly identify how each classification in the hierarchy contributes to Apparel performance.
Create a classification hierarchy
Steps that describe how to create a classification hierarchy. 1. Click Admin >Report Suites.
2. Select a report suite.
3. Click Edit Settings > Conversion > Classification Hierarchies.
4. From the Build Hierarchy For drop-down list, select the variable where you want to create a classification hierarchy.
The classifications list automatically displays the classifications available for the selected variable.
5. Drag a classification into the Drag new hierarchy root here field to include it in the classification hierarchy. Drag classifications into the hierarchy in the order that you want them to appear in the hierarchy. The first classification is the hierarchy root, the second classification is the first subclassification, and so on. 6. Click Save.
Classifications Importer (Upload)
Use the importer to upload classifications into reporting and analytics. You can also export the data for updating prior to an import.
The data that you import using the import tool must be in a specific format. Adobe provides you with the option to download a data template with all the proper header details in a tab-delimited data file. You can add your new data to this template and then import the data file in the browser, using FTP.
Note: Adobe recommends that you limit the number of import and export columns to 30.
See Numeric 2 Classifications for information about uploading data using numeric 2 classifications.
See Common Saint Upload Issues: Knowledge Base article that describes issues arising from incorrect file formats and file contents.
About Classification Data Files
The importer lets you bulk-upload classifications data to analytics reporting in a file. The import requires a specific file format for successful data uploads.
To help you create valid data files, you can download a template file that provides a file structure into which you can paste the classifications data. For more information, see Download Classifications Template.
See Allowable Characters for more information about character limits in Reports & Analytics. See Numeric 2 Classifications for information about uploading data using numeric 2 classifications.
General File Structure
Example of a sample classifications data file and detailed information about its structure. The following illustration is a sample data file:
A data file must adhere to the following structure rules: • Classifications cannot have a value of 0 (zero).
• Adobe recommends that you limit the number of import and export columns to 30. • Uploaded files should use UTF-8 without BOM character encoding.
• Special characters, such as a tabs, newlines, and quotes can be embedded within a cell provided the v2.1 file format is specified and the cell is properly escaped. Special characters include:
\t tab character \r form feed character \n newline character " double quote
The comma is not a special character.
• Classifications cannot contain a caret (^) since this character is used to denote a sub-classification.
• Use care when using a hyphen. For example, if you use a hyphen (-) in a Social term, Social recognizes the hyphen as a Not operator (the minus sign). For example, if you specify fragrance-free as a term using the import, Social recognizes the term as fragrance minus free and collects posts that mention fragrance, but not free.
• Character limits are enforced to classify report data.
For example, if you upload a classifications text file for products (s.products) with product names longer than 100 characters (bytes), the products will not display in reporting. Tracking Codes and all custom conversion variables (eVars) allow 255 bytes.
See Allowable Characters for more information about character limits.
• Tab-delimited data file (create the template file using any spreadsheet application or text editor). • Either a .tab or .txt file extension.
• A pound sign (#) identifies the line as a user comment. Adobe ignores any line that begins with #.
• A double-pound sign followed by SC (## SC) identifies the line as a pre-processing header comment used by reporting. Do not delete these lines.
• Classification exports can have duplicate keys due to newline characters in the key. In an FTP or browser export, this can be resolved by turning on quoting for the FTP account. This will place quotes surrounding each key with newline characters.
• Cell C1 in the first line of the import file contains a version identifier that determines how classifications handle the use of quotes throughout the remainder of the file.
• v2.0 ignores quotes and assumes they are all part of the keys and values specified. For example, consider this value: "This is ""some value""". v2.0 would interpret this literally as: "This is ""some value""".
• v2.1 tells classifications to assume that quotes are part of the file formatting used in Excel files. So v2.1 would format the above example to: This is "some value".
• Problems can arise when v2.1 is specified in the file, but what is actually wanted is v2.0 - namely, when quotes are used in ways that is illegal under Excel formatting. For example, if you have a value: "VP NO REPS" S/l Dress w/ Overlay. With v2.1, this is incorrect formatting (the value should be surrounded by opening and closing quotes and quotes that are part of the actual value should be escaped by quotes) and classifications will not work beyond this point.
• Make sure you do one of the following: change your file format to v2.0 by changing the header (cell C1) in the files you upload, OR properly implement Excel quoting throughout your files.
• The first (non-comment) row of the data file contains the column headings used to identify the classification data in that column. The importer requires a specific format for column headings. For more information, see Column Heading Format.
• Immediately following the header row in a data file are the data rows. Each line of data should contain a data field for each column heading.
• The data file supports the following control codes, which Adobe uses to provide structure to the file, and correctly import classifications data:
DESCRIPTION CONTROL CODE
A carriage return or new line character functions as a separator between data records in the data file. Typically, you only need to specifically insert <Carriage Return> or <New Line>
these characters when writing a program to automatically generate data files.
Requests that Adobe automatically generate a unique id for this element. ~autogen~
In the campaign context, this control value instructs Adobe to assign an identifier to each creative element. See Key.
Designates that the data column represents the date range associated with the item. See Date.
~period~
Represents a NULL value for the current field. Use this if a particular data column does not apply to the current record.
Empty field
Designates that the data column represents a PER Modifier field. See
PER Modifier Headings. PER Modifiers
Column Heading Format
The column headings in a classification data file identify the data values in that column, and indicate how Adobe should process the values in that column.
Note: Adobe recommends that you limit the number of import and export columns to 30.
Classification files support the following column headings: Key
Each value must be unique across the entire system. The value in this field corresponds to a value assigned to the Analytics s_campaign variable in your Web site’s JavaScript beacon (s_code.js). Data in this column might include ~autogen~ or any other unique tracking code.
Classification
A Classification column heading contains the classification name.
For example, reports and analytics automatically include two classifications for Campaign variables: Campaigns and Creative Elements. To add data to the Campaigns classification, the column heading in the classification data file would be Campaigns.
Note: The values in the Classifications column heading must exactly match the classification’s naming
convention, or the import fails. For example, if the administrator changes Campaigns to Internal Campaign
Names in the Campaign Set-up Manager, the file column heading must change to match.
Additionally, the data file supports the following additional heading conventions to identify sub-classifications and other specialized data columns:
Sub-Classification Heading
To create a sub-classification column heading, use a caret (^) character to combine the classification name with the sub-classification name.
For example, Campaigns^Owner is a column heading for the column containing Campaign Owner values. Similarly,
Creative Elements^Size is a column heading for the column containing the Size sub-classification of the Creative Elements classification.
Classification Metric Headings
Classification Metrics headings are denoted by using the caret (^) and tilde (~) characters to combine the
classification name with the specific classification metric.
For example, Campaigns^~Cost refers to the Cost metric in the Campaigns classification. PER Modifier Headings
Immediately following a classification metric column, you must have a PER Modifier column that indicates the calculation to perform with the value in the classification metric field.
Per Modifier headings are denoted by adding ~per to the classification metric heading. For example, if the Metric
heading is Campaigns^~Cost, the PER modifier heading is Campaigns^~Cost~per. Adobe supports the following
PER Modifier keywords:
These characters have special meaning in a data file. Where possible, avoid using these words in attribute names and data.
FIXED: Fixed value. Do not perform any scaling.
DAY: Multiply the value by the number of days in the report.
ORDER: Multiply the value by the number of orders for the line item in the report.
CHECKOUT: Multiply the value by the number of checkouts for the line item in the report. UNIT: Multiply the value by the number of units for the line item in the report.
REVENUE: Multiply the value by the revenue amount for the line item in the report.
SCADD: Multiply the value by the number of times the Shopping Cart Add event was called per line item in the