SB10 Conference Paper Number: 59
INVESTIGATION OF INDOOR AIR QUALITY PROBLEMS IN UNIVERSITY OFFICES WITH A QUESTIONNAIRE
Maneerat Ongwandeea, Namphung Dungkokkruadb
aFaculty of Engineering, Mahasarakham University, Mahasarakham 44150, Thailand bFaculty of Public Health, Mahasarakham University, Mahasarakham 44150, Thailand
TYPE OF PAPER
This paper is a Scientific Paper and is not a Student Paper. ABSTRACT
Poor indoor air quality can cause sick building syndromes (SBSs) and other occupational health problems. This study was to assess indoor air problems in university offices of which the work environment is relatively different from typical private business offices. The study also examined the prevalence of work-related symptoms of the office workers. Fifteen faculty offices at Mahasarakham University in Thailand were selected to perform survey research using a MM-40 questionnaire, which was developed in Örebro, Sweden. The questionnaire comprises indoor air complaints in office environments and work-related symptoms. Moreover, levels of carbon dioxide (CO2) in the study
offices were measured to determine correlation with indoor air complaints. The survey was conducted during December 2008 to February 2009. The number of respondents was 214, a response rate of 96%. Results show that the reported indoor air complaints with a rate of over 30% were noise (38%) and varying room temperature (30%), while the reported work-related symptoms with a rate of over 20% were fatigue (22%) and feeling heavy-headed (20%). Most tasks of the university staff are usually associated with contacting and cooperating with students or visitors. These activities can generate noise, which possibly disturbs other nearby workers. The relative differences between the different groups with the t test indicated that women and those with allergies reported more indoor air complaints and work-related symptoms than men and non-allergy persons at the p<0.05. The CO2
levels measured in the study offices varied from 513-896 ppm, which were below the suggested value of 1,000 ppm by the American Society of Heating, Refrigeration and Air Conditioning Engineers (ASHRAE) for maintaining sound indoor air quality. The CO2 levels were not correlated with the
percentage of respondents who reported stuffy bad air or unpleasant odor. This implies that factors other than ventilation could also contribute to the complaints on indoor air problems such as the effects from individual factors. These people-related risk factors include personal characteristics, psychosocial phenomenon, and tobacco smoking.
KEYWORDS: indoor air quality; work-related symptoms; sick building syndromes. INTRODUCTION
Poor indoor air quality has been ranked as one of the United States’ greatest health risk concern (USEPA, 1997). It has become of significant concern because people spend time indoors, and indoor air concentrations of pollutants are greater than those found outdoors. Poor indoor air quality can cause occupational health problems such as experiencing sick building syndromes (SBSs). SBSs include respiratory symptoms (stuffy and irritated nose, rhinitis, cough, sore throat, and shortness of breath), skin symptoms, and other symptoms (fatigue, headache, fever) (Godish, 1994). These problems in the indoor air of workplaces can result in not only increasing the health care budget, but also decreasing the productivity of employees. In the United States and European countries, many researchers have investigated indoor air problems at work using information gathered from employees and/or technical measurements of air pollutants (Ten Brinke et. al., 1998; Raw and Roys, 1996). Reijula and Sundman-Digert (2004) investigated indoor air problems in offices in Finland by
questionnaire surveys. The most common problems were found to be dry air, stuffy air, dust or dirt in the indoor environment, and draught. The most common work related symptoms were irritated, stuffy, or runny nose, itching, burning, or irritation of the eyes, and fatigue. They concluded that the complaints and work related symptoms associated with indoor air problems were common in office workers.
Since legislation for energy conservation in buildings was implemented in 1992, a number of office buildings in Thailand have adopted energy-saving measures to reduce their energy usage. One of the most favorable energy saving measures is to make buildings airtight in order to minimize the loss of conditioned air. Air-conditioning or chilling systems typically account for 50-60% of the total amount of energy used in a building. The reduced air exchange rate results in a deterioration of indoor air quality, leading to occupational health problems. The US National Institute of Occupational Safety and Health (NIOSH) investigations during 1971-1988 identified that inadequate ventilation was the most important contributor to health complaints in buildings (Godish, 1994). Ventilation adequacy was determined by reference to a guideline value of 1000 ppm CO2. In this study, we conducted
investigation of indoor air problems in the university offices of which the work environment is relatively different from private business offices. The prevalence of work related symptoms of the office workers was also investigated. Furthermore, correlation between indoor CO2 concentrations
and reported indoor air problems in the study offices were examined. MATERIALS AND METHODS
The MM 040 Questionnaires developed by the Department of Occupational and Environmental Medicine, Sweden, (Andersson et. al., 2005) was used to assess indoor air problems in the university offices. The questionnaire includes six parts, i.e. background factors, work environment, work conditions, past/present diseases/symptoms, present symptoms, and further comments. The study was conducted in 15 university offices at the Mahasarakham University, Thailand, during December 2008 to February 2009. All study buildings have either split-type or central air-conditioning systems. The building walls are constructed with nonstructural clay masonry, coated with mortar plastering, and interior walls are painted with water-type paints. No sound absorption materials are used. All offices use gypsum board as ceiling material, rubber floor covering, and air conditioning system. The average number of workers is 15 in each office. The number of questionnaire respondents was 214, of whom 62 were men and 152 were women. The response rate was 96%. In this study, we focused on indoor air complaints that were reported every week as well as symptoms that occurred every week. All statistical analyzes were performed with SPSS® for Windows, version 12.0. We tested the significance
of the prevalence in differences between the gender and allergic history groups of the respondents with independent sample t test.
The CO2 concentrations were measured with a Testo® 350 M/XL sampler with an ambient CO2
infrared detection probe (Testo AG, Lenzkirch, Germany). The reading scales and accuracy are 0-10,000 ppm ± 5%. The indoor CO2 measurements were conducted in the middle of the study room
and measurements were carefully taken in order to avoid direct sampling of workers’ exhalation. CO2
data were collected automatically every 5 minutes for at least 30 minutes in each office. The temperature and relative humidity (RH) inside the offices were measured with a portable thermo-hygrometer with detachable RH/temperature probe (HANNA Instruments®, Rhode Island, USA).
RESULTS AND DISCUSSION
1. Indoor temperature, relative humidity, and CO2 concentrations
The indoor temperature varied from 21.9°C in Office 5 to 27.4°C in Office 12, while the relative humidity ranged from 42.3% in Office 1 to 59.9% in Office 5 as shown in Table 1. The average values were 25.2±1.3°C and 49.7±4.5% RH, which were close to the comfortable environment condition of 26°C at 50 – 60% RHfor air-conditioned buildings in Thailand (Yamtraipat et al., 2005). The university has launched energy conservation campaigns to reduce energy consumption. One of
SB10 Conference Paper Number: 59
the measures is to encourage the use of temperature set-point standard of 26°C for air conditioning system in the campus buildings because it is a simple way, but the most effective large scale energy saving method.
The CO2 concentrations measured in the study offices varied from 513 to 896 ppm, which were below
the suggested value of 1,000 ppm by the American Society of Heating, Refrigeration and Air Conditioning Engineers (ASHRAE, 1999) for maintaining sound indoor air quality. The average value was 652 ppm.
Table 1. Indoor temperature, relative humidity, and CO2 concentrations in the study offices*.
Office no. Temperature (°C) Relative humidity (%) CO2 concentration (ppm)
1 23.9±0.5 42.3±0.8 660±53 2 25.8±0.1 51.5±1.1 615±101 3 25.3±0.2 51.6±0.4 514±27 4 25.5±0.2 43.8±1.1 539±47 5 21.9±0.2 59.9±0.7 513±28 6 25.1±0.3 49.1±1.6 896±60 7 27.2±0.1 56.2±0.3 791±29 8 24.8±0.1 48.1±2.7 586±33 9 25.2±0.2 48.2±2.8 588±22 10 25.2±0.1 48.4±0.7 770±92 11 24.6±0.2 53.1±0.8 692±51 12 27.4±0.6 48.2±1.8 571±38 13 25.3±0.2 51.3±0.8 622±46 14 25.5±0.2 49.4±1.2 631±39 15 25.2±0.3 49.7±0.5 797±27
* mean ± standard deviation
2. Indoor complaints related to work environment
Table 2 shows the percentage of respondents who reported that the indoor air problems had occurred “every week” in their offices. The five most reported indoor air complaints were noise (38%), varying room temperature (30%), lighting problems (25%), unpleasant odor (25%), and stuffy bad air (24%). In this study, noise was perceived as the biggest problem for the university staff. As compared with our ongoing study in private business offices in Bangkok, Thailand, a dust and dirt problem is instead the most reported environmental complaint (43%), while a noise problem is reported at a low rate of 14%. The difference in complaint types related to environmental factors could be due to differences in work conditions. Most tasks of the university staff are usually associated with contacting and cooperating with students or people at most of the time. These activities can generate noise, which possibly disturbs other nearby workers. Moreover, no sound absorption materials are used in all study offices.
Table 2 also presents the p-values for independent sample t test indicating the different levels of respondents between the genders and allergic history groups. Women reported environmental problems more often than men. The percentage of women who reported room temperature too high/too low as well as experiencing static electricity were statistically greater than those of men (p<0.05). As expected, the allergic respondents reported environmental problems more often than the non-allergic respondents. The indoor air complaints that were statistically reported at the significant level less than 0.05 were room temperature too low, stuffy bad air, dry air, and unpleasant odor.
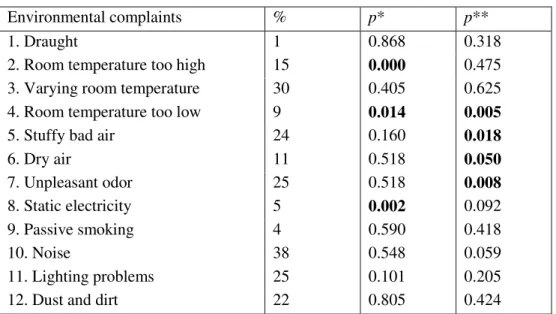
Table 2. Environmental complaints in office environments.
Environmental complaints % p* p**
1. Draught 1 0.868 0.318
2. Room temperature too high 15 0.000 0.475 3. Varying room temperature 30 0.405 0.625 4. Room temperature too low 9 0.014 0.005
5. Stuffy bad air 24 0.160 0.018
6. Dry air 11 0.518 0.050 7. Unpleasant odor 25 0.518 0.008 8. Static electricity 5 0.002 0.092 9. Passive smoking 4 0.590 0.418 10. Noise 38 0.548 0.059 11. Lighting problems 25 0.101 0.205
12. Dust and dirt 22 0.805 0.424
* p-value for the different levels between men and women
** p-value for the different levels between allergic and non-allergic respondents Bold numbers denotes significant difference at the 0.05 level
3. Symptoms related to indoor air problems
Table 3 shows the percentage of respondents who reported that the symptoms had occurred “every week” while working in their offices during the past three months. The four most reported symptoms were fatigue (22%), feeling heavy headed (20%), headache (19%), and difficulties concentrating (18%). For the prevalence of symptom, a rate of over 20% is considered higher than normal (Reijula and Sundman-Digert, 2004). These reported symptoms included fatigue and feeling heavy headed. Table 3. Symptoms related to indoor air problems.
Work related symptoms % p* p**
1. Fatigue 22 0.002 0.003
2. Feeling heavy headed 20 0.008 0.002
3. Headache 19 0.160 0.276
4. Nausea/dizziness 4 0.000 0.043
5. Difficulties in concentrating 18 0.564 0.425
6. Irritation of the eyes 8 0.982 0.080
7. Irritated, stuffy, running nose 8 0.871 1.000
8. Hoarse, dry throat 6 0.375 1.000
9. Cough 3 0.160 0.061
10. Dry or flushed facial skin 2 0.503 0.074
11. Hands dry 2 0.386 0.667
12. Scaling/itching scalp or ears 3 0.196 0.451 * p-value for the different levels between men and women
** p-value for the different levels between allergic and non-allergic respondents Bold numbers denotes significant difference at the 0.05 level
Table 3 presents the p-values for independent sample t test indicating the different levels of respondents between genders and allergic history groups. Women reported symptoms more often than
SB10 Conference Paper Number: 59
men. The statistically significant differences between the genders in experiencing work related symptoms (p<0.05) were fatigue, feeling heavy headed, and nausea/dizziness. The allergic respondents also reported symptoms more often than the non-allergic respondents. With the statistical analysis for the different levels between the allergic history groups, the work related symptoms were similar to those reported by most women.
4. Comparison with the reference data
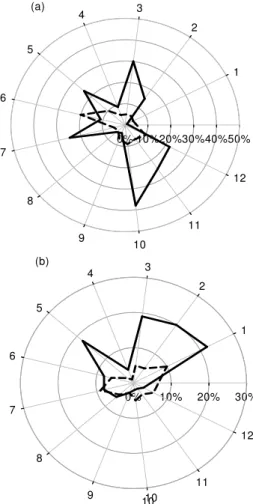
We compared the results from this study with the reference data for working environments without known indoor climate problems, which is considered to be “healthy buildings” (Andersson et al., 1993). Due to a lack of data from healthy buildings in Thailand, we adopted the reference data collected from the study covering seven offices and two schools in Sweden (Andersson et al., 1993). Figures 1(a) and 1(b) show the polar graphs for the assessment of environmental factors and symptoms, respectively. Note that the numbers on Figures 1(a) and 1(b) represent environmental complaints listed in Table 2 and symptoms listed in Table 3, respectively.
0% 10%20%30%40%50% 1 2 3 4 5 6 7 8 9 10 11 12 0% 10% 20% 30% 1 2 3 4 5 6 7 8 9 10 11 12 (a) (b) 10
Figure 1. Polar graphs for (a) environmental complaints and (b) symptoms.
Overall, the percentage of respondents who reported environmental complaints and symptoms in this study were higher than those reported from the reference data in all aspects, except dry air, draught, and skin irritation symptoms. This could be due to difference in the country climate, moisture air vs. dry air. The major environmental complaints in the university offices were noise, lighting, and room temperature problems (Figure 1(a)). Experiencing these environmental factors could be linked to the symptoms of fatigue, headache, and difficulties in concentrating as shown in Figure 1(b).
Current results Healthy buildings
5. Correlation between indoor CO2 and indoor complaints
The Pearson’s correlation coefficients between the in-office CO2 concentrations and the percentage of
respondents who reported that stuffy bad air and unpleasant odor had occurred were uncorrelated at α<0.05. Similarly, Godish (1994) reviewed a numbers of US and European studies on relationship between CO2 levels and prevalence of SBS symptoms. Results of these studies indicated that there is
apparently little or no relationship between CO2 levels and SBS symptoms or occupant
satisfaction/dissatisfaction with air quality. In this study, ventilation may not be a major factor that influences a number of respondents who reported the stuffy bad air and unpleasant odor complaints. Other workers’ individual characteristics and work environment may also affect the indoor air complaints.
CONCLUSION
The current study assessed indoor air problems in the university offices. The environmental complaints and work related symptoms were found to be associated with indoor air problems. The most reported indoor air complaint was related to a noise problem due to the characteristic task of the university staff that is usually associated with contacting and cooperating with students or people. This survey data can be used as reference material when conducting indoor air surveys in other workplaces.
ACKNOWLEDGEMENTS
This study was financially supported by the Faculty of Engineering, Mahasarakham University, Thailand. The authors thank Mr. Chaloemchai Mukthawat and Miss Suarpa Khumlan for the questionnaire survey. The authors also appreciate the cooperation of the Mahasarakham University staff.
REFERENCES
Andersson, K., Stridh, G., Fagerlund, I. amd Aslaksen, W. 1993. “The MM-questionnaires – A tool when solving indoor climate problems”. Department of Occupational and Environmental Medicine, Örebro University Hospital, Örebro, Sweden. Retrieved September 26, 2008, from http://www.orebroll.se/upload/USO/YMK/Dokument/Reference3eng.pdf.
ASHRAE. 1999 .Ventilation for acceptable indoor air quality”. ASHRAE Standards No. 62. American Society of Heating, Refrigeration and Air Conditioning Engineers.
Godish, T. 1994. “Sick Buildings: Definition, Diagnosis and Mitigation”. Lewis, Michigan.
Raw, G. and Roys, M. 1996. “Questionnaire Design for Sick Building Syndrome: An Empirical Comparison of Options”. Environmental International22, 61-72.
Reijula, K. and Sundman-Digert, C. 2004. “Assessment of Indoor Air Problems at Work with a Questionnaire”. Journal of Occupational and Environmental Medicine 61, 33-38.
Ten Brinke, J., Selvin, S., Hodgson, A., Fisk, W., Mendell, M., Koshland, C., and Daisey, J. 1998. “Development of New Volatile Organic Compound (VOC) Exposure Metrics and their Relationship to “Sick Building Syndrome” Symptoms”. Indoor Air8, 140-152
.
US EPA. 1997. “Risk Assessment and Risk Management in Regulatory Decision-Making”. Final Report. U.S. Environmental Protection Agency
.
SB10 Conference Paper Number: 59
Yamtraipat, N., Khedari, J., and Hirunlabh, J. 2005. “Thermal Comfort Standards for Air Conditioned Buildings in Hot and Humid Thailand Considering Additional Factors of Acclimatization and Education Level”. Solar Energy 78, 504-517.