Ramtron International Corporation ♦ http://www.ramtron.com
1850 Ramtron Drive Colorado Springs ♦ MCU customer service: 1-800-943-4625, 1-514-871-2447 x 208 Colorado, USA, 80921 ♦ 1-800-545-FRAM, 1-719-481-7000
Page 1 of 41 This user guide addresses the features, setup and
operation of the Versa Ware JTAG software for Flash programming and debugging of Ramtron’s high performance VRS51L2xxx and FRAM-enhanced VRS51L3xxx microcontroller series.
Table of Contents
1 Versa Ware JTAG Software Overview ...2
1.1 Minimum System Requirements to run Versa Ware JTAG...2
1.2 Target Environments...2
2 Versa Ware JTAG Software Installation Procedure ...3
3 Using the Versa Ware JTAG Programmer ...4
3.1 Interface Overview ...4
3.2 General Toolbar ...4
3.3 Status Bar ...5
3.4 Programmer Command Overview...6
3.5 File Information Window...7
3.6 Flash Menu ...9
3.7 Device Operation Control Menu...11
3.8 Versa Ware JTAG Device Options ...12
3.9 Security ...13
4 Using the Versa Ware JTAG Debugger ...16
4.1 General Requirements for the Debugger...17
4.2 Required Files for Debugging ...17
4.3 Debugger Commands Overview...19
4.4 Processor Controls...20
4.5 Memory Controls...20
4.6 Memory List Views ...21
4.7 Memory Table Views...22
4.8 Program Trace ...23
4.9 Source Views ...25
4.10 Address Tree...26
4.11 Debugger View Options ...27
4.12 Window Settings ...29
5 Watch List ...31
5.1 Add Watch...32
5.2 Removing a Watch...32
5.3 Editing an Existing Watch ...33
5.4 \Forcing a Value ...33
6 Breakpoints...34
6.1 Setting and Removing Breakpoints from an Address Tree or Source View ...34
6.2 Setting and Removing Breakpoints from a Memory View...34
6.3 Setting and Removing Breakpoints from the Watch List...34
6.4 Setting and Removing Breakpoints from the Breakpoint Settings Dialog ...35
6.5 Mutually Exclusive Breakpoints...36
6.6 Breakpoint Information Toolbars ...37
6.7 When a Breakpoint is Reached ...37
7 Command Line Options...38
8 Connection Problem Troubleshooting...38
8.1 Connection Error at Startup ...38
8.2 Connection Error during Session ...38
8.3 Intermittent Connection Errors ...39
www.ramtron.com Page 2 of 41
1
Versa Ware JTAG Software Overview
Versa Ware JTAG is a user-friendly, Windows®-based tool for system prototyping and design development with Ramtron microcontrollers that feature a JTAG interface (VRS51L2xxx/3xxx and future derivatives).
Versa Ware JTAG has two primary functions:
o Versa Ware JTAG Programmer
The Versa Ware JTAG Programmer provides a comfortable interface to perform operations such as erase, program, read, etc. on the target device’s Flash memory.
o Versa Ware JTAG Debugger
The Versa Ware JTAG Debugger is a user interface that links the in-circuit debugger to the source code. All Ramtron microcontrollers with a JTAG interface include an integrated debugger that enables in-application debugging of the device through its JTAG interface.
1.1 Minimum System Requirements to run Versa Ware JTAG
Versa Ware JTAG has been developed for Windows XP™, but it will also run on Windows 2000™, Windows Millennium™, Windows 98™ and Windows NT™ 4.0 operating systems, on a PC that meets the following system requirements:
• Intel Pentium® III 400MHz
• 128MB of RAM
• 10MB of hard drive space
• 1 free IEEE 1284 parallel port
• A session of Windows running in administrator mode for installation (except Windows 98™)
Only built-in motherboard parallel port and ISA parallel port cards are supported. A Versa-JTAG interface must be connected on LPT1. Please see Section 9 for more details on parallel port setup and supported modes.
1.2 Target Environments
Versa Ware JTAG Software is used the Versa JTAG - a parallel port to JTAG interface supplied by Ramtron. The Versa JTAG is connected to a VersaKit-20xx or VersaKit-30xx devboard, or to a PCB that incorporates a Ramtron JTAG-based device, such as the VRS51L2070 and the FRAM-enhanced VRS51L3074.
www.ramtron.com Page 3 of 41
2
Versa Ware JTAG Software Installation Procedure
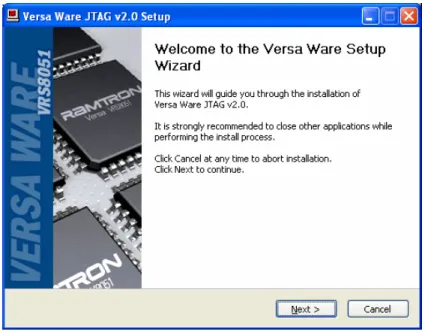
After downloading the Versa Ware JTAG Software setup file, begin the installation process by double-clicking on the icon below:
Versa_Ware_JTAG_20_SETUP.exe
Figure 1: Versa Ware JTAG Setup Screen
When the setup process is complete, the following icon will appear on the Windows™ desktop. Click it to launch the Versa Ware JTAG Software.
www.ramtron.com Page 4 of 41
3
Using the Versa Ware JTAG Programmer
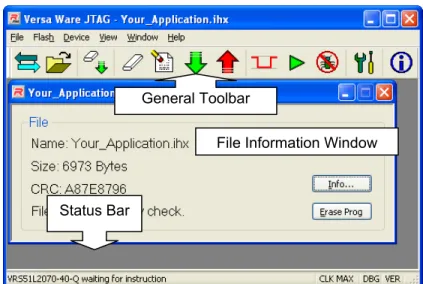
3.1 Interface Overview
The application window provides a quick and easy reference to all JTAG operations. These include:
• Toolbars
• Status bars
• Menus
Figure 2: Versa Ware JTAG User Interface
3.2 General Toolbar
The Versa Ware JTAG Programmer Software can perform 11 main functions, which are grouped onto a general toolbar. These functions are accessible when the software is in Programmer Mode.
Figure 3: General Toolbar
The toolbar can be moved from its default position at the top of the software’s main window Grab the general toolbar by left clicking the mouse and dragging the toolbar to your preferred location. The toolbar will return to its default position when the program is closed.
General Toolbar
Status Bar
www.ramtron.com Page 5 of 41
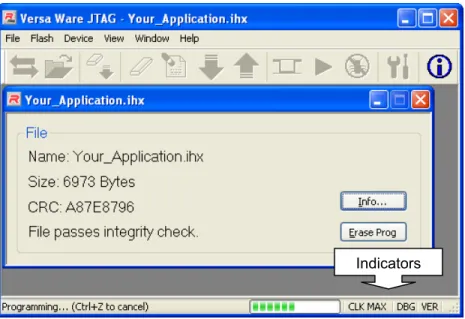
3.3 Status Bar
The status bar is located at the bottom of the Versa Ware JTAG Programmer window. It indicates the status of all Versa Ware JTAG Software activities.
Figure 4: Versa Ware JTAG While Performing an Erase and Program Operation
3.3.1 Indicators
The status bar indicators describe current device options. For more information on how to change them, see Section 3.8.
• Clock speed indicator: Displayed as CLK / n, shows the connected device’s boot-up clock divider setting. If
the divider is 1, CLK MAX will be displayed.
• Option indicator: If debugging is enabled, DBG will be displayed. If security is enabled, SEC will be
displayed. If neither is enabled, this area will be blank.
• Verification indicator: If verification is enabled, VER will be displayed; otherwise this area will be blank.
www.ramtron.com Page 6 of 41
3.4 Programmer Command Overview
The following table shows all of the possible programmer commands:
Command Toolbar button Menu Keyboard Shortcut
Synchronize File F2
Open File Ctrl + O
Info File Information Window Alt + I
Erase Flash
Erase Page Flash
Erase then Program Flash F5, Alt + E
Program Flash Alt + F5
Read Flash
Reset Device Ctrl + Alt + R
Run Device F8 Debug Device F9 Options Device Toolbar View Cascade Window Tile Window About Help
www.ramtron.com Page 7 of 41 The Versa Ware JTAG Programmer controls are grouped by function in the following locations:
• File Information Window and file menu
• Flash menu
• Device menu
3.5 File Information Window
The File Information window provides information about Hex file to be loaded. Versa Ware JTAG Software supports program files in the Intel Hex file format. These files typically end in .HEX or .IHX and consist of lines that begin with colons (:) followed by hexadecimal digits (A-F and 0-9). Most C compilers and cross assemblers are capable of generating Intel Hex files, but on some suites this may not be the default option. Consult the development environment’s user manual for more details.
Figure 5: File Information Window
The first line contains the filename. The file name, including the path, cannot exceed 1024 characters.
The second line is the size of the program in bytes. It is not the size of the file, but a calculation of how much space the program would occupy in the device’s Flash memory, if it were in one contiguous block. Empty space within the program is not counted. If the file is invalid, an error message will appear here.
The third line refers to the checksum. The checksum consists of 8 hexadecimal digits calculated using the CRC32 standard. A difference of even 1 bit between files will result in a different checksum. This is particularly useful to determine whether a file has been modified or corrupted, and is a good way to keep track of different versions with the same file name.
The fourth line refers to the integrity of the file. Each line of a properly-formed file has a checksum byte, which is the 2’s complement of the least significant byte of the sum of bytes of the rest of the line.
Formula for Calculating the Checksum in an Intel Hex File
(Sum of bytes after the colon except for last) mod 0x100 + (Last byte) = 0x100 Example: :0E0055007820439308E59B759BFF759D4F75C2 (0E + 00 + 55 + 00 + 78 + 20 + 43 + 93 + 08 + E5 + 9B + 75 + 9B + FF + 75 + 9D + 4F + 75) mod 100 + C2 = 73E mod 100 + C2 = 3E + C2 = 100 Å Checksum correct
www.ramtron.com Page 8 of 41 A file that fails the integrity check can still be used to program the device. Files that were modified by hand, or do not have the correct CRC value at the end of a given line, will cause an integrity failure. Corrupted files will also cause integrity failures. Files created by a Flash read will pass an integrity check, as the CRC is calculated and inserted at the end of each line created in the output file.
A file is automatically reloaded before programming, so that the most recent data is used.
Up to 16 file names and paths are retained between application sessions. These can be selected from the File menu.
3.5.1 Erase Prog Button
This button provides a quick shortcut to the “Erase then Program” command. See Section 3.6.1 for more details.
3.5.2 Extended File Information
Clicking the Info button on any File Information window will open a File information dialog.
Figure 6: Extended file information
The File information dialog provides general file information and device file information:
• General information includes:
o The complete file path
o The CRC (see Section 3.5 for more details) o When the file was created, modified and accessed
o File attributes: If the file is read-only, hidden, archive or system. Figure 6 displays an archive file. • Device information includes:
o Size of the file on the device (see Section 3.5 for more details) o Whether the file passed the integrity test (see Section 3.5)
o Whether the program can be debugged. A program can be debugged if it does not refer to addresses
above 0xFC00 in the program memory.
o Flash usage: The bars indicate how much of the Flash is being used by the current program. Ramtron
MCUs with a JTAG interface typically have 64KB of Flash memory for user programs. These indicators do not take into account empty space or the space occupied by a file already in the Flash.
www.ramtron.com Page 9 of 41
Debug. How much space the program occupies, taking into account that debugging requires 0xFC00 to 0xFFFF for mapping.
Release. How much space the program occupies without reserving space for debugger mapping.
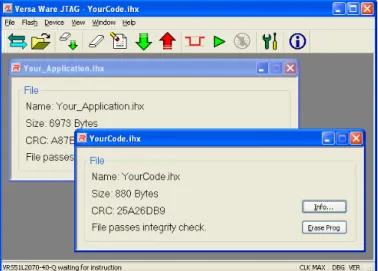
3.5.3 Working with Multiple Files
To use multiple files simultaneously, the Versa Ware JTAG Programmer allows more than one file information windows to be open at once. However, only one file can be programmed at a time. The selected file is displayed in the title bar of the main application window, and is the active window in the program. In Figure 7, the active window is YourCode.ihx. This will be the file used to program the device until the window is closed, another window is opened, or another file is opened.
Figure 7: Two file information windows open
3.5.4 Synchronize
Synchronize configures the communication protocol between the software and the target device, resetting the target device in programmer mode. If the power is not being controlled automatically, there may be a prompt requesting a power cycle.
Figure 8: Manual Power Control
3.6 Flash Menu
3.6.1 Erase then Program
This will erase the entire Flash memory and load the current file onto the device. This is the recommended method to program the target device: Erase then Program is the only way to debug a program or apply a security setting.
www.ramtron.com Page 10 of 41
3.6.2 Erase
This erases the entire Flash: It wipes the device clean for storage and is the only way to eliminate a security setting on a device (see Section 3.9 for more details on securing a device).
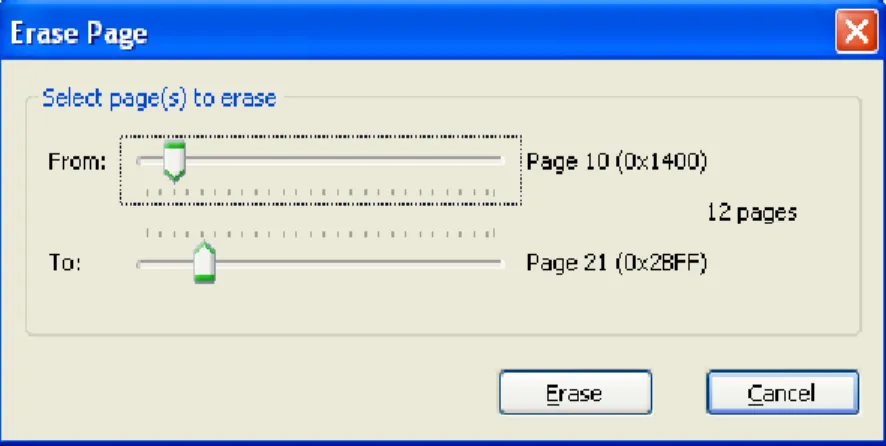
3.6.3 Erase Page
This erases one or more blocks of memory. The Flash on Ramtron’s VRS51L2070/3074 is separated into 128 distinct blocks of 512 bytes for the purpose of partial erasing. A dialog box will ask for the page(s) to erase.
Figure 9: Erase Page Dialog
3.6.4 Program
Program loads the file specified in the File Information Window onto the device without performing a Flash Erase. This is useful for loading supplemental data or code into the Flash after it was initially programmed with the Erase then Program function and for unsynchronized loading of data and programs. For example, Program can be used to load a sensor look-up table into the Flash.
A write error may occur during programming if the current files are written to locations that were not previously erased. If the Verification option is activated (this is strongly recommended, see Section 3.8.4), and an overlap condition occurs between two files, an error message will appear. An overlap will occur between two or more files that contain different data at the same address.
www.ramtron.com Page 11 of 41
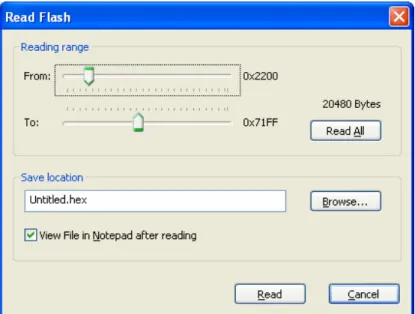
3.6.5 Read Flash
This will download the Flash contents into a text file compatible with the Intel Hex file format. A dialog box will be displayed indicating the destination and portion of the Flash to be read. After reading the Flash, the result can be displayed in Notepad automatically, if this option is selected.
Figure 10: Dialog Box for Flash Reading
3.7 Device Operation Control Menu
3.7.1 Run
Executes the program loaded onto the target device: The device is placed in JTAG Run Mode, which will allow communication via the JTAG while the device is running. In this mode, the boot-up clock divider is capped to a minimum of Main Clock / 128. For more details, see Section 3.8.1.
3.7.2 Debug
Debug runs the loaded program in JTAG Debug Mode. Please see sections 4 to 6 for more information.
3.7.3 Reset
Reset sends a reset pulse to the target device. An MCU reset does not affect the JTAG circuitry, therefore, communication is unaffected. Reset works best when the device is in JTAG Run Mode.
3.7.4 Device Options
This button opens the Device Options dialog for configuring the device. Please see Section 3.8 for more information.
www.ramtron.com Page 12 of 41
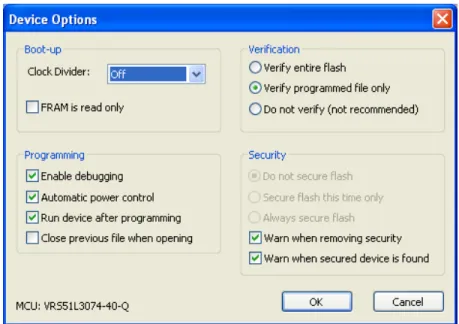
3.8 Versa Ware JTAG Device Options
Figure 11: Device Options Dialog for the VRS51L3074
3.8.1 Boot-up
Configure the target device via the Device Options dialog box (see Figure 11). These settings cannot be changed without a properly connected target device.
• Clock Divider: This sets the speed at which the device will boot up. This is useful for applications that require
low power consumption upon device startup.
o Off will boot the device at the maximum speed
o The clock divider is adjustable in factors of 2 down to 32768.
o Note that when the device is in JTAG Mode, the clock divider is limited to main clock / 128.
• FRAM is read only: This will disable writes to the onboard FRAM. This option is only applicable to
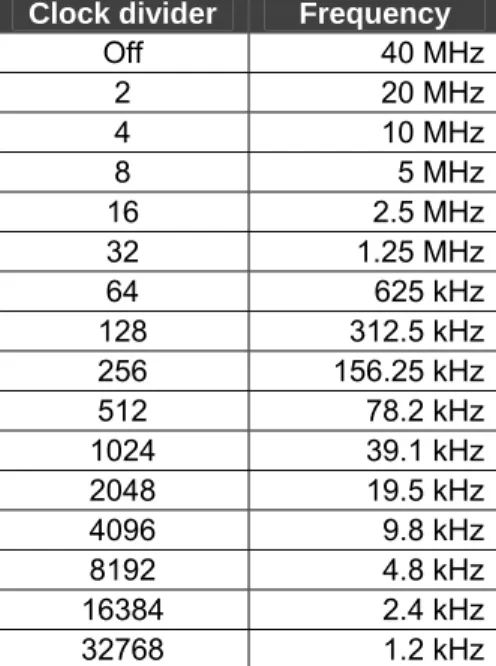
www.ramtron.com Page 13 of 41 For example, if using the self-oscillator on a VRS51L2070, the frequencies at boot-up for the clock dividers are:
Clock divider Frequency
Off 40 MHz 2 20 MHz 4 10 MHz 8 5 MHz 16 2.5 MHz 32 1.25 MHz 64 625 kHz 128 312.5 kHz 256 156.25 kHz 512 78.2 kHz 1024 39.1 kHz 2048 19.5 kHz 4096 9.8 kHz 8192 4.8 kHz 16384 2.4 kHz 32768 1.2 kHz
Table 3: Boot-up Clock Divider settings for the VRS51L2070 Self-Oscillator
3.8.2 Enable Debugging
This option enables debugging of the program loaded onto the device. Activation of the in-circuit debugger and the Flash security functions are mutually exclusive.
3.8.3 Automatic Power Control
An MCU reset does not affect the JTAG circuitry; therefore, a power cycle may be required to ensure that the device is in JTAG Mode. When a VersaKit development board is being used, the software can control the power of the device automatically. Otherwise, the Automatic Power Control checkbox must remain unchecked in order to synchronize with the device. (See section 3.5.4)
3.8.4 Verification of Flash Content
After programming, the Flash memory is read back to ensure that it was programmed correctly. Verification settings include:
• Verify the Entire Flash: Every value is read back and areas that were not programmed are checked to ensure
that they are set to 0xFF.
• Verify Programmed File Only: This will only inspect for programming errors. Areas that were not programmed will not be checked. This is the default option, and is faster than verifying the entire Flash.
• Do Not Verify: This skips the verification process. It is not recommended, but offers the fastest programming.
During a Program operation, if activated, the Flash verification process will only be performed in the section of Flash referenced in the Hex file that was used as a source for the programming, even if Verify the Entire Flashis selected.
3.9 Security
The Versa Ware JTAG Programmer includes a Flash security option to prevent further reading/writing. If security is enabled, the next time a program is loaded into the Flash, the memory will be inaccessible. Any attempt to program or read the Flash will always result in 0xFF. A user program can still modify the Flash and access the Flash via code. Secure devices cannot be debugged.
www.ramtron.com Page 14 of 41 There are three options to secure a device, accessed via the Programming Options window:
• Do Not Secure Flash: The default option. No protection is applied.
• Secure Flash This Time Only: This enables security options for the next programming operation only. The
security option will not be applied to the next device programmed.
• Always Secure Flash: This enables security for all subsequent devices until this setting is changed.
The device will not be secure until the next Erase then Program is executed (see Section 3.6.1).
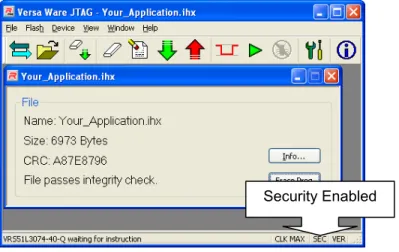
SEC will be displayed on the bottom right of the window when the security option is enabled (see Figure 12).
Figure 12: Security Option Enabled
3.9.1 Synchronizing with a Secured Device
When the JTAG software synchronizes with a secured device, the following message is displayed:
Figure 13: A Secured Device
www.ramtron.com Page 15 of 41
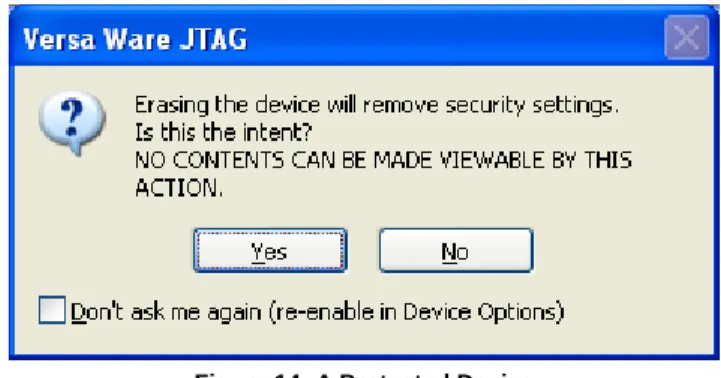
3.9.2 Removing Security
The security setting can be changed by clicking Flash Erase. Upon the first attempt to remove security, a warning message will be displayed:
Figure 14: A Protected Device
Click <No> to maintain device security. Click <Yes> to erase the device and remove its security.
www.ramtron.com Page 16 of 41
4
Using the Versa Ware JTAG Debugger
The Versa Ware JTAG Software incorporates a friendly user interface to interact with the in-circuit debugging features of all Ramtron microcontrollers equipped with a JTAG interface.
The Versa Ware JTAG Debugger provides a link between the in-circuit debugger and the source code. It allows the user to monitor program execution, set breakpoints, single step through the code, and read/modify memory locations. The in-circuit debugger also provides advanced features such as program tracing and variable watch.
The following figure shows the Versa Ware Debugger in action:
www.ramtron.com Page 17 of 41
4.1 General Requirements for the Debugger
In order for the Versa Ware Debugger to work properly, all the files generated by compiling or assembling should be grouped into the same directory. No changes are made to these files.
The following development environments, compilers and assemblers are currently supported by the Versa Ware JTAG Debugger:
• Keil µVision3 development suite
• Raisonance RIDE 51 development suite
• MetaLink Cross Assembler
• AS31 Cross Assembler
• ASX8051 Cross Assembler
• SDCC (Small Device C Compiler)
4.2 Required Files for Debugging
Each development environment produces different file outputs for use with the debugger. The following table lists the files required for optimal debugging. All files must have the same root name (see Section 4.2.1) and all files must be in the same directory.
Development Environment Required Files
SDCC .ASM for each source file
.C for each source file
.IHX
.RST for each source file
Raisonance RIDE 51 .AOF
.HEX
.LST for each source file
.M51
Assembler source files
C source files
Keil µVision3 (No extension)
.HEX
.LST for each source file
.M51
.UV2
Assembler source files
C source files
MetaLink Cross Assembler .ASM
.DBG
.HEX
AS31 Cross Assembler .HEX
.LST
ASX8051 Cross Assembler .ASM
.IHX
.RST
Table 4: Files Required for Proper Debugging
www.ramtron.com Page 18 of 41
4.2.1 Example Projects
Your_Application.C (as seen in all figures) was created using SDCC. These files are necessary to run the debugger:
• Your_Application.C
• Your_Application.ASM
• Your_Application.IHX
• Your_Application.RST
If a project named Example was created using Keil µVision3, and consisted of File1.C and File2.C, the required files for debugging are:
• Example (no extension)
• Example.HEX • Example.M51 • Example.UV2 • File1.C • File1.LST • File2.C • File2.LST 4.2.2 Variable Extraction
All of the supported environments, with the exception of ASX8051 and AS31, can have the variable names used in development automatically extracted and placed next to their mapped addresses. For SDCC, the --debug option must be used when compiling to create a .CDB file for variable extraction, but this is not mandatory. Symbols in the assembler that are assigned using the EQU statement are not extracted. SFR names are extracted according to the
connected device, not the development environment.
4.2.3 Multiple File Projects
SDCC, Raisonance RIDE 51, and Keil µVision3 can have multiple source files to generate a Hex file. All files must be in the same directory. Follow the development environment’s user guide for setup instructions. For SDCC, if there is more than one source file, the --debug option must be used when compiling to create a .CDB file.
www.ramtron.com Page 19 of 41
4.3 Debugger Commands Overview
The following table shows all of the possible commands for the debugger:
Command Toolbar Toolbar button Menu Keyboard Shortcut
Run Debugger Action F7
Step Debugger Action F6
Halt Debugger Action Ctrl + Backspace
Restart Debugger Action
Jump Debugger Action
Stop Debugging Debugger Action
Copy Edit Ctrl + C
Find Edit Ctrl + F
Find next Edit F3
Go to Edit
Refresh Debugger View Ctrl + R
View SFR Debugger View Ctrl + Shift/Alt + S
View IRAM Debugger View Ctrl + Shift/Alt + I
View XRAM Debugger View Ctrl + Shift/Alt + X
View Program Trace Debugger View Ctrl + Shift + T
View Watch Debugger View Ctrl + Shift + W
View C files View View
View Assembler files View View
View Address Tree View View Ctrl + Shift + S
View Toolbars View
View Options View Ctrl + Shift + V
Toggle Breakpoint 0 Breakpoint Ctrl + B
Toggle Breakpoint 1 - 5 Breakpoint Ctrl + F1 to Ctrl + F5 Breakpoint Settings Debugger Breakpoint Ctrl + Shift + B
Add Watch Debugger Watch
Edit Watch Debugger Watch
Force Watch Debugger Watch
Remove Watch Debugger Watch
Break on Value Debugger Watch
Disable Value Breakpoint Watch
Cascade View Window
Tile View Window
60:40 Horizontal View Window
75:25 Vertical View Window
About Help
Erase then Program Program Flash F5
Erase page Program Flash
Read flash Program Flash
www.ramtron.com Page 20 of 41
4.4 Processor Controls
4.4.1 Run
This command lets the program operation continue at full speed from the current program counter location.
4.4.2 Single Step
This command serves to execute one line of code at a time. This is like setting a breakpoint after each instruction.
4.4.3 Halt Execution
This command unconditionally stops the processor. While the program is running, it may be useful to stop the processor in order to verify where the program is currently running.
4.4.4 Restart
This command restarts the program from address 0x0000. This is particularly useful if the program has passed a breakpoint, or if multiple analyses of the program are being performed. Restart does not reset memory locations.
4.4.5 Jump
Use this command to jump anywhere in the program unconditionally. A dialog will open requesting a location in Flash to jump to. Be careful when using this command, because no check is performed to verify if the target location is valid. For instance, if a jump to location falls between instructions or within a data block, device operation might become erratic.
4.5 Memory Controls
Industry standard 8051 derivatives, such as Ramtron MCUs, include four main types of memory locations.
• Program Memory: Also known as code space, this is where the program resides. Any operation on code
space is done by the programmer (see Section 3 for more details). Debugging is interrupted when reading the Flash, erasing a page or reloading a program.
• Internal SRAM: Also known as data and idata, this memory space provides the fastest access. It is referred to
by the debugger as IRAM.
• External SRAM: Also known as xdata and pdata, this memory area refers to the 4KB of SRAM mapped from
0x0000 to 0x0FFF on the external data memory bus, and provides more storage. It is referred to by the debugger as XRAM, although it is integrated into the device.
• Special Function Registers: Also known as SFR’s, these registers provide access to on-chip peripherals.
Ramtron JTAG devices, such as the VRS51L2070/3074, have two SFR pages. These controls serve to monitor and modify the memory content:
• View SFR
• View IRAM
• View XRAM
• View Program trace
Each of these controls opens a window that displays a selected portion of the device’s memory. Portions of SFR, IRAM, and XRAM can be viewed simultaneously via the Watch List. Please see Section 5 for more details.
www.ramtron.com Page 21 of 41
4.6 Memory List Views
When the View SFR, View IRAM or View XRAM commands are applied, a window showing a grid is displayed with the current contents of each memory space:
Figure 16: Memory List Views (Code Minimized)
4.6.1 Changing Memory / SFR Content:
It is possible to manually change the memory content by double clicking any cell, making the change and pressing <Enter>. If this is an SFR window, the entire contents will be refreshed, otherwise, only the cell will be refreshed. The displayed value is always guaranteed to be current. The editor will try to format according to the current display type. For more information on display types, see Section 4.6.3.
Warning:
• Changing content directly may have unintended consequences on program flow or peripheral operation.
• Some SFR addresses are partially or completely read-only and cannot be overwritten. The device will not be damaged if you attempt to write to a read-only register.
• Some peripherals must be enabled before their associated SFR can be changed.
• If the processor is stopped within a program segment that is executing from XRAM, the debugger will not display correct XRAM values because the hardware has disabled the external memory. For more information on how code can be run from the XRAM, please consult the device datasheet.
• Do not edit XRAM values if the processor is stopped within a program segment that is executing from the XRAM.For more information on how code can be run from XRAM, please consult the device datasheet.
4.6.2 Variable Names
As shown in Figure 16, it is possible to enter text next to a location in IRAM or XRAM. This can be a variable name or a meaningful comment. To do so, double click any cell, make the change and press <Enter>. Where possible, variable names are automatically extracted, and any changes will automatically update the Watch List.
www.ramtron.com Page 22 of 41
4.6.3 Changing the Display
The View menu can be used to alter the display by checking the appropriate menu item. Checking an item from the View Column menu will display the column, unselecting the item will remove the column from display. At least one address column and at least one value column must remain visible.
The menu items are as follows:
• Name: The name of the location
• Address: The name address of the location
• ASCII: The ASCII character associated to the value • Bin: The value of the SFR in binary
• Hex: The value of the SFR in hexadecimal
• Decimal: There are two ways to display values in decimal
o Unsigned: Values of bytes are displayed between 0 and 255 o Signed: Values of bytes are displayed between -128 and 127
4.7 Memory Table Views
When View XRAM Table or View XRAM Table commands are applied, a grid will be displayed with the contents of each memory space.
Figure 17: External Memory and Internal Memory Table Views (Code Minimized)
4.7.1 Changing Content:
It is also possible to manually change the memory content when table view is activated. To do so, double click any cell, make the change and press <Enter>. The cell will then be refreshed.
www.ramtron.com Page 23 of 41
Warning:
• Changing content directly may have unintended consequences on program flow or peripheral operation.
• If the processor is stopped within a program segment that is executing from XRAM the debugger will not display correct XRAM values.This is due to the hardware disabling external memory. For more information on how code can be run from external RAM, please consult the target device datasheet.
• Do not edit XRAM values if the processor is stopped within a program segment that is executing from the XRAM.For more information on how code can be run from XRAM, please consult the target device datasheet.
4.7.2 Changing the Display
The View menu can be used to alter the display by checking the appropriate menu item. Clicking an item from the View Type menu will change the display accordingly. The menu items are:
• ASCII: The ASCII character associated to the value • Bin: The value of the SFR in binary
• Hex: The value of the SFR in hexadecimal
• Decimal: There are two ways to display values in decimal
o Unsigned: Values of bytes are displayed in between 0 and 255 o Signed: Values of bytes are displayed in between -128 and 127
4.8 Program Trace
Clicking on the program trace button will show the last 23 branches taken. The most recent branch is #23 and the least recent is #1. Double-click on any address to scroll the tree view to the appropriate address.
Figure 18: Program Trace
When in JTAG Debug Mode, the target device records the address of the instruction when it performs a jump with any of the following 8051 instructions: AJMP, LJMP, SJMP, JC, JNC, JB, JNB, JBC, JMP, JZ, JNZ, CJNE, and DJNZ. This is
www.ramtron.com Page 24 of 41 The display is only refreshed when the processor stops or when the window is first displayed. If the program is running when the window is opened, the processor will halt.
4.8.1 Looping Modes:
The Program Trace features two looping modes: repeat and skip. Skip Mode, the default, will only record a branch once per loop. Repeat Mode will record all of the branches. The following example shows the difference between the two modes:
ORG 2000h Start:
MOV A, #10 ; Load ACC with 10
Loop:
DEC A
JNZ Loop
LCALL Function ; Call a function
JMP Start
ORG 3000h Function:
RET ; Dummy function
Branch Loop Repeat Loop Skip 1 0x2003 0x2003 2 0x2003 0x2005 3 0x2003 0x2008 4 0x2003 0x2003 5 0x2003 0x2005 6 0x2003 0x2008 7 0x2003 0x2003 8 0x2003 0x2005 9 0x2003 0x2008 10 0x2003 0x2003 11 0x2005 0x2005 12 0x2008 0x2008 13 0x2003 0x2003 14 0x2003 0x2005 15 0x2003 0x2008 16 0x2003 0x2003 17 0x2003 0x2005 18 0x2003 0x2008 19 0x2003 0x2003 20 0x2003 0x2005 21 0x2003 0x2008 22 0x2003 0x2003 23 0x2005 0x2005
Table 6: Difference between Program Trace Modes
Notice that repeat mode records each time JNZ jumps, except when ACC is equal to 0. Loop Skip Mode will only show
that there was a branch taken at 0x2003, but not how many times it was taken.
To use Skip Mode, select menu item “No Duplicate Addresses” in the Edit menu. Uncheck this item to repeat loops. Every time this is done, the program trace is cleared.
The program trace can also be cleared by selecting Clear from the Edit menu.
To determine how many times a section of code has looped, set a breakpoint both before and after the loop in the program memory. When the first breakpoint hits, open the Program Trace window, and uncheck “Do not repeat loops”
www.ramtron.com Page 25 of 41 (if it is already unchecked, select Clear from the Action menu). Disable the breakpoint and click Run. When the second breakpoint hits, the Program Trace window will display how many times the program looped. This works best for small loops.
Note:
• Interrupts are not recorded by the program trace, but the jump to the ISR from the interrupt vector is.
• Function calls (ACALL and LCALL) are not recorded by the program trace.
4.9 Source Views
These views (assembler source and C source views) are copies of the raw source file, and contain embedded debugger information. The syntax is highlighted for easy viewing. Clicking on a line will show where the line of code is mapped to the address in the status bar. This allows for easy breakpoint setting. See Section 4 for more information on breakpoints.
www.ramtron.com Page 26 of 41
4.10 Address Tree
This view provides a better visual of how C source code is mapped to instruction addresses. Clicking on a line will show where the line of code is mapped to the address in the status bar. This allows for easy breakpoint setting. See Section 4 for more details on breakpoints. At any time, a tree can be expanded or contracted. This view is only available for projects using C as the primary language.
www.ramtron.com Page 27 of 41
4.11 Debugger View Options
This property dialog allows hundreds of configuration combinations for the Versa Ware JTAG Debugger:
Figure 21: Debugger View Options
4.11.1 Display Options
This tab focuses on general display settings. In the “Windows” box, code view options are controlled.
• Show on startup: Indicates what views (if any) will be shown when debugging is first started. • Double-click options: Determines the action to be executed when a code line is double-clicked.
The “Toolbars at startup” box shows which toolbars will be displayed, if any, when the debugger is launched. By default, they are docked to the top of the window.
The “Ask” and “Warn” checkboxes refer to pop-ups that may appear in special situations. These options may be unchecked here, or unchecked by checking “Don’t ask/tell me again” when the dialog appears.
Warn when not all info is available: This will issue a warning if an attempt is made to debug C code compiled by
www.ramtron.com Page 28 of 41
4.11.2 Font Options
The “Assembler Font” and “C Font” tabs allow full control over the fonts and colors of syntax highlighting in code views. Tab stops can also be adjusted
Figure 22: Font Options
4.11.3 Memory View Options
The “External RAM”, “Internal RAM”, and “SFR” tabs control the operation of memory views.
Figure 23: XRAM Options
Automatically Update All Locations: This setting allows the software to update views when stopped. Note that
XRAM transfers can take about five seconds and can slow performance when stepping ( ) through code.
Toolbar Button: This sets the behaviour of toolbar buttons . By default, clicking one of these buttons will ask which view to show.
www.ramtron.com Page 29 of 41
4.11.4 Other Options
This is where the remaining options are located:
Figure 24: Other View Options
Fonts for the Tree Views and the Watch List can be adjusted here. Note that only the font is adjustable, style changes such as bold, italic, or underline are ignored.
Auto-Arrange Windows: This enables preferred window arrangement upon window opening. See Section 4.12 for more details.
4.12 Window Settings
From the Window menu, there are four main ways to arrange windows automatically.
4.12.1 Cascade
Windows are set to the same size and placed diagonally, overlapping each other. This is done without regard to the window type.
www.ramtron.com Page 30 of 41
4.12.2 Tile
Windows are set to the same size and placed vertically next to each other. This is done without regard to the window type. See Figure 19 for an example.
4.12.3 60:40 Horizontal
Code views are tiled vertically in the left 60% of the application window, and the other views are tiled vertically in the right 40% of the application window. See Figure 15 for an example.
4.12.4 75:25 Vertical
Code views are tiled in the top 75% of the application window, arranged vertically, and the other views are placed in the bottom 25% of the application window, arranged horizontally.
www.ramtron.com Page 31 of 41
5 Watch
List
The Watch List provides a quick way to view all relevant memory locations. Watch variables, “watches”, can be customized to show the most relevant information. The commands to operate watches are:
Figure 27: Watch List (Window Maximized)
The Watch List is refreshed each time the processor stops, a new watch is added, and the refresh command is issued. Refreshing will stop the processor.
www.ramtron.com Page 32 of 41
5.1 Add Watch
This command brings up a dialog to add a watch to the list. New watches are added to the end of the list.
Figure 28: Adding a Watch When adding a watch, there are four elements to consider:
• Name: This should reflect location. Names of SFR’s cannot be edited; these names must be selected from the
Name Combo box. XRAM and IRAM names can be any text.
• Location: The memory location. This can be IRAM, XRAM or either SFR page. See Section 4.5 for more
details.
• Address: The address of the watch.
• Value Type: The way the value will be displayed can be any one of the following:
o ASCII: The ASCII character associated to the value o Bin: The value of the SFR in binary
o Hex: The value of the SFR in hexadecimal
o Decimal: There are two ways to display values in decimal
Unsigned: Values of bytes are displayed between 0 and 255
Signed: Values of bytes are displayed between -128 and 127
Watches added manually are not saved between software sessions, but are saved between debugging sessions. The name will be added to memory views, and that memory location will be refreshed.
5.2 Removing a Watch
This command will remove a watch from the list. If there is a breakpoint associated with the watch, it will not be disabled.
www.ramtron.com Page 33 of 41
5.3 Editing an Existing Watch
Figure 29: Editing a Watch
This command permits a watch to be changed. Any of the parameters of adding a watch can be changed, including its address. If there is a breakpoint associated with the watch, it will not be disabled. The name will be changed in the memory views if the name was changed, and that memory location will be refreshed if the location was changed.
5.4 \Forcing a Value
This command allows a value to be changed. This value must be in the same format as the watch. If <Force> is clicked, the display will be refreshed. The displayed value is always guaranteed to be directly from the processor. For more information on display types, see Section 5.1.
Figure 30: Forcing a Value
Warning:
• Changing content directly may have unintended consequences over program flow or peripheral operation.
• Some SFR addresses are partially or completely read-only and cannot be overwritten. No error message occurs if a read-only register is written to and no damage is done to the device.
• Certain peripherals must be enabled before their associated SFR can be changed.
• If the processor is stopped within a program segment that is executing from XRAM the debugger will not display correct XRAM values.This is due to the hardware disabling external memory. For more information on how code can be run from external RAM, please consult the device datasheet.
• Do not edit XRAM values if the processor is stopped within a program segment that is executing from the XRAM.For more information on how code can be run from external RAM, please consult the device datasheet.
www.ramtron.com Page 34 of 41
6 Breakpoints
The debugger allows for six different breakpoints. By default, they are not enabled. Changing any breakpoint setting will halt the processor. Breakpoints can be set for the following conditions:
• Address in code space (the line of code being executed)
• Address of a memory location
• Value of a memory location
6.1 Setting and Removing Breakpoints from an Address Tree or Source View
Setting a breakpoint from an address tree or a source view is simple. Select the line that will become a breakpoint and choose “Toggle breakpoint x” from the Breakpoint menu or from the Context menu (right click). To disable a breakpoint, select Toggle again or set the same breakpoint elsewhere.
If the option is enabled, double clicking a line of code will toggle Breakpoint 0.
Address Trees will display a numbered arrow next to where the breakpoint is set. Code views will highlight the line in yellow.
6.2 Setting and Removing Breakpoints from a Memory View
Setting a breakpoint from a memory view is also simple. Select the line that will become a breakpoint and choose “Toggle breakpoint x” from the Breakpoint menu or from the Context menu (right click). The relevant cell(s) will turn yellow. To disable a breakpoint, select Toggle again or set the same breakpoint elsewhere.
6.3 Setting and Removing Breakpoints from the Watch List
6.3.1 Standard Breakpoints
To set a breakpoint from a watch list, select the line that will become a breakpoint, and choose “Toggle breakpoint x” from the Breakpoint menu or from the Context menu (right click). The line will be marked with a numbered arrow. . To disable a breakpoint, select Toggle again or set the same breakpoint elsewhere.
6.3.2 Value Breakpoints
To set a value breakpoint in the watch list, select the line that will become a breakpoint, and choose “Break on value” from the Watch menu or from the Context menu (right click). The following dialog will appear:
Figure 31: Setting a Value Breakpoint from a Watch List
Enter the value at which to break in the format specified (the same format as the entry in the Watch List). When <Set> is clicked, a flag will appear next to the entry.
www.ramtron.com Page 35 of 41
6.4 Setting and Removing Breakpoints from the Breakpoint Settings Dialog
To view and adjust all the breakpoint settings at once, open the Breakpoint Settings dialog.
Figure 32: Breakpoint Settings Window
6.4.1 Standard Breakpoints
Breakpoint information is presented from left to right. To set a breakpoint, mark the checkbox. The address refers to the location of the breakpoint and the Combo box selects the memory space. Click <Apply> to accept the changes and apply all of them simultaneously. Changes to breakpoints only occur after the <Apply> button is clicked. All entries are in hexadecimal.
Click <Undo> to revert to the last applied settings. <Undo> does not disable breakpoints.
6.4.2 Value Breakpoints
Breakpoint information is presented from left to right. To set a breakpoint, select the checkbox. The address refers to the location of the breakpoint and the Combo box selects the memory space. Click <Apply> to accept the changes and apply all of them at once. Changes to breakpoints only occur after the <Apply> button is clicked. All entries are in hexadecimal.
To set a breakpoint, complete the settings in the Value tab of the Breakpoint Settings window (see above). For example, “When 0x123 in XRAM equals 0x45” will stop the processor when 0x45 is written to address 0x123 in XRAM. Click <Undo> to revert to the last applied settings. <Undo> does not disable breakpoints.
6.4.3 Setting a Skip Count
Breakpoint 0 and Value Breakpoint 1 can be configured to stop the processor after a specific number of times. This is most useful for breakpoints set within a loop in code space, but it can be applied for any breakpoint type. Select a number between 0 and 254 in the Edit box and click <Apply> to set the skip counter.
Setting the skip counter will halt execution of the program in the target device, if it is running. Setting the skip counter to 0 will stop the processor each time the established condition is met.
www.ramtron.com Page 36 of 41
6.5 Mutually Exclusive Breakpoints
Value breakpoints take the space of two standard breakpoints. Table 7 shows the relationship between standard and value breakpoints. When Value Breakpoint 1 is set, Breakpoint 0 and Breakpoint 1 will be disabled, and be unable to be set. Standard Value 0 1 1 2 3 2 4 5 3
Table 7: Mutually Exclusive Breakpoints
When setting Breakpoint 0 or Breakpoint 1, Value Breakpoint 1 will be disabled, and be unable to be set. Figure 33 shows an example of this behavior.
Figure 33: Mutually Exclusive Breakpoints
When setting value breakpoints in the Watch List, placement is automatic. If a value breakpoint cannot be set, the following warning message will be displayed:
www.ramtron.com Page 37 of 41
6.6 Breakpoint Information Toolbars
These toolbars, grouped in pairs, provide quick access to which breakpoints have been enabled and where they are set to trigger. They can be docked to the top or bottom of the application window, or they can float.
These bars display data in black when breakpoints are set and gray when breakpoints are disabled.
Figure 35: Breakpoint Information Toolbars
Variable names are displayed in the place of raw addresses where possible. These names are retrieved from the Watch List. See Section 5 for more details.
6.7 When a Breakpoint is Reached
When a breakpoint in code space is reached, the program stops before the instruction is executed and displays a
message indicating which breakpoint was triggered. For breakpoints in memory and for value breakpoints, the program stops after the instruction is executed. At this point, any other action can be performed (e.g. view SFR content).
www.ramtron.com Page 38 of 41 Once the desired operations are complete, choose either run ( ) to resume the program or step ( ) to advance one instruction at a time. See sections 4.4.1 and 4.4.2 for more details.
7
Command Line Options
Versa Ware JTAG is distributed with a command line tool called VWJTAG that can be used in scripts or as a companion to this software. For more information, please consult VWJTAG ReadMe. This HTML file is located in the same directory as VWJTAG, or in the Start menu under “Programs\Ramtron\Versa Ware JTAG”.
8
Connection Problem Troubleshooting
8.1 Connection Error at Startup
Once Versa Ware JTAG is launched, it will try to synchronize with the target device. If the communication fails, the following error message will appear:
Figure 37: Unable to Connect to Device Possible causes for this error are:
• The programming interface is not connected to the PC
• The programming interface is not powered
• The target device is not correctly inserted into the socket
• The development environment does not have automatic power control (see Section 3.8.3)
• Parallel port settings are incorrect (see Section 9)
Rectify the above condition(s) and use the Synchronize command.
8.2 Connection Error during Session
If the power is cut, the JTAG cable unplugged or if the PC goes into standby, hibernate or shutdown, a connection error will occur during debugging or programming. An error message will appear and the window will be closed. Reconnect and try again.
www.ramtron.com Page 39 of 41
8.3 Intermittent Connection Errors
If programming often fails or debugging sessions are frequently interrupted, check for the following situations:
8.3.1 Dongles
Software that requires a hardware key (dongle) can cause problems when concurrently run with Versa Ware JTAG. These programs tend to interrupt communication to the VersaKit development system, in search for hardware keys, even under the following circumstances:
• Program minimized
• USB dongle is installed
• Current license does not require a dongle but a different license package does
Do not connect the JTAG adaptor to a parallel port dongle, connect it directly to the port instead.
8.3.2 Too Many Applications Running
Applications that require a lot of system resources may cause connection problems.
9
Parallel Port Setup
Versa Ware JTAG software requires a dedicated PC parallel port. The port must either be built onto the motherboard, or an ISA card. PCI cards or USB adapters are not supported.
The port must be in ECP mode and use address 378h. These settings can be found in the system BIOS at boot-up for ports built onto the motherboard.
The Versa-JTAG must be connected to LPT1. Make sure all other devices have been uninstalled from both the JTAG and LPT1. Interrupts must be disabled. To do this, go to the Device Manager in System Properties, and click “ECP Printer Port (LPT1)”. (ECP might not be listed, ensure the correct setting in the BIOS).
www.ramtron.com Page 40 of 41 Figure 39: Device Manager Window
Right-click the port and then select “Properties” to bring up the settings window for LPT1, and then navigate to the tab. Ensure that “Never use an interrupt” is selected in the Filter resource box.
www.ramtron.com Page 41 of 41 On the Resources tab, ensure that LPT1 uses ranges 0378h to 037Fh, as well as range 0778h to 077Bh. If these values do not appear in the window, try correcting them in the BIOS (for motherboard parallel ports), or the port’s driver configuration page (for ISA parallel ports).
If the values still do not match, uncheck “Use automatic settings” and set the configuration manually. Multiple attempts may be necessary.
Figure 41: Resources Used for LPT1 Restart Windows once the LPT1 settings are set.
Disclaimers
RIGHT TO MAKE CHANGES
Ramtron International Corporation, “Ramtron”, reserves the right to make changes to its products - including circuitry, software and services - without notice at any time. Customers should obtain the most current and relevant information before placing orders.
USE IN APPLICATIONS
Ramtron assumes no responsibility or liability for the use of any of its products, and conveys no license or title under any patent, copyright or mask work right to these products and makes no representations or warranties that these products are free from patent, copyright or mask work right infringement unless otherwise specified. Customers are responsible for product design and applications using Ramtron parts. Ramtron assumes no liability for applications assistance or customer product design.
LIFE SUPPORT
Ramtron products are not designed for use in life support systems or devices. Ramtron customers using or selling Ramtron’s products for use in such applications do so at their own risk and agree to fully indemnify Ramtron for any damages resulting from such applications.
DEBUGGING
Ramtron provides its debug tools for the sole purpose of working with the customer’s own circuitry, software and services. Any attempt to copy, disclose, disassemble, or reverse-engineer Ramtron’s circuitry, software and services, a customer’s circuitry, software and services, or a third party’s circuitry, software and services, without prior consent is not permitted by Ramtron or by its associates. Ramtron assumes no responsibility for damages caused by any attempt to copy, disclose, disassemble, or reverse-engineer circuitry, software or services.
COPYRIGHTS
Third party tools such as, but not limited to, emulators, simulators, compilers, linkers, and assemblers, are subject to the terms of their individual license agreement(s). Consult the user guide(s) of any tool before using it in conjunction with Ramtron products.