Lab 2 – Sensor Modeling
Introduction to the Wiimote and the Wiimote LABVIEW
Interface
1. Objective In this lab, you will:
i. Become familiar with the Wiimote
ii. Understand the LABVIEW Bluetooth interface to the Wiimote iii. Calibrate the accelerometers on the Wiimote
iv. Experimentally measure the bandwidth of the accelerometers used in the Wiimote
2. Equipment
i. Computer with LABVIEW 8.5 installed ii. D-Link DBT-120 USB Bluetooth dongle iii. Wii sensor Test LABVIEW VIs
3. Theory a. Introduction
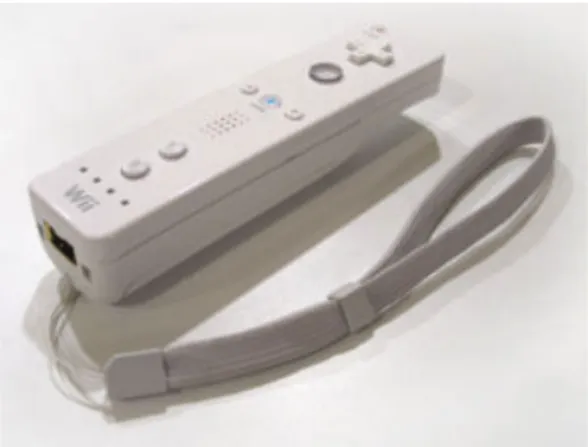
The Wii Remote [1] (nicknamed Wiimote, refer to figure 1) and the optional Nunchuck controller (refer to figure 2) [2] are the controllers for Nintendo’s Wii console. We are going to collectively refer to the two controllers as the “Wiimote” from now on. A main feature of the Wiimote is its “motion sensing” capability which allows the user to interact and manipulate items in the video game through the use of accelerometers and optical sensor technology.
In this lab, you will explore the capabilities of the Wiimote using LABVIEW. In particular you will characterize the accelerometers on the Wiimote.
Figure 2. Nunchuck controller
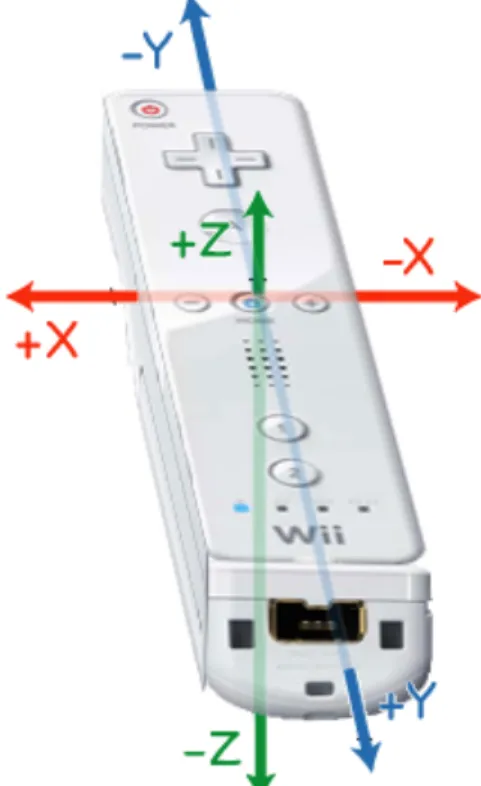
b. The Wiimote accelerometers
The Wiimote has two ADXL330 3-axis accelerometers: one on the Wii Remote and the other on the Nunchuck. Figure 3 below shows the axes orientation on the Wii Remote. You will determine the axes orientation on the Nunchuck in the lab.
Figure 3. Axes orientation on the Wiimote
The accelerometers on the Wii Remote and the Nunchuck are the ADXL330 from Analog Devices.
4. PRELAB EXERCISES
1. Thoroughly read the ADXL330 datasheet (refer to [1])
2. Thoroughly read the Wii Remote Bluetooth specs (refer to [2]) 3. Thoroughly read the Nunchuck Bluetooth specs (refer to [3])
4. What is the Wii Remote Report ID and the appropriate payload information to turn on LED 3 in the Wii Remote?
5. What is the Wii Remote Report ID and the appropriate payload information to turn on rumble functionalty?
5. IN LAB EXERCISES
1. The first two exercises are designed to help you understand the Wiimote Bluetooth protocol and LabVIEW.
a. You may have noticed that the sensor test VI turns on LED 1 on the Wii Remote. Modify the given VI so that LED 3 is turned on.
b. Modify the VI to enable the Rumble feature on the Wiimote when the VI starts. Now, make sure the Rumble feature turns off when the VI is terminated (hopefully you understood LabVIEW concepts from Lab 1 and thoroughly read [2]).
c. Question: What would happen if you tried to turn on two LEDs simultaneously in the LabVIEW VI? That is, what effect would you see on the Wii remote? Why?
d. Question: Give a brief overview of what this VI is doing (For library calls, include a brief sentence of what it’s doing).
2. In this second part, you will determine the accelerometer bandwidth.
a. Determine the bandwidth of the accelerometer used in the Wiimote (hint: READ [1] page 12).
b. Question: What is the bandwidth, what is the significance of this value? c. Question: Think about how you can obtain this value. If you could not
open up the a sensor and measure the actual circuit values, what methods could you use to determine the bandwidth?
3. In this part, you will perform a simple calibration of a 2D version of the 3D accelerometer that comes with the Wii [4] used above. Through calibration we intend to compensate for differences in specifications between instances of the accelerometer chip or the interfacing circuitry that surrounds a specific circuit instance.
We are going to be measuring the output of the accelerometer. To that effect we have connected an evaluation board [5] with such an accelerometer to a data acquisition (DAQ) board [6]. Channel X and Y are connected to Analog Input channels 0 and 1, respectively, in single-ended mode. The device is powered by the 5V supply from the DAQ board. The
Calibrate XY Accelerometer (Shell).vi provides the necessary code to constantly monitor these channels and display them on the front panel. Please complete the following tasks:
a. Question: Describe the steps taken to acquire the data in the given VI. b. For this calibration exercise we are going to compensate the output of the accelerometer so that we can use three known acceleration points, 0g (perpendicular to gravity, 1g (in the direction of gravity, and -1g (in
the opposite direction of gravity).
Modify the VI so that you can convert the output of both channels to be between -1 and 1 g, and record the values of m and b, assuming a simple xc = m*x + b. Assume that you will have three button that will help you guide the steps of the measurements:
1. Snap XY Offset, 2. Snap X Scale, and 3. Snap Y Scale.
You would press the first button when the accelerometer is at rest parallel to earth, then the second one when the accelerometer should be reading 1 g in the x direction, and then when it should be reading 1 g in the y direction.
c. Question: Please describe if you think we need to also take the measurement at -1g to use for calibration. Why or why not.
d. Compare the resulting values for offset and scale with what you would have expected given that the device is being powered by 5 V from the DAQ device (you may want to measure the voltage powering the device).
Hint: Notice that you are capturing 10 points at each iteration, so you may want to average these (DC value) to get an estimate of the value of the accelerometer.
e. Verify that you can measure the pitch (x) and roll (y) angles 0, 45, 60, and 90 deg (hint: READ [4] page 13).
f. Notice that in the steps a-c we have used the raw chip connected to a measurement device that uses an Analog to Digital Converter (ADC) and already converts it engineering units (Volts). In many embedded systems, you operate directly on the binary codes returned by the ADC. This is the case with the Wiimote you used in the first part of this lab.
Use the Calibrate Wii Accelerometer (Shell).vi to
interface to the Wiimote and read the value of the accelerometers used in the Wii, and then perform a similar calibration step, as well as reading of the angles. Here you be reading the raw data from the converter. You should be able to use most of the software you developed in question 3b above for this purpose.
Notice that in this case we are doing what is called an end-to-end calibration, i.e. we did not calibrate/scale the ADC in a first step (to remove differences and convert to engineering units (Volts)) and then the accelerometer, but rather we went directly from ADC values to g’s. g. Question: Please describe and compare the units of the conversion in
both sets of measurements.
h. Question: Think about how you could get the position values for the accelerometers, explain briefly on what steps need to be taken.
6. REFERENCES [1] ADXL330 datasheet.
http://www.analog.com/UploadedFiles/Data_Sheets/ADXL330.pdf Last accessed: January 15th 2008
[2] Wiimote information from Wii wiki. http://www.wiili.org/index.php/Wiimote
Last accessed: January 15th 2008
[3] Nunchuck information from Wii wiki:
http://www.wiili.org/index.php/Wiimote/Extension_Controllers/Nunchuk Last accessed: January 15th 2008
[4] ADXL322 datasheet. http://www.analog.com/UploadedFiles/Data_Sheets/ADXL322.pdf [5] ADXL322EB datasheet http://www.analog.com/UploadedFiles/Evaluation_Boards_Tools/669650958ADXL322E B_0.pdf [6] NI USB-6009 http://www.ni.com/pdf/manuals/371303k.pdf 7. REVISION HISTORY