TRADING SYSTEM DEVELOPMENT
PRECISION TRADING SYSTEM
An Interactive Qualifying Project Report
Submitted to the Faculty of
Worcester Polytechnic Institute
In Partial Fulfillment of the Requirements for a
Degree of Bachelor of Science
BY
MARK YANDIAN JOHN DOWNEY SHAWN POPIESKI
ADVISED BY:
PROF. MICHAEL J RADZICKI
1
Abstract
The purpose of this IQP was to scientifically develop a stock trading system in an attempt to beat the market, generate alpha. During this process, group members researched the fundamental concept and theories about step-by-step processes related to how to develop a trading system. Team members then determined which process was to be taken to identify just what system they wanted to create. The system was then back-tested to determine its effectiveness and profitability.
2 TABLE OF CONTENTS Chapter 1 _____________________________________________________________ 4 Introduction _______________________________________________________________ 4 Purpose of Project ___________________________________________________________ 5 Obtaining Alpha
Beat the Market Method of Madness System Objectives ____________________________________________________________ 5 Winning Percentage Annual Return Chapter 2 _____________________________________________________________ 6 Position Sizing ________________________________________________________________ 6
Our Sizing System
Why we Chose Certain Numbers?
Selecting Stocks ______________________________________________________________ 7 Stock Screener Share Price Market Cap Beta Volatility Profit Margin Current Events Chapter 3 ____________________________________________________________ 10
Trade Station Application______________________________________________________ 10
Pros and Cons
Asset Classes _______________________________________________________________ 11
Stocks Bonds Options
Trading and Investment Strategies ______________________________________________ 12
3
CAN Slim
Technical Analysis______________________________________________________14
Precision Trading System
Support and Resistance Strategies
Order Types _______________________________________________________________17 Market Orders Limit Orders Stop Orders Chapter 4_________________________________________________________________19 Strategy Structure____________________________________________________19 Regression Analysis Short Term Long Term Gapping
Gapping up and down Full Gaps
Partial Gaps
Chapter 5_____________________________________________________________24 Implementation of Strategy____________________________________________24
Half Hour Regressions Full Day Regressions Gap Up Examples Gap Down Examples
Chapter 6_____________________________________________________________32 Conclusion__________________________________________________________32
Final Spread Sheets Analysis
4
Chapter 1
Introduction
The Stock Market is not something that has just come around in the last 20 years. It is something that has been around for hundreds of years. Over the years, the way people trade the market has developed to greater and greater heights. Way back when trading just came on the scene, everything was done in the “pits”, where investors had people manually put their trades into the market. Since the “old” ways of trading started it all, many new forms of trading have been developed.
Since the late 1990’s, the invention of the internet changed the world of trading forever. The internet has allowed everyday people to directly invest into the market. Platforms that were once only available to brokers and financial investment groups are now available worldwide to everyone. Computerized trading platforms, such as TD Ameritrade™ and TradeStation™, have emerged and given people a more hands-on tool to control their own financial futures. However, that could also be a negative effect on people’s financial futures. Most everyday citizens do not understand the process of actually handling their own
investments. As a result, the majority of people are unsuccessful while trading. The greater percentages of citizens end up just listening to others’ recommendations without taking their own situation into consideration (Economides).Page?
5
The general population does not understand all the scientific reasoning behind
managing their own trading platforms. The purpose of this project is to help people try to get a general idea of what it takes to develop their own criteria to successfully beat the market and generate a consistent profit.
Purpose of the Project
Due to a lack of information, many people do not fully understand all the ins and outs of just exactly how much it takes to develop and manage their own stock portfolios. With this project, we hope to help people realize all the scientific testing and reasoning that goes into managing their investments. This report discusses the amount of background research and how a trading system, scientifically, is constructed and tested. Initially, background research is performed to gain an understanding of trading and generating a trading system. Next, the report goes into what steps are taken so any average citizen can implement the steps and become a more successful trader. Then how the system was tested to ensure that the system was profitable; to make sure the system can generate alpha. Alpha is generated when a trading system generates a rate of return that beats a benchmark such as the S&P 500. Lastly, the report provides further information on how the system could further be improved if a trader was to use it to trade.
System Objectives
With this project, we are hoping to help everyday citizens understand a few concepts to determine the successfulness of their systems. Winning percentage, annual return, and low draw-down are just a handful of goals people should consider prior to building a system. Most
6
people think if you do not have a high winning percentage, the system is a failure. On the contrary, consistency over a long period of time is more important. Annual return is a very important factor when building your system; a good annual return, over a long period of time, shows consistency and as a result a very successful system. Keep these facts in mind while building and analyzing a system and success is in your future.
Chapter 2
Position Sizing
When applying a system to trading, the amount being traded is just a valuable as the price of the stock (Bryant 5). This is where position sizing comes into play. We decided to use a fixed-fraction formula to give us a specific number of shares to purchase based on a few
factors. There are various methods of developing a position sizing formula but we decided on a fixed-fraction formula (Bryant 5). This is what the formula looks like:
N = ff*Equity/[Trade Risk]
Where N is the quantity of stock, ff is our fixed fraction (5%), Equity is the current amount of money willing to risk, and Trade Risk is the price of the unit we are looking at (Bryant). This approach is considered Martingale due to there not being a direct correlation between a winning streak, and the quantity of the stock performing the streak. However, due to total equity being included in the formula, the more equity the user obtains, the larger any given position size will be (Investopedia Anti-Marg). We decided to choose five percent for the fixed fraction because it is low enough to not make a huge dent in a person’s account if they lose, but
7
has an average risk per rate on return. This is an example of how to apply the formula: Say we are interested in Facebook at $62.70 and want to buy the correct amount of stock.
N= .05 * 400,000/[62.70] = 318
Based on our formula, 318 shares would be the correct amount to purchase. Position sizing is very useful because it keeps the amount of shares organized and it keeps total equity organized (Bryant 6). However, before position sizing even begins, choosing the correct stock is an entire different process.
Selecting Stocks
Deciding specifically what to trade can be a very overwhelming process with all of these different markets and stocks out there. As a trader, you want to have a sense of the tendencies and history of a stock before partaking in it. Part of our system for this project was to pick out which stocks we felt were going to succeed based on outlines that we deemed appropriate. We would listen to advice from the web, speculate based on current events, and we even had our own stock screener to set us up with worthwhile stocks.
Stock Screener
A stock screener is a system of standards for a stock to meet before it is traded. Our stock screener was designed to have parameters that appropriately fit what we wanted for our system. The challenge with creating a stock screener is formulating the parameters so that it can produce a correct number of options. As a trader, you do not want less than 4 or 5 stocks to appear because that limits the potential of making money. However, if there are more than 20
8
stocks it can become very overwhelming and your focus can be lost. The standards in our particular screener have proven to give us an appropriate number of options right around 10-15. Below is a description of the 4 steps of our screener:
Share Price: Min: $40 Max: $75
We deemed this as an acceptable range due to the average price of the NYSE being $28.65 (CNN). Our range is set greater than that, and based on market trends it makes more sense to go above the average than stay with or below it.
Market Cap: Min: $500 Million Max: $10 Billion
The market cap is the share price multiplied by the total volume of that particular stock (Yahoo Screen Settings). This range gives us some flexibility because there is a great difference between the numbers. Although the difference is great, since we already set the share price, it makes sure that the volume plays more of a factor for the market cap than the price.
Beta Volatility: Min: 1.5 Max: 3.0
The beta volatility is a ratio of a stock’s price in relation to the entire market (Yahoo Screen Settings). A beta ratio of 1 determines that the share price is changing at the same rate as the market (Yahoo Screen Settings). Our range is setup so that the share price is moving up and down faster than the market rate, therefore giving us a greater opportunity for high risk – high reward.
9
Our final standard is profit margin, which is the percent of income kept from sales revenues (Yahoo Screen Settings). This is a critical component because it gives a sense of what companies are staying active internally beyond just what the market depicts. This range was set because it is a solid indication of whether a company is succeeding and does not put too much pressure on any given stock.
The parameters of the screener are implemented for a trend-following system. The large market cap range gives the screener the ability to look at a wide range of stocks. Beta volatility is factored to make sure that the stocks that fit the market cap range are also being traded frequently. The standards of our beta volatility bring about stocks that fluctuate in value. This means that the stocks being presented are more susceptible for a trend in either direction. The profit margin is the final standard to prove that the companies behind each share are actually producing results. It gives a confirmation that not only is the share price at a good range, and the share is highly traded, but that the company is also finding some success. Companies that find profit will tend to have more positive trends.
10
Stocks from current events
The media is a powerful tool when it comes to trading in the market. When news breaks about a certain company, there is a very high chance the market will react to it. This is why the stock screener was not our only method of selecting stocks. There were various times over the course of this year when reports would come out regarding a new product, management change, IPO release, or just general news about a company. The next step for our team was applying our system appropriately to these company’s stocks, whether it was buying or selling. This method was not used heavily in our system, however it was appropriate because the news would predict breakouts of either upward or downward trends for any given stock. Although this was not our primary method, it proved to be a viable option if the opportunity came about.
Chapter 3
TradeStation™ Online Platform
TradeStation™ was the designated platform for the project. Each student was given a mock $400,000 account to manage a portfolio. TradeStation™ has multiple tools to help develop a trading platform. The multiple indicators, canned systems, and other tools to view trades, make it quite easy to begin making your own system. On the contrary, it is not all positives with the online platform. TradeStation™ is geared more toward automated trading, not manual. With manual trading, TradeStation™ does not automatically generate a
11
spreadsheet when you get in or out of the market. You have to track your own personal trades. Where as in automated trading, TradeStation™ keeps all trades stored in a file. For the most
part, TradeStation
™
is very helpful with learning the basics, but could greatly improve the toolsfor manual traders.
Stocks
Stocks are a type of security that signifies ownership in a corporation and represents a claim on part of the corporation's assets and earnings. Also knows as “shares” or “equity.”
There are two main types of stock: common and preferred. Common stock usually entitles the owner to vote at shareholders' meetings and to receive dividends. Preferred stock generally does not have voting rights, but has a higher claim on assets and earnings than the common shares (Stocks). For example, owners of preferred stock receive dividends before common shareholders and have priority in the event that a company goes bankrupt and is liquidated. Stocks historically outperform, over the long run, other asset classes (Stocks).
The major markets (Indexes) in the United States, just to name a few, are Dow Jones Industrial Average, S&P 500 Index, and the NASDAQ Composite Index (Radzicki).
There are multiple stock exchanges in the United States for investors to get involved with, but some are more profitable. The major Stock Exchanges in the U.S. are the New York Stock Exchange (NYSE), the NASDAQ, the American Stock Exchange (AMEX), and Over the
12
Counter Bulletin Board (Penny Stocks) (Learnstocks). During this project, stocks traded on the NYSE were predominantly used.
Bonds
A bond is a debt investment in which an investor loans money to an entity (corporate or governmental) that borrows the funds for a defined period of time at a fixed interest rate. Bonds are used by companies, municipalities, states and U.S. and foreign governments to finance a variety of projects and activities (Bonds).
Bonds are commonly referred to as fixed-income securities and are one of the three main asset classes, along with stocks and cash equivalents.
The indebted entity (issuer) issues a bond that states the interest rate (coupon) that will be paid and when the loaned funds (bond principal) are to be returned (maturity date). Interest on bonds is usually paid every six months (semi-annually). The main categories of bonds are corporate bonds, municipal bonds, and U.S. Treasury bonds, notes and bills, which are collectively referred to as simply "Treasuries" (Bonds).
Options
An option is a financial derivative that represents a contract sold by one party (option writer) to another party (option holder (Options). The contract offers the buyer the right, but not the obligation, to buy (call) or sell (put) a security or other financial asset at an agreed-upon
13
price (the strike price) during a certain period of time or on a specific date (exercise date) (Options).
Call options give the owner the option to buy at certain price, so the buyer would want the stock to go up in price (Options). Put options give the owner the option to sell at a certain price, so the buyer would want the stock to go down (Options) (unless the put is being used as a hedge).
Trading and Investment Strategies
It is argued that there are many different ways to “beat the Market.” (Eugene Fama (Nobel Prize in economics) and the other efficient market guys say you can’t beat the market) Investors and other traders have been determining many different ways to exploit the market, therefore the amount of resources available to start building a system on your own is in abundance. A few helpful strategies that have been developed and used for many years are Dow Theory and CAN SLIM.
Dow Theory is a trend following strategy. Dow Theory breaks the Market into two categories, industrial and transportation. The theory claims if one category surpasses a previous set high, then the other category is sure to follow, telling investors to buy more shares.
However, it also works in reverse as well. If one category surpasses a previous set low, then the other category is will follow suit, telling investors to sell short until the upward turn comes back (Dow Theory).
14
CAN SLIM, less of a canned system, is used to lay-out criteria to determine what stocks to use when choosing companies. CAN Slim, C-A-N-S-L-I-M, is an acronym showing steps to take while looking up investment ideas (Investopedia Again…). The CAN SLIM stock picking criteria were created by Investor's Business Daily founder William J. O'Neil. They include:
Technical Analysis
Precision Trading System (PTS)
After careful research, we decided to use Precision Trading Systems (PTS) to “beat the Market.” PTS is said to be more than a trading platform, it is a complete system used to
evaluate trades and be very precise for taking entries and exits (Training Software Setup). PTS is designed to take both long and short-term trades. This flexibility allows for quick scalps, day, long or even swing trades. Meanwhile, if the trader has a hunch to go long, Precision Trading
C - Current quarterly earnings per share have increased sharply from the same quarters' earnings reported in the prior year. (Beware of items in financial statements that can cause earnings distortions.) A - Annual earnings increase over the last five years.
N - New products, management, and other new events. In addition, the company's stock has reached new highs.
S - Small supply and large demand for a stock creates excess demand, and an environment in which stock prices can soar. Companies acquiring their own stock reduce market supply and can indicate their
expectation of future profitability. Look for low debt-equity ratios.
L - Choose leaders over laggard stocks within the same industry. Use the relative strength index as a guide.
I - Pick stocks who have institutional sponsorship by a few institutions with recent above average performance. Be cautious of stocks that are over owned by institutions.
15
System permits that tactic. Due to PTS being a linear platform, you can see ahead of time to confirm whether the current trade will be a short or long (Training Software Setup). With the regression channel, if one identifies a break out of the channel, a short position should be taken. On the other hand, if one identifies a trend developing inside the channel, then a long position should be taken.
Precision Trading System allows a trader to know how much of a profit is expected, allowing the proper risk to reward ratio. “Rather than use technical analysis, the platform is based entirely upon the real-time statistical analysis of price movement in multiple time frames, thus allowing the trader to accurately calculate the potential movement (edge) of a stock's price prior to taking the trade (Training Software Setup).
Support and Resistance Strategy
Precision Trading System was the main system used during the process, but as a group we decided to combine a few other strategies in attempt to maximize the profits, as well as, the consistency. Support and resistance are from the technical analysis side of trading.
Support and resistance can show up in various forms. One being ceilings and floors. A ceiling is a common price that a certain stock seems to get to and then take a downward turn.
16
Chart 1: Ceiling Example Chart 2: Floor Example
As you can see in chart 1, the ceiling price would be approximately $39. Whereas a floor is a common price a certain stock approaches and then takes an upward turn. As you can see in chart 2, the floor price is around $51.25. Seeing this as a trend tells a trader when and how to trade the stock and for how long (Murphy).
Another example of support and resistance are trend lines. During the project, our group used trend lines for a large part of the reasoning behind what trades we took. Trend lines are a group or series of inclining or declining peaks/troughs. If the peaks/troughs look like they are trending upward or downward, a trader will attempt to connect the peaks/troughs and determine the trend. An upward trend tells a trader to get in for a long trade. If a downward trend begins to develop, the correct call is to sell short and stay short until you see a change in the trend. Precision Trading System is based on stocks trending upward or downward. Knowing that, trend lines became very important to this project. As an example, the following chart
17
shows an upward trend, therefore the correct play would be to buy in and stay in until the trend changes.
Chart 3: Trend line Example
Moving Averages are a more technical approach to support and resistance to use in trading. As you can see from Chart 4, a moving average is a constantly changing line that flattens out past price data while also allowing the trader to identify support and resistance (Murphy). Notice how the price of the asset finds support at the moving average when the trend is up, and how it acts as resistance when the trend is down. Most traders will experiment with different time periods in their moving averages so that they
18
can find the one that works best for this specific task (Murphy). In the project, a two-line moving average is used to determine when a new trend is beginning. With a two-line moving average, when the lines cross a change in trend is beginning to happen. Just by using this indicator, a first-time trader can identify these changes and begin building a system based of support and resistance.
Market Orders
A market order is an order to buy or sell a number of shares at the best available price (U.S. Securities and Exchange Commission). Mostly, a market order gets an investor into the market immediately. However, the price at which a market order will be executed is not guaranteed. It is important for investors to remember that the last-traded price is not necessarily the price at which a market order will be executed. The quicker moving markets usually cause the last-time traded price to deviate from “real time” quotes when the market order is filled (U.S. Securities and Exchange Commission).
Limit Orders
“A limit order is an order to buy or sell a stock at a specific price or better. A buy limit order can only be executed at the limit price or lower, and a sell limit order can only be
executed at the limit price or higher. A limit order is not guaranteed to execute. A limit order can only be filled if the stock’s market price reaches the limit price. While limit orders do not guarantee execution, they help ensure that an investor does not pay more than a
pre-19
determined price for a stock” (U.S. Securities and Exchange Commission). A limit order could cause a trader to miss big jumps if the price is set to high or too low.
Stop Orders
A stop order is used to buy or sell a stock once the price reaches a specified price, the stop price, set by the investor (U.S. Securities and Exchange Commission). When the stop price is reached, a stop order becomes a market order. A buy stop order is an order to buy a market that is entered at a price above the current offering price and that is triggered when the market price touches or goes through the buy stop price. Investors generally use a buy stop order to protect a profit on a stock that they have sold short. A sell stop order is entered at a stop price below the current market price. A sell stop order is generally used to avoid a huge loss or secure the set profit margin the investor wants to achieve (U.S. Securities and Exchange Commission)
Chapter 4
Regression Channel
The main part of our group’s strategy was making use of the regression channel through TradeStation. A regression channel is made up of three parallel trend lines, with the center line using the linear least squares method to best fit to the given data points. This method
minimizes the sum of squared residuals, which is the distance between an actual value and the line of best fit, and shows how which direction the stock is trending; bullish, bearish or not at
20
all. The support and resistance lines run parallel to the center line and are 2 standard
deviations apart. For short term trading the regression channel includes 30 bars of data or 30 minutes of data. To create the channel, parallel lines are drawn two standard deviations higher and lower to the regression line (Raff). Using two standard deviations account for 95 percent of the data points within the start and end points of the regression line. This method works well on trending stocks with low to moderate volatility because it is optimal to have the data points stay within the support and resistance line and move consistently in the trending direction. If the slope of the regression channel changes then it shows that the stock is starting to trend in a different direction. Our group decided to use this strategy, because it is effective, not overly complicated, and can easily compliment other strategies. Each member of our group decided to use the regression channel in a different way; short-term trading, long-term trading, and long-
term trading with the gap strategy. Figure 4a is an example of an optimal trending stock (Raff).
Figure 4a
21
The gap strategy is another method of trading that was implemented in one part of the overall system on a 60 minute bar time frame. A gap is the difference between the price of a stock at the open of the market and the close price of the stock from the day before. If the price of the stock gaps up from the closing price of the day before, the trader can choose to go long or short on that stock. If the price of the stock is higher than the high of the previous day the trader should observe the chart on a one minute scale for at least one hour and then enter the market on a long two bars higher than yesterday’s high (Gap). Similarly, if the price of the stock opens higher than yesterday high, but does not sustain the rise on the one minute scale, the trader can choose to enter the market at a short two bars below the low of opening hour of that day. This strategy also works when the stock gaps down from the day before. If the stock opens at a price lower than the previous day’s low, then the trader should observe the chart on a one minute scale for an hour. If the price of the stock sustains the low and continues to drop, then the trader should enter the market on a short. If the price of the stock gaps down, but does not sustain the low in the first hour, then the trader can choose to enter the market on a long at two bars higher than the low of yesterday’s price (Gap).
Stocks do not always gap up higher than the previous day’s high or down lower than the previous day’s low, but there is a price difference between the open and close. This is called a partial gap, and the trader can use the same rules as the full gap strategy to enter and exit the market The difference between trading full gaps and partial gaps is potential gain and risk. Stocks that gap up higher than yesterday’s high tend to affect the market’s desire to own or sell the stock and if demand is high enough to make the floor specialist change the price of the stock to sustain all the unfulfilled orders. This applies vice versa to stocks that full gap down. If
22
the stock has a full gap then it tends to trend for a longer in a given direction than partial gaps. If there is little demand for a stock the price from close to open will only change partially to trigger buying and selling and fill on hand orders (Gap). The price of the stock will usually bounce back to its original trading price range. Trading full gaps works better on longer time frame basis, while trading partial gaps requires more attention or closer trailing stops.
Time Frames
TradeStation charts allow the user to select different time frames, or how many bars the chart displays on a daily basis. Our group made use of two different time frames; one minute bars and 60 minute bars. Since our system is a trend following system and makes use of regression channels, different time frames will show trends that occur over a longer periods of time and trends that occur over very short periods of time. Both time frames have their positive and negative aspects. Trading on longer time frame allows the trader to negate all the noise that is shown on one minute charts, and requires the user to spend more time in the market. This time frame allows the trader to catch the long term trends that may happen over days or weeks. However this means there will be less trades on a daily basis.
Using a shorter time frame, allows the user to catch the trends that happened
throughout the day. This requires the trader to pay more attention throughout the day, and to have strict enter and exit rules. Trading a shorter time frame can me more beneficial, because it allows the trader to be in the market only when the stock is trending sharply in a certain
23
frames require the trader to be in the market even if the stock is neither going up or down on the short-term.
Short-Term Trading
The first part of our strategy uses fixed fractional position sizing, and regression analysis on a one minute bar time frame. The trader selected stocks based on the results of the stock screener. The trader observes the first hour of the market after it opens. At 10:30 AM ET, regression channels are then set to cover the previous 30 bars or 30 minutes of the selected stock’s price. This allows the trader to see if the stocks are trending up or trending down and will indicate if he should go long or short into the market. If the regression channel is trending up, then the trader waits for the price to exit the regression channel either above the second standard deviation mark acting as the resistance or lower than the second standard deviation mark acting as the support. If the price exits the regression channel on the low standard deviation mark, the trader waits untilthe price drops to the same price as the start point of your regression channel. Enter the market and short at this price. If it never reaches this point it is likely the stock is still trending upward, and wait till it re-enters the regression channel where you should enter the market in a long position. If the price does drop to the price of your start point, this is indication the stock is trending in a different direction. If the stock is trending up and the price exits the high standard deviation line, wait until the price drops back into the regression channel and enter the market at a long, because this is an indication that the stock will continue to trend upward. If after 10 bars, the stock continues to rise and does not re-enter the channel the trader should enter the market on a long. Once the trader enters the market,
24
the regression channel needs to be reset. The regression channel is then set at the time the trader entered the market and 30 bars before the entry point. If the price ever drops below the regression channel wait 10 bars to account for the noise, then exit the market. If the price exits the through the higher standard deviation bar wait 15 bars, then re draw the regression
channel at the high point and 30 bars previous.
If the original regression channel is trending down, then it is likely the trader will enter the market at a short. The same enter and exit rules apply as the regression channel that trends upward, just in the opposite direction. Wait for the close of the bar to exit the regression channel, if the bar exits through the lower second standard deviation line wait for it to re-enter the channel than short the stock. If the stock price continues to drop and does not re-enter the regression channel after 10 bars the trader should enter the market. If the bars exit through the high standard deviation line wait till the price either reenters the channel and short the stock or wait for the price to reach the price from the regression channel start point to go long. After the trader enters the market, redraw the regression channel from the time of market entry to 30 bars previous.
Long-Term Trading
The other parts of our system involve using fixed fractional position sizing with
regression analysis, but on a 60 minute bar time frame or 30 minute bar time frame. One part of the long-term system also included the use of the gap strategy. The rules for our long- term strategy are similar to the rules for our short-term strategy, except for the trader who used the gap strategy to find different entry points into the market. When trading 60 minute bars, we set
25
the regression channel over 7 bars, to account for an entire trading day. When trading with 30 minute bars, we set the regression channel over 8, to also account for half a day. Trends in the market occur in every timeframe, and the trends that sustain themselves for a longer period of time net more profit per trade. The trader has to be careful not to let emotions blur the rules of the system, because with more profit comes a higher risk. However, when traded correctly, the long term aspect compliments the short term system, by catching trends that cannot be seen on a one minute bar chart.
Chapter 5:
Implementation of Strategy
This chapter consists of different examples of how we applied each strategy. The images were taken from each team member at different periods over the term. We found that these images were the best representation of how we penetrated the market.
26
(Figure 1)Figure 1 is an example of our half hour regression model. The graph is set to 1 minute bars and we were presented with a buy long situation. This is because the trend initially fell below our regression channel and was heading towards our buy indicator. We bought prematurely and had to pay for it. We bought in a few points above the indicator. Since the stock did not fully hit our sell indicator we stuck with the shares for another hour. This stock was ROSE and we lost around a dollar per share.
Full Day Regression Model
27
(Figure 2)
28 (Figure 4)
(Figure 5)
(Figure 6)
29 (Figure 8)
30
(Figure 10)Each stock is looked at over a full day period. Either by 30 minute bars with the regression length set to 13 bars, or 60 minute bars with a length of 7. Both methods measure the same amount of time; however we wanted to see if there was a difference when measuring with different graph intervals. When we looked at these models the day before trading, we created our indicators based on the location of the 2 standard deviation lines. Based on the results from yesterday’s market, we would use the upper regression line as a short indicator, while using the bottom line as a long indicator. The middle regression line is our indicator to buy back in or sell the stock.
31
(Figure 11)This is an example of when we would sell short. The stock is CMA and once the price hit the upper interval we decided to sell short. CMA falls into our screener and the stock is held until the price falls back onto the white regression line. Unless the price reaches our ceiling, it is monitored until it falls back down.
32
The stock above is IPGP. This is an example of when we decide to buy long. Based on yesterday’s performance, we find our buying mark and when to sell. We bought in at 65.44 and had not decided to sell yet due to it not reaching our floor, nor reaching our selling indicator.
Gap Up
(Figure 13)This shot is from a chart representing CNX. CNX is one of our stocks and we applied our gap up strategy in this scenario. When the price opened up that much higher from the day before, we decided to sell short. We sold short at 44.17 and then bought back at 43.60.
33
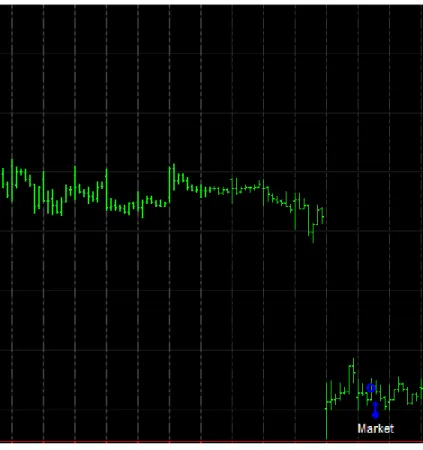
Gap Down
(Figure 14)This is a prime example of where we applied the gap down strategy. Since there is a dramatic drop from one day’s closing price, to the next day’s opening price, we can interpret this as a sign that the stock is going to jump back up. Our interpretation was correct. This chart represents CIT, and we bought in at 43.35 and sold at 45.74.
Figures:
Figure 1 – ROSE Chart (Trade Station)
Figure 2 – CNX Chart (Trade Station)
34 Figure 4 – GEOS Chart (Trade Station)
Figure 5 – HOS Chart (Trade Station)
Figure 6 – IPGP Chart (Trade Station)
Figure 7 – OAS Chart (Trade Station)
Figure 8 – ROSE Chart (Trade Station)
Figure 9 – TAL Chart (Trade Station)
Figure 10 – UBNT Chart (Trade Station)
Figure 11 – CMA Chart (Trade Station)
Figure 12 – IPGP Chart (Trade Station)
Figure 13 – CNX Chart (Trade Station)
35
Chapter 6
Conclusion
36
Downey’s Trades (Long Term):
37
Yandian’s Trades (Short Term):
38
The images above are the results from our team’s trading versus the index from the S&P 500. The S&P 500’s year-to-date return was 2.61%. This is a good standard to go by because it represents the top traded companies in the market. The S&P 500’s 1-year return is larger than all 3 of ours; however the spreadsheet has only been recorded since the beginning of C-term.
Analysis
Compared to the S&P 500, it seems that our strategy is ultimately ineffective. Although two of the traders we able to generate a small profit, it was not very significant and none of the members were able to generate enough profit to beat the S&P 500. Along with this, one of the member’s return ended-up being a negative difference. This is a signal that something is wrong with our system, whether it is the position sizing, screener, or actual strategy. The most difficult part is determining which section needs the improvement. We believe that our biggest flaw in the system was using the regression channel to manually trade versus automated trading. There were instances when errors would occur in readjusting our indicators from the regression channel due to us misjudging trends that could have been solved from automatic trading. The stock screener still seems efficient due to the volatility we observed from each stock. Volatility works both ways; a trader can use it for their advantage to come across a quick sizable return,
39
but also if the trader’s attention is not appropriately applied than the investment can go south quicker than a non-volatile stock would.
Overall, we would not decide to implement this system again. Although one of the members had a solid return, the other two did not. One objective we were not able to accomplish was the ability to implement our system completely into EasyLanguage. This program through TradeStation could have proven to be more effective than us simply manual trading. This experience of building and implementing a system has shown our team how difficult it is to actually beat the market. We have learned that adjustments need to be made from time to time to maintain the quality of a system. The knowledge we have gained from this project should be very useful when we are creating our own personal portfolios later on in life.
40
References
Bryant, Michael. “Position Sizing Methods and their Role in Systematic Trading.” 2011. Adaptrade Software. 24 April 2014
CNNMoney. “NYSE Composite Index.” Cable News Network. 1 April 2014
Economides, Nicholas. "The impact of the Internet on Financial Markets." Journal of Financial Transformation (2001): 8-13. Article.
Gap Trading Strategies - ChartSchool - StockCharts.com. "Gap Trading Strategies."Gap Trading Strategies - ChartSchool - StockCharts.com. 23 April 2014
Investopedia. "Regression Analysis - CFA Level 1 |." Investopedia US. 21 April 2014 Investopedia. "What is a Bond." Investopedia US. 12 January 2014
Investopedia. "What is an Option." Investopedia US. 22 October 2013 Investopedia. "What is a Stock." Investopedia US. 6 November 2013 Investopedia. "Dow Theory" Investopedia US. 25 January 2014
Learnstocks. "Major U.S. Stock Exchanges." 26 February 2013. Hot Penny Stocks Finders. Web. 20 April 2014.
Murphy, Casey. "Support and Resistance Basics." 10 March 2013. Investopedia. Web. 25 April 2014.
Radzicki, Michael J. The Breadth of the Market. 2012. PowerPoint. 27 April 2014.
Raff Regression Channel - ChartSchool - StockCharts.com. "Raff Regression Channel." Raff Regression Channel - ChartSchool - StockCharts.com. 21 April 2014
Stock Screener - Yahoo! Finance. "Stock Screener - Yahoo! Finance." Yahoo! 2 May 2014. Training Software Setup. Precision Trading System. 15 January 2010. Web. 19 April 2014. U.S. Securities and Exchange Commission. U.S. Securties and Exchange Commission. 30 April
41