REVIEW OF PHOSPHORUS REMOVAL AT MUNICIPAL
SEWAGE TREATMENT PLANTS DISCHARGING TO THE
LAKE SIMCOE WATERSHED
REVIEW OF PHOSPHORUS REMOVAL AT
MUNICIPAL SEWAGE TREATMENT PLANTS
DISCHARGING TO THE LAKE SIMCOE WATERSHED
Prepared for:
WATER ENVIRONMENT ASSOCIATION OF ONTARIO P.O. Box 176 Milton, Ontario L9T 4N9 Prepared by: XCGCONSULTANTS LTD. 2620 Bristol Circle Suite 300 Oakville, Ontario L6H 6Z7 Lake Simcoe Clean-Up Fund
(Environment Canada) Ministry of the Environment
ACKNOWLEDGEMENTS
The “Review of Phosphorus Removal at Municipal Sewage Treatment Plants Discharging to the Lake Simcoe Watershed” was prepared by XCG Consultants Ltd. Under the guidance of a Technical Steering Committee identified below. This document underwent review by the various stakeholders, including the STP Managers and staff from the facilities included, and others as listed below.
Technical Steering Committee
Catherine Jefferson, MSc, Water Environment Association of Ontario (WEAO) Sandra Kok, P. Eng., Environment Canada
George Lai, M. Eng., P. Eng., WEAO
Mano Manoharan, Ph. D., P. Eng., Standards Development Branch, Ministry of the Environment (MOE)
Sumithra Naguleswaran, P. Eng., Standards Development Branch, MOE Andre Schnell, M. Eng., P. Eng., Standards Development Branch, MOE Peter Seto, Ph. D., P. Eng., Environment Canada
Daisy Yixun Shen, Standards Development Branch, MOE
Thom Sloley, P. Eng., WEAO and Regional Municipality of Durham
Other
Table of Contents 1. INTRODUCTION ... 1-1 1.1 Background ... 1-1 1.2 Objectives ... 1-2 1.3 Scope of Investigation ... 1-2 2. METHODOLOGY... 2-1
2.1 Upgrades to Achieve 0.10 mg/L Total Phosphorus ... 2-2 2.2 Upgrades to Achieve 0.05 mg/L Total Phosphorus ... 2-2 2.3 Upgrades to Lagoon Based Systems ... 2-4
3. REVIEW OF STPPERFORMANCE AND UPGRADES ... 3-1
3.1 Uxbridge Brook WPCP ... 3-1
3.1.1 Performance Requirements ... 3-2
3.1.2 Historical Performance ... 3-2
3.1.3 Upgrades to the Existing Facility to Achieve Effluent TP Objective
Concentrations of 0.10 mg/L ... 3-3
3.1.4 Upgrades to the Existing Facility to Achieve Effluent TP Objective
Concentrations of 0.05 mg/L ... 3-3
3.1.5 Summary of Conceptual Level Upgrade Costs ... 3-4
3.2 Beaver River #1 (Sunderland) WPCP ... 3-5
3.2.1 Performance Requirements ... 3-6
3.2.2 Historical Performance ... 3-6
3.2.3 Upgrades to the Existing Facility to Achieve Effluent TP Objective
Concentrations of 0.10 mg/L ... 3-7
3.2.4 Upgrades to the Existing Facility to Achieve Effluent TP Objective
Concentrations of 0.05 mg/L ... 3-8
3.2.5 Incremental Costs to Upgrade to Membrane Ultrafiltration ... 3-9
3.2.6 Summary of Conceptual Level Upgrade Costs ... 3-10
3.3 Lake Simcoe (Beaverton) WPCP ... 3-11
3.3.1 Performance Requirements ... 3-12
3.3.2 Historical Performance ... 3-13
3.3.3 Upgrades to the Existing Facility to Achieve Effluent TP Objective
Concentrations of 0.10 mg/L ... 3-14
3.3.4 Upgrades to the Existing Facility to Achieve Effluent TP Objective
Concentrations of 0.05 mg/L ... 3-15
3.3.5 Summary of Conceptual Level Upgrade Costs ... 3-16
3.4 Beaver River #2 (Cannington) WPCP ... 3-16
3.4.1 Performance Requirements ... 3-17
3.4.2 Historical Performance ... 3-17
3.4.3 Upgrades to the Existing Facility to Achieve Effluent TP Objective
Concentrations of 0.10 mg/L ... 3-19
3.4.4 Upgrades to the Existing Facility to Achieve Effluent TP Objective
Concentrations of 0.05 mg/L ... 3-20
3.4.5 Incremental Costs to Upgrade to Membrane Ultrafiltration ... 3-21
3.4.6 Summary of Conceptual Level Upgrade Costs ... 3-22
3.5 Schomberg WPCP ... 3-22
3.5.2 Historical Performance ... 3-24
3.5.3 Upgrades to the Existing Facility to Achieve Effluent TP Objective
Concentrations of 0.10 mg/L ... 3-25
3.5.4 Upgrades to the Existing Facility to Achieve Effluent TP Objective
Concentrations of 0.05 mg/L ... 3-26
3.5.5 Summary of Conceptual Level Upgrade Costs ... 3-27
3.6 Sutton WPCP ... 3-27
3.6.1 Performance Requirements ... 3-28
3.6.2 Historical Performance ... 3-29
3.6.3 Upgrades to the Existing Facility to Achieve Effluent TP Objective
Concentrations of 0.10 mg/L ... 3-30
3.6.4 Upgrades to the Existing Facility to Achieve Effluent TP Objective
Concentrations of 0.05 mg/L ... 3-30
3.6.5 Summary of Conceptual Level Upgrade Costs ... 3-31
3.7 Holland Landing WPCP ... 3-32
3.7.1 Performance Requirements ... 3-33
3.7.2 Historical Performance ... 3-33
3.7.3 Upgrades to the Existing Facility to Achieve Effluent TP Objective
Concentrations of 0.10 mg/L ... 3-34
3.7.4 Upgrades to the Existing Facility to Achieve Effluent TP Objective
Concentrations of 0.05 mg/L ... 3-35
3.7.5 Incremental Costs to Upgrade to Membrane Ultrafiltration ... 3-36
3.7.6 Summary of Conceptual Level Upgrade Costs ... 3-37
3.8 Keswick WPCP ... 3-38
3.8.1 Performance Requirements ... 3-39
3.8.2 Historical Performance ... 3-40
3.8.3 Upgrades to the Existing Facility to Achieve Effluent TP Objective
Concentrations of 0.10 mg/L ... 3-40
3.8.4 Upgrades to the Existing Facility to Achieve Effluent TP Objective
Concentrations of 0.05 mg/L ... 3-41
3.8.5 Summary of Conceptual Level Upgrade Costs ... 3-41
3.9 Mount Albert WPCP ... 3-42
3.9.1 Performance Requirements ... 3-43
3.9.2 Historical Performance ... 3-44
3.9.3 Upgrades to the Existing Facility to Achieve Effluent TP Objective
Concentrations of 0.10 mg/L ... 3-45
3.9.4 Upgrades to the Existing Facility to Achieve Effluent TP Objective
Concentrations of 0.05 mg/L ... 3-45
3.9.5 Summary of Conceptual Level Upgrade Costs ... 3-46
3.10 Barrie WPCC ... 3-46
3.10.1 Performance Requirements ... 3-48
3.10.2 Historical Performance ... 3-49
3.10.3 Upgrades to the Existing Facility to Achieve Effluent TP Objective
Concentrations of 0.10 mg/L ... 3-50
3.10.4 Upgrades to the Existing Facility to Achieve Effluent TP Objective
Concentrations of 0.05 mg/L ... 3-50
3.10.5 Summary of Conceptual Level Upgrade Costs ... 3-51
3.11 Bradford WPCP ... 3-51
3.11.2 Historical Performance ... 3-54
3.11.3 Upgrades to the Existing Facility to Achieve Effluent TP Objective
Concentrations of 0.10 mg/L ... 3-54
3.11.4 Upgrades to the Existing Facility to Achieve Effluent TP Objective
Concentrations of 0.05 mg/L ... 3-55
3.11.5 Summary of Conceptual Level Upgrade Costs ... 3-55
3.12 Innisfil WPCP ... 3-56
3.12.1 Performance Requirements ... 3-57
3.12.2 Historical Performance ... 3-58
3.12.3 Upgrades to the Existing Facility to Achieve Effluent TP Objective
Concentrations of 0.10 mg/L ... 3-58
3.12.4 Upgrades to the Existing Facility to Achieve Effluent TP Objective
Concentrations of 0.05 mg/L ... 3-59
3.12.5 Summary of Conceptual Level Upgrade Costs ... 3-59
3.13 Orillia WWTC ... 3-60
3.13.1 Performance Requirements ... 3-61
3.13.2 Historical Performance ... 3-62
3.13.3 Upgrades to the Existing Facility to Achieve Effluent TP Objective
Concentrations of 0.10 mg/L ... 3-63
3.13.4 Upgrades to the Existing Facility to Achieve Effluent TP Objective
Concentrations of 0.05 mg/L ... 3-64
3.13.5 Incremental Costs to Upgrade to Membrane Ultrafiltration ... 3-64
3.13.6 Summary of Conceptual Level Upgrade Costs ... 3-65
3.14 Lagoon City STP ... 3-66
3.14.1 Performance Requirements ... 3-67
3.14.2 Historical Performance ... 3-67
3.14.3 Upgrades to the Existing Facility to Achieve Effluent TP Objective
Concentrations of 0.10 mg/L ... 3-68
3.14.4 Upgrades to the Existing Facility to Achieve Effluent TP Objective
Concentrations of 0.05 mg/L ... 3-69
3.14.5 Incremental Costs to Upgrade to Membrane Ultrafiltration ... 3-70
3.14.6 Summary of Conceptual Level Upgrade Costs ... 3-71
3.15 Summary of Historical Phosphorus Removal Performance and Upgrades .. 3-72
3.15.1 Historical Performance ... 3-72
3.15.2 Upgrades to Achieve Effluent TP Objective Concentrations of 0.10 mg/L 3-75
3.15.3 Upgrades to Achieve Effluent TP Objective Concentrations of 0.05 mg/L 3-78
3.15.4 Incremental Costs to Upgrade to Membrane Ultrafiltration Instead of
Tertiary Filtration ... 3-2
4. NON POINT-SOURCE PHOSPHORUS REDUCTION ... 4-1
4.1 Background ... 4-1 4.2 Costing Methodology ... 4-2 4.3 Agriculture ... 4-2
4.3.1 Opportunities for Phosphorus Reduction ... 4-4
4.3.1.1 Agricultural BMP’s ... 4-4 4.3.1.2 Holland Marsh Polder Water Treatment ... 4-5 4.4 Urban Stormwater ... 4-6
4.4.1 New Urban Developments ... 4-7
4.4.3 Opportunities for Phosphorus Reduction ... 4-8
5. SUMMARY ... 5-1
6. REFERENCES ... 6-1
T
ABLETable 1.1 STP’s Discharging to the Lake Simcoe Watershed ... 1-3 Table 3.1 Certificate of Approval and Interim Effluent Phosphorus Objectives and
Limits for the Uxbridge Brook WPCP ... 3-2 Table 3.2 Historic Phosphorus Removal at the Uxbridge Brook WPCP ... 3-2 Table 3.3 Incremental Costs to Upgrade to Membrane Ultrafiltration for the Uxbridge
Brook WPCP ... 3-4 Table 3.4 Certificate of Approval and Interim Effluent Phosphorus Objectives and
Limits for the Beaver River #1 WPCP ... 3-6 Table 3.5 Historic Phosphorus Removal at the Beaver River #1 WPCP ... 3-7 Table 3.6 Incremental Costs to Upgrade to Secondary Treatment with Tertiary
Filtration for the Beaver River #1 WPCP ... 3-8 Table 3.7 Incremental Costs to Upgrade to Secondary Treatment with Membrane
Ultrafiltration for the Beaver River #1 WPCP ... 3-9 Table 3.8 Incremental Costs to Upgrade to Membrane Ultrafiltration Instead of
Tertiary Filtration for the Beaver River #1 WPCP ... 3-10 Table 3.9 Certificate of Approval and Interim Effluent Phosphorus Objectives and
Limits for the Lake Simcoe WPCP ... 3-13 Table 3.10 Historic Phosphorus Removal at the Lake Simcoe WPCP ... 3-13 Table 3.11 Incremental Costs to Expand the Existing Tertiary Treatment for the Lake
Simcoe WPCP ... 3-14 Table 3.12 Incremental Costs to Upgrade to Membrane Ultrafiltration for the Lake
Simcoe WPCP ... 3-15 Table 3.13 Certificate of Approval and Interim Effluent Phosphorus Objectives and
Limits for the Beaver River #2 WPCP ... 3-17 Table 3.14 Historic Phosphorus Removal at the Beaver River #2 WPCP ... 3-18 Table 3.15 Incremental Costs to Upgrade to Secondary Treatment with Tertiary
Filtration for the Beaver River #2 WPCP ... 3-19 Table 3.16 Incremental Costs to Upgrade to Secondary Treatment with Membrane
Ultrafiltration for the Beaver River #2 WPCP ... 3-20 Table 3.17 Incremental Costs to Upgrade to Membrane Ultrafiltration Instead of
Tertiary Filtration for the Beaver River #2 WPCP ... 3-21 Table 3.18 Certificate of Approval and Interim Effluent Phosphorus Objectives and
Limits for the Schomberg WPCP ... 3-24 Table 3.19 Historic Phosphorus Removal at the Schomberg WPCP ... 3-24 Table 3.20 Incremental Costs to Upgrade to Secondary Treatment with Tertiary
Filtration for the Schomberg WPCP ... 3-25 Table 3.21 Incremental Costs to Upgrade to Membrane Ultrafiltration for the
Table 3.22 Certificate of Approval and Interim Effluent Phosphorus Objectives and Limits for the Sutton WPCP ... 3-29 Table 3.23 Historic Phosphorus Removal at the Sutton WPCP ... 3-29 Table 3.24 Incremental Costs to Upgrade to Membrane Ultrafiltration for the Sutton
WPCP ... 3-31 Table 3.25 Certificate of Approval and Interim Effluent Phosphorus Objectives and
Limits for the Holland Landing WPCP ... 3-33 Table 3.26 Historic Phosphorus Removal at the Holland Landing WPCP ... 3-34 Table 3.27 Incremental Costs to Upgrade to Secondary Treatment with Tertiary
Filtration for the Holland Landing WPCP ... 3-35 Table 3.28 Incremental Costs to Upgrade to Secondary Treatment with Membrane
Ultrafiltration for the Holland Landing WPCP ... 3-36 Table 3.29 Incremental Costs to Upgrade to Membrane Ultrafiltration Instead of
Tertiary Filtration for the Holland Landing WPCP ... 3-37 Table 3.30 Certificate of Approval and Interim Effluent Phosphorus Objectives and
Limits for the Keswick WPCP ... 3-39 Table 3.31 Historic Phosphorus Removal at the Keswick WPCP ... 3-40 Table 3.32 Incremental Costs to Upgrade to Membrane Ultrafiltration for the Keswick
WPCP ... 3-41 Table 3.33 Certificate of Approval and Interim Effluent Phosphorus Objectives and
Limits for the Mount Albert WPCP ... 3-44 Table 3.34 Historic Phosphorus Removal at the Mount Albert WPCP ... 3-44 Table 3.35 Incremental Costs to Upgrade to Membrane Ultrafiltration for the Mount
Albert WPCP ... 3-45 Table 3.36 Certificate of Approval and Interim Effluent Phosphorus Objectives and
Limits for the Barrie WPCC ... 3-48 Table 3.37 Historic Phosphorus Removal at the Barrie WPCC ... 3-49 Table 3.38 Incremental Costs to Upgrade to Membrane Ultrafiltration for the Barrie
WPCC ... 3-50 Table 3.39 Certificate of Approval and Interim Effluent Phosphorus Objectives and
Limits for the Bradford WPCP ... 3-53 Table 3.40 Historic Phosphorus Removal at the Bradford WPCP ... 3-54 Table 3.41 Incremental Costs to Upgrade to Membrane Ultrafiltration for the Bradford
WPCP ... 3-55 Table 3.42 Certificate of Approval and Interim Effluent Phosphorus Objectives and
Limits for the Innisfil WPCP ... 3-57 Table 3.43 Historic Phosphorus Removal at the Innisfil WPCP ... 3-58 Table 3.44 Incremental Costs to Upgrade to Membrane Ultrafiltration for the Innisfil
WPCP ... 3-59 Table 3.45 Certificate of Approval and Interim Effluent Phosphorus Objectives and
Limits for the Orillia WWTC ... 3-62 Table 3.46 Historic Phosphorus Removal at the Orillia WWTC ... 3-62 Table 3.47 Incremental Costs to Upgrade to Tertiary Filtration for the Orillia WWTC 3-63 Table 3.48 Incremental Costs to Upgrade to Membrane Ultrafiltration for the Orillia
Table 3.49 Incremental Costs to Upgrade to Membrane Ultrafiltration Instead of Tertiary Filtration for the Orillia WWTC ... 3-65 Table 3.50 Certificate of Approval and Interim Effluent Phosphorus Objectives and
Limits for the Lagoon City STP ... 3-67 Table 3.51 Historic Phosphorus Removal at the Lagoon City STP ... 3-68 Table 3.52 Incremental Costs to Upgrade to Tertiary Filtration for the Lagoon City
STP ... 3-69 Table 3.53 Incremental Costs to Upgrade to Membrane Ultrafiltration for the Lagoon
City STP ... 3-70 Table 3.54 Incremental Costs to Upgrade to Membrane Ultrafiltration Instead of
Tertiary Filtration for the Lagoon City STP ... 3-71 Table 3.55 Estimated Annual Phosphorus Loadings by STP ... 3-73 Table 3.56 Summary of Upgrades to Achieve Effluent TP Objective Concentrations of
0.10 mg/L ... 3-76 Table 3.57 Summary of Upgrades to Achieve Effluent TP Objective Concentrations of
0.05 mg/L ... 3-79 Table 3.58 Summary of Incremental Costs to Upgrade to Membrane Ultrafiltration iary
Filtration ... 3-3 Table 4.1 Incremental Costs for Best Management Practices in the Lake Simcoe
Watershed ... 4-5 Table 4.2 Incremental Costs for Physical/Chemical Treatment of the Holland Marsh
Polder Water ... 4-6 Table 4.3 Retrofit Costs to Provide Level 1 Stormwater Treatment to Existing Urban
Areas in the Lake Simcoe Watershed ... 4-9
F
IGUREFigure 1.1 Lake Simcoe Watershed (Courtesy of MOE) ... 1-4 Figure 3.1 Uxbridge Brook WPCP Process Flow Diagram ... 3-1 Figure 3.2 Unit Removal Costs for the Uxbridge Brook WPCP ... 3-5 Figure 3.3 Beaver River #1 WPCP Process Flow Diagram ... 3-6 Figure 3.4 Unit Removal Costs for the Beaver River #1 WPCP ... 3-11 Figure 3.5 Lake Simcoe WPCP Process Flow Diagram ... 3-12 Figure 3.6 Unit Removal Costs for Lake Simcoe WPCP ... 3-16 Figure 3.7 Beaver River #2 WPCP Process Flow Diagram ... 3-17 Figure 3.8 Unit Removal Costs for the Beaver River #2 WPCP ... 3-22 Figure 3.9 Schomberg WPCP Process Flow Diagram ... 3-23 Figure 3.10 Unit Removal Costs for the Schomberg WPCP ... 3-27 Figure 3.11 Sutton WPCP Process Flow Diagram ... 3-28 Figure 3.12 Unit Removal Costs for the Sutton WPCP ... 3-32 Figure 3.13 Holland Landing WPCP Process Flow Diagram ... 3-33 Figure 3.15 Unit Removal Costs for the Holland Landing WPCP ... 3-38 Figure 3.15 Keswick WPCP Process Flow Diagram ... 3-39 Figure 3.16 Unit Removal Costs for the Keswick WPCP ... 3-42 Figure 3.17 Mount Albert WPCP Process Flow Diagram ... 3-43 Figure 3.18 Unit Removal Costs for the Mount Albert WPCP ... 3-46
Figure 3.19 Barrie WPCC Process Flow Diagram ... 3-48 Figure 3.20 Unit Removal Costs for the Barrie WPCC ... 3-51 Figure 3.21 Bradford WPCP Process Flow Diagram ... 3-53 Figure 3.22 Unit Removal Costs for the Bradford WPCP ... 3-56 Figure 3.23 Innisfil WPCP Process Flow Diagram ... 3-57 Figure 3.24 Unit Removal Costs for the Innisfil WPCP ... 3-60 Figure 3.25 Orillia WWTC Process Flow Diagram ... 3-61 Figure 3.26 Unit Removal Costs for Orillia WWTC ... 3-66 Figure 3.27 Lagoon City STP Process Flow Diagram ... 3-67 Figure 3.28 Unit Removal Costs for Lagoon City STP ... 3-72 Figure 3.29 Average Annual Effluent TP Loading to Lake Simcoe by Treatment Plant 3-74 Figure 3.30 Average Annual Effluent TP Loading to Lake Simcoe by Treatment Plant
Upon Completion of Current Upgrades ... 3-75 Figure 3.31 Average Annual Effluent TP Loading to Lake Simcoe by Treatment Plant
After Upgrades to Tertiary Filtration ... 3-78 Figure 3.32 Average Annual Effluent TP Loading to Lake Simcoe by Treatment Plant
After Upgrades to Membrane Ultrafiltration ... 3-2 Figure 3.33 Summary of Historic and Upgraded Unit Phosphorus Removal Costs ... 3-5 Figure 4.1 Sources of Phosphorus Loading to Lake Simcoe (Adapted from LSRCA and
MOE data sets on phosphorus loading from 2002 to 2007) ... 4-2 Figure 5.1 Annual Phosphorus Loading Reductions ... 5-1 Figure 5.2 25-Year Life Cycle Cost for Phosphorus Removal Alternatives ... 5-2 Figure 5.3 Overall Unit Removal Costs for Phosphorus Removal Alternatives ... 5-3 Figure 5.4 Sources of Phosphorus Loading to Lake Simcoe ... 5-4
A
PPENDIX1.
I
NTRODUCTION1.1 Background
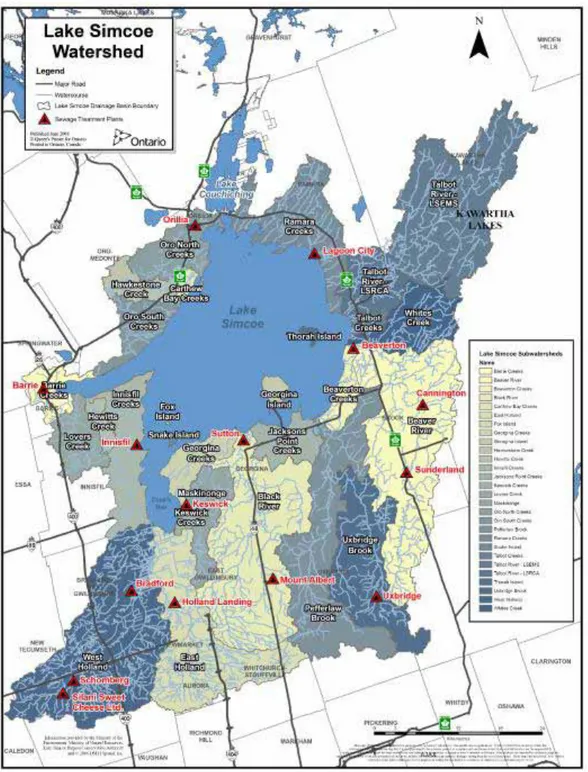
The Lake Simcoe Watershed spans 722 km2 and provides drinking water and a source of livelihood and recreation for more than 400,000 permanent and transient residents around the Lake (LSRCA, 2007). Four decades of scientific review and research has identified phosphorus as a key contaminant resulting in significant stress on the Lake Simcoe basin, necessitating a phosphorus reduction strategy to better control and limit the impact of phosphorus loading to the Lake and its ecosystem.
In March 2008, the Ontario Water Resources Act for the Protection of Lake Simcoe (Ontario Regulation 60/08) came into effect imposing interim annual phosphorus loading limits on sewage treatment plants discharging to the Lake Simcoe Watershed for the period from April 1, 2008 to March 31, 2009. This was later amended to extend to March 31, 2010 in Ontario Regulation 130/09. In June 2009, the Lake Simcoe Protection Plan was released, with the aim of reducing overall phosphorus loading from all sources to the Lake Simcoe Watershed. Under the Lake Simcoe Protection Plan, long-term phosphorus loading limits will be proposed within one year of the Plan coming into effect.
Through consultations among various Ontario government ministries, First Nations and Métis communities, the Lake Simcoe Region Conservation Authority, municipalities, and watershed residents and other stakeholders, the Ontario government has developed a draft Phosphorus Reduction Strategy (PRS) for the Lake Simcoe Watershed. The strategy lays out a phased, coordinated, and adaptive management approach for reducing phosphorus loadings to Lake Simcoe. The draft PRS was posted on Ontario’s Environmental Registry for public consultation (http://www.ebr.gov.on.ca) on February 17, 2010.
Total annual phosphorus loading to Lake Simcoe from 2004 to 2007 ranged from 71.5 to 77.3 tonnes (LSRCA, 2007). Over that period, annual phosphorus loading from Sewage Treatment Plants (STP’s) discharging to the watershed ranged from 5.3 to 6.8 tonnes (LSRCA, 2007), which was equivalent to approximately 7.5 percent to 9.2 percent of the total phosphorus loading to Lake Simcoe. The interim limit for the total annual phosphorus load from municipal STP’s to Lake Simcoe is 7.3 tonnes (Ontario Regulation 60/08). Although the phosphorus loading from the STP’s is currently within the limits set forth in the interim regulations, new urban development as a result of the Province’s “Places to Grow” initiative will result in increased wastewater flows and phosphorus loading unless improvements in treatment are provided.
Currently, 14 municipal sewage treatment plants, including secondary treatment plants, tertiary treatment plants and lagoon-based systems, discharge treated effluent to the Lake Simcoe Watershed. This study was undertaken to review phosphorus removal strategies and technologies at these 14 STP’s.
1.2 Objectives
XCG Consultants Ltd. (XCG) was retained to conduct a study on the 14 STP’s discharging to the Lake Simcoe Watershed. The purpose of the study was threefold: 1. To review the current design, performance and associated costs of phosphorus
removal at each of the 14 STP’s discharging to the Lake Simcoe Watershed; 2. To develop conceptual level designs and order of magnitude costs to achieve
enhanced levels of phosphorus removal at these plants; and
3. To compare the order of magnitude costs to achieve enhanced levels of phosphorus removal at the 14 STP’s in the Lake Simcoe Watershed with the conceptual level costs to achieve reduced phosphorus loadings from rural and urban non-point sources.
1.3 Scope of Investigation
Table 1.1 identifies the 14 municipal STP’s that were included in this review.
The list of STP’s discharging to Lake Simcoe presented in Table 1.1 includes eleven mechanical plants and three lagoon based systems. Of the eleven mechanical plants, nine facilities utilize or are in the process of constructing tertiary treatment for phosphorus removal.
The review of phosphorus removal at each STP consisted of the following steps. 1. Site visits were conducted with plant operations staff in order to review plant
operations and to discuss plant performance with respect to phosphorus removal. 2. Process design information, performance and operating data and costs for 2006 –
2008 were collected and analyzed to assess the current performance of each STP with respect to phosphorus removal. No independent sampling or monitoring of STP performance was undertaken as part of this evaluation.
3. Opportunities to improve the performance of each STP with respect to phosphorus removal involving little to no capital cost via optimization were identified where applicable.
4. Where performance is limited by the capabilities of the existing facilities, upgrades to consistently achieve an objective concentration of 0.10 mg/L effluent total phosphorus (TP) were identified. Conceptual level costs were developed for the upgrades.
5. Conceptual level designs for upgrades to achieve effluent TP objective concentrations in line with the Limit of Technology (LoT) were considered for each plant. For the purposes of this review, the achievable effluent TP concentration, based on implementing the LoT, was assumed to be 0.05 mg/L.
Table 1.1 STP’s Discharging to the Lake Simcoe Watershed
Plant Ownership Treatment Process
Uxbridge Brook WPCP
The Regional
Municipality of Durham
extended aeration
automatic backwash filters Beaver River # 1 WPCP
(Sunderland)
seasonal wastewater stabilization lagoon system
Lake Simcoe (Beaverton) WPCP
extended aeration
tertiary solids contact clarifier
automatic backwash filters Beaver River # 2 WPCP
(Cannington)
facultative seasonal discharge lagoons
Schomberg WPCP
The Regional Municipality of York
extended aeration
continuous backwash sand filters
Sutton WPCP sequencing batch reactor
continuous backwash sand filters
Holland Landing WPCP facultative seasonal discharge lagoons
Keswick WPCP extended aeration
tertiary membrane ultrafiltration (1) (being installed)
Mount Albert WPCP extended aeration
continuous backwash sand filters Barrie WPCC
The Corporation of the City of Barrie
high purity oxygen (UNOX) secondary treatment
tertiary nitrifying rotating biological contactors (RBC’s)
automatic backwash filters Bradford WPCP The Corporation of the
Town of Bradford West Gwillimbury
parallel extended aeration and SBR secondary treatment processes
continuous backwash sand filters Innisfil WPCP
The Corporation of the Town of Innisfil
extended aeration
automatic backwash sand filters
continuous backwash sand filters Orillia WWTC The Corporation of the
City of Orillia
conventional activated sludge
Lagoon City STP The Corporation of the Township of Ramara
extended aeration
Notes:
1. Currently, the Keswick WPCP is equipped with dual media, automatic backwash filters for tertiary treatment.
Figure 1.1 shows the location of the 14 municipal STP’s in the Lake Simcoe Watershed
2.
M
ETHODOLOGYHistorical costs for phosphorus removal were estimated based on the actual costs incurred for chemical precipitants used for phosphorus removal and for sludge disposal. For the purposes of this analysis, it was assumed that approximately 25 percent of the actual sludge disposal cost was the result of phosphorus removal due to chemical precipitation. Historic costs do not include labour, energy or maintenance costs for the existing infrastructure.
Capital and life cycle costs were developed for the conceptual level STP upgrades. All costs presented are strictly the incremental costs associated with STP upgrades for phosphorus removal. No capital costs were included for the upgrade or expansion of any other treatment process at the STP to handle flows beyond the current rated capacity of the works. Costs did not consider site specific factors such as the need to acquire additional land or site conditions that can affect capital costs. Site specific constraints such as land availability or assimilative capacity of the receiving stream were considered in the development of the conceptual level upgrades.
The following notes apply to the cost estimates.
All costs are presented in 2009 Canadian dollars (CAD).
Peak flows used for sizing tertiary filters and membrane systems were estimated by developing an assumed service population at the Certificate of Approval (CofA) rated average day flow (ADF) capacity, based on a per capita flow of 455 L/cap/d including an allowance for I/I. This population was then used to calculate a Harmon peaking factor which was applied to the CofA rated ADF capacity, to estimate the peak flow.
Operating and maintenance costs were estimated and included periodic equipment replacement where appropriate.
25-year life cycle costs were calculated assuming a 5% discount rate.
All costs are conceptual level opinions of probable costs only, and are considered to be accurate to within –25% to +40 %.
The unit removal costs for phosphorus are calculated by dividing the 25-year life cycle cost by the cumulative phosphorus removed over a 25-year period. Unit removal costs are presented in CAD/kg TP removed.
Capital and operations and maintenance (O&M) costs were developed for the following upgrades, as described in the subsequent sub-sections:
Addition/expansion of granular media filters to achieve 0.10 mg/L TP;
Addition of membrane filtration systems to achieve 0.05 mg/L TP; and,
2.1 Upgrades to Achieve 0.10 mg/L Total Phosphorus
In order to consistently achieve effluent at an objective TP concentration as low as 0.10 mg/L, conceptual level upgrades for STP’s not currently equipped with tertiary treatment were developed. Based on the findings in Ross et al. (1994), effluent TP concentrations of less than 0.10 mg/L are achievable on a continuous basis using tertiary filtration. For the purposes of this study, conceptual level upgrades to tertiary granular media filtration with chemical addition for enhanced phosphorus removal were developed for STP’s not currently equipped with tertiary filtration. Phosphorus removal and chemical dosages can be optimized via the implementation of multi-point chemical addition, which may also reduce chemical sludge production rates.
The capital costs to upgrade the secondary STP’s to tertiary facilities were estimated based on the addition/expansion of granular media filters at the CofA rated ADF capacity of each plant.
When developing capital cost estimates associated with the addition/expansion of granular media filters, allowances were included for the following:
Filter mechanism and media;
Filter building construction/expansion;
Process piping modifications;
Yard piping; and
Electrical / SCADA modifications and upgrades.
An allowance of 40 percent was included to cover costs associated with engineering, mobilization, demobilization, contractor overhead, and other miscellaneous construction costs.
O&M costs associated with the addition/expansion of granular media filters were developed based on the following allowances:
Additional power consumption as a result of backwash pump operation; and
Media replacement every 20 years.
The unit removal costs for phosphorus were calculated by dividing the 25-year life cycle cost by the cumulative phosphorus removed over a 25-year period. Unit removal costs are presented in CAD/kg TP removed.
2.2 Upgrades to Achieve 0.05 mg/L Total Phosphorus
Based on the results presented in Advanced Wastewater Treatment to Achieve Low Concentration of Phosphorus (EPA, 2007), effluent TP concentrations of 0.05 mg/L may be consistently achieved using advanced wastewater treatment processes. For the purpose of this analysis, effluent phosphorus concentrations produced by treatment with membrane ultrafiltration was considered to be the LoT. Therefore, in
order to consistently achieve effluent TP objective concentrations consistent with the LoT, upgrade to membrane ultrafiltration with chemical addition for enhanced phosphorus removal would be required. Conceptual level upgrades were developed for STP’s not currently equipped with membrane ultrafiltration. Phosphorus removal and chemical dosages can be optimized via the implementation of multi-point chemical addition, which may also reduce chemical sludge production rates. Capital upgrades to provide treatment to the LoT involve the addition of membrane ultrafiltration and decommissioning of the existing tertiary filters where applicable. The capital costs to upgrade the STP’s to membrane ultrafiltration were estimated at the CofA rated ADF capacity of each plant.
The capital cost estimates include allowances for the following:
Membrane costs;
Membrane system appurtenances such as permeate pumps and piping, air scour blowers, and chemical feed systems;
Installation of the membrane system (including membrane building construction/expansion);
Piping (including process piping modifications and yard piping); and
Electrical / SCADA modifications and upgrades.
The installation, piping and electrical/SCADA costs were estimated to be 30 percent, 40 percent, and 15 percent of the total membrane system equipment cost, including membrane ultrafiltration and membrane system appurtenances. An allowance of 30 percent was also included to cover costs associated with engineering, mobilization, demobilization, contractor overhead, and other miscellaneous costs. These percentages are based on standard cost factor ranges for equipment installation at wastewater treatment facilities (EPA, 1998).
Based on supplier information for other tertiary membrane applications, an assumed peak instantaneous membrane flux of 56.8 lmh was used along with the estimated operating peak flow to develop estimated membrane surface area requirements. Supplier capital cost estimates were used to determine the capital costs for the membrane ultrafiltration and membrane appurtenances. Capital costs per m2 of membrane surface area, over a variety of total membrane surface areas, were used to develop a membrane cost curve. These unit costs ranged from $100/m2 for a total supplied surface area of approximately 70,000 m2 to $215/m2 for a total surface area of approximately 4,500 m2.
The incremental O&M costs for membrane ultrafiltration were estimated based on costs at other membrane facilities in Ontario, and include:
An estimated power and chemical cost of $0.05/m3 of wastewater treated;
A maintenance allowance of $50/m2 for the new building; and
The unit removal costs for phosphorus were calculated by dividing the 25-year life cycle cost by the cumulative phosphorus removed over a 25-year period. Unit removal costs are presented in CAD/kg TP removed.
2.3 Upgrades to Lagoon Based Systems
In order to consistently reduce effluent TP concentrations to 0.10 mg/L and below, lagoon based systems would have to be upgraded to mechanical plants with tertiary treatment and chemical addition for enhanced phosphorus removal. Phosphorus removal and chemical dosages can be optimized via the implementation of multi-point chemical addition, which may also reduce chemical sludge production rates. The capital cost estimates associated with the upgrade from lagoon based systems to mechanical plants were based on cost curves for the construction of secondary treatment plants capable of achieving nitrification. The cost curves included allowances for the following:
Control building construction;
Process tankage and equipment;
Unit process appurtenances such as pumps and piping, and chemical feed systems;
Process piping construction/modifications;
Yard piping;
Electrical / SCADA modifications and upgrades; and
An allowance to cover costs associated with engineering, mobilization, demobilization, contractor overhead, and other miscellaneous construction costs. The capital cost estimates for the construction of a new secondary treatment plant were based on cost curves developed by R.J. Burnside Associates Limited (Burnside, 2005), which were developed based on historical project experience, supplier and contractor input, other published costing information, municipal input, and theoretical calculations. The cost curves were presented in 2004 dollars.
The capital cost estimates for the addition of nitrification to a new secondary treatment plant was based on cost curves developed by Hydromantis, Inc. (Hydromantis, Enviromega and XCG, 2004), which were developed using their proprietary Capdet Works costing program for conventional processes, and vendor cost estimates for advanced treatment. The cost curves were presented in 2004 dollars.
Preliminary capital cost estimates were based on the CofA rated ADF capacity of each plant. In order to estimate the cost of construction in 2009 dollars, escalation factors obtained from the Engineering News Record (ENR) Construction Cost Index (CCI) were applied to the cost estimates.
In the upgrade of lagoon based systems to mechanical plants with tertiary filtration, the capital costs for the construction of tertiary granular media filtration were added to the capital costs for the construction of mechanical plants in order to obtain the total capital costs for the upgrade. Similarly, the capital costs for the installation of membrane ultrafiltration systems were added to the capital costs for the construction of mechanical plants in order to obtain the overall capital costs for the upgrade of lagoon based systems to mechanical plants with membrane ultrafiltration. It should be noted that the capital cost estimates do not include allowances for decommissioning of existing infrastructure, land acquisition, or modifications to the existing collection system.
O&M costs for the new mechanical treatment plants with nitrification and tertiary filtration were developed based on a cost curve for secondary treatment facilities with nitrification and tertiary filtration. The cost curve was developed based on actual O&M costs from other similarly sized secondary treatment facilities in Ontario with nitrification and tertiary filtration. An allowance for additional labour costs was also included.
O&M costs for the new mechanical treatment plants with membrane ultrafiltration systems were developed based the cost curve for secondary treatment facilities with nitrification and adjusted to include O&M costs for membrane ultrafiltration based on the following allowances:
Membrane replacement every 10 years (total membrane capital cost ($)/10 years);
An estimated power and chemical cost of $0.05/m3 of wastewater treated; and
Maintenance of the new membrane building (typical maintenance includes building repair, paint etc).
The unit removal costs for phosphorus were calculated by dividing the 25-year life cycle cost by the cumulative phosphorus removed over a 25-year period. Unit removal costs are presented in CAD/kg TP removed.
3.
R
EVIEW OFSTP
P
ERFORMANCE ANDU
PGRADES3.1 Uxbridge Brook WPCP
The Uxbridge Brook Water Pollution Control Plant (WPCP) is an extended aeration plant located at 129 Main Street North, Uxbridge Township, Ontario. The facility is owned and operated by the Regional Municipality of Durham and treats wastewater from the Town of Uxbridge. The Uxbridge Brook WPCP has a CofA rated ADF capacity of 5,221 m3/d and a peak flow capacity of 15,110 m3/d.
The headworks consist of screening through an automatically raked bar screen followed by grit removal via a vortex grit removal chamber. A manually cleaned bar screen is also provided for by-pass screening. Preliminary treated effluent flows to the two aeration tanks. From the aeration tank, mixed liquor flows to the three secondary clarifiers. Clarified effluent is passed through tertiary filtration and then disinfected with ultraviolet (UV) irradiation prior to discharge into Uxbridge Brook. Waste activated sludge (WAS) is digested in an aerobic digestion system prior to being hauled to another Regional facility for disposal.
Phosphorus removal at the Uxbridge WPCP is achieved by chemical precipitation using alum and tertiary filtration. Currently alum is added to the aeration tanks; however, provisions exist to add alum to the influent to the secondary clarifiers. Figure 3.1 presents a process flow diagram of the treatment process at the Uxbridge Brook WPCP. Vortex Grit Removal Aeration Tank #1 Aeration Tank #2 Secondary Clarifier #1 Secondary Clarifier #3 Mechanically Cleaned Bar Screen 2-Stage Aerobic Digestion Biosolids to Regional Facility for disposal Raw
Wastewater
Alum to Aeration
RAS
WAS
Uxbridge Brook WPCP Process Flow Diagram
UV Disinfection Effluent To Uxbridge Brook Manually Cleaned Bar Screen Tertiary Filtration Alum to Aeration Alum to Secondary Clarifiers (optional) Alum to Secondary Clarifiers (optional) Secondary Clarifier #2
3.1.1 Performance Requirements
The Uxbridge Brook WPCP operates under Amended CofA Number 5288-698PJD. The effluent TP objectives and limits for the Uxbridge Brook WPCP are presented in Table 3.451. Included in the table is the interim annual phosphorus loading limit as outlined in O. Reg. 60/08 and amended in O. Reg. 130/09.
Table 3.1 Certificate of Approval and Interim Effluent Phosphorus
Objectives and Limits for the Uxbridge Brook WPCP
Parameter CofA Effluent
Objective CofA Effluent Limit
(1) Interim Annual Loading Limit (2) Effluent TP Concentration 0.1 mg/L 0.15 mg/L n/v Effluent TP Loading n/v 0.78 kg/d (3) (285 kg/yr) 142 kg/yr Notes: n/v – no value
1. Limits based on monthly average concentrations.
2. Based on O. Reg. 60/08 and later amended by O. Reg. 130/09. 3. Limits based on monthly average loading.
3.1.2 Historical Performance
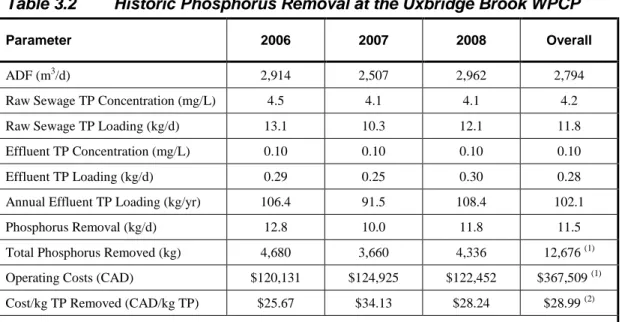
The historic operating performance of the Uxbridge Brook WPCP with respect to phosphorus removal is presented in Table 3.2.
Table 3.2 Historic Phosphorus Removal at the Uxbridge Brook WPCP
Parameter 2006 2007 2008 Overall
ADF (m3/d) 2,914 2,507 2,962 2,794
Raw Sewage TP Concentration (mg/L) 4.5 4.1 4.1 4.2
Raw Sewage TP Loading (kg/d) 13.1 10.3 12.1 11.8
Effluent TP Concentration (mg/L) 0.10 0.10 0.10 0.10
Effluent TP Loading (kg/d) 0.29 0.25 0.30 0.28
Annual Effluent TP Loading (kg/yr) 106.4 91.5 108.4 102.1
Phosphorus Removal (kg/d) 12.8 10.0 11.8 11.5
Total Phosphorus Removed (kg) 4,680 3,660 4,336 12,676 (1)
Operating Costs (CAD) $120,131 $124,925 $122,452 $367,509 (1)
Cost/kg TP Removed (CAD/kg TP) $25.67 $34.13 $28.24 $28.99 (2)
Notes:
1. Three year total.
The Uxbridge Brook WPCP has historically operated at approximately 64 percent of the CofA rated ADF capacity of 5,221 m3/d. The three year average effluent TP concentration from the plant is 0.10 mg/L, which meets the effluent objective of 0.1 mg/L. Over the period from 2006 to 2008, the monthly average effluent TP has exceeded the effluent TP objective on 14 occasions. The effluent TP concentrations did not exceed the compliance limit for TP over the reviewed period. Over the period from 2006 to 2008, the annual effluent TP loadings were below the interim limit of 142 kg/yr.
From 2006 to 2008, approximately 12,676 kg of phosphorus were removed at a total cost of approximately $367,509. The effective unit removal cost for the Uxbridge Brook WPCP was $28.99 CAD/kg TP removed.
3.1.3 Upgrades to the Existing Facility to Achieve Effluent TP Objective
Concentrations of 0.10 mg/L
The Uxbridge Brook WPCP is a secondary treatment facility with tertiary filtration. Past experience with secondary treatment facilities with tertiary filtration has indicated that effluent TP concentrations as low as 0.10 mg/L can be consistently achieved (Ross et al., 1991). Historically, the Uxbridge Brook WPCP has achieved an average effluent TP concentration of 0.10 mg/L. Therefore, it is anticipated that no further upgrades will be necessary to consistently achieve an effluent TP objective concentration of 0.10 mg/L. As the flows to the plant approach the design capacity, optimization of chemicals and chemical addition strategies such as dual point addition will likely be required in order to improve the performance of the phosphorus removal system at the Uxbridge Brook WPCP.
3.1.4 Upgrades to the Existing Facility to Achieve Effluent TP Objective
Concentrations of 0.05 mg/L
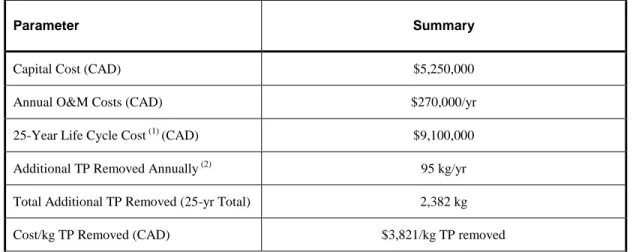
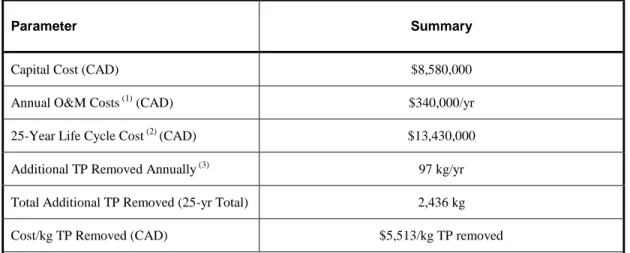
Conceptual level upgrades to the Uxbridge Brook WPCP were developed for the replacement of the existing tertiary filtration with membrane ultrafiltration. Table 3.3 presents the incremental costs associated with upgrading the Uxbridge Brook WPCP to membrane ultrafiltration. Included in the table are annual O&M costs and a 25-year life cycle cost.
Table 3.3 Incremental Costs to Upgrade to Membrane Ultrafiltration for the Uxbridge Brook WPCP
Parameter Summary
Capital Cost (CAD) $5,250,000
Annual O&M Costs (CAD) $270,000/yr
25-Year Life Cycle Cost (1) (CAD) $9,100,000
Additional TP Removed Annually (2) 95 kg/yr
Total Additional TP Removed (25-yr Total) 2,382 kg
Cost/kg TP Removed (CAD) $3,821/kg TP removed
Notes:
1. Calculated based on an inflation rate of 2.5 % and an interested rate of 7.5%.
2. Additional mass of TP removed at its CofA rated capacity based on a projected effluent TP concentration of 0.10 mg/L for a secondary treatment plant with tertiary filters and 0.05 mg/L after the installation of membrane ultrafiltration.
Upgrading the Uxbridge Brook WPCP to membrane ultrafiltration will cost an estimated $5.3M CAD with annual operating costs of approximately $270K CAD/yr. The 25-year life cycle cost is approximately $9.1M CAD. The addition of membrane ultrafiltration is projected to result in an annual reduction of approximately 95 kg TP/yr. Over 25 years, this results in a total reduction in effluent TP loading of 2,382 kg. Based on the 25-year life cycle cost, the cost per additional kg of TP removed is estimated to be $3,821 CAD/kg TP.
3.1.5 Summary of Conceptual Level Upgrade Costs
Based on the current configuration of the Uxbridge Brook WPCP, no capital upgrades would be required in order to consistently achieve an effluent TP objective concentration of 0.10 mg/L. In order to consistently reduce effluent TP concentrations to 0.05 mg/L, membrane ultrafiltration would have to be installed.
Figure 3.2 presents a side-by-side comparison of the historic cost per kg of TP removed and the cost per additional kg of TP removed as a result of the conceptual level upgrades to achieve effluent TP objective concentrations of approximately 0.05 mg/L.
Figure 3.2 Unit Removal Costs for the Uxbridge Brook WPCP
The estimated cost per kg of TP removed at the Uxbridge Brook WPCP as a result of the upgrade to membrane ultrafiltration is greater than 130 times the historic unit removal cost.
3.2 Beaver River #1 (Sunderland) WPCP
The Beaver River #1 WPCP (Sunderland) is a seasonal wastewater stabilization lagoon system that services the Township of Brock/former Village of Sunderland and has a CofA rated ADF capacity of 632 m3/d. The plant is owned and operated by the Regional Municipality of Durham.
Wastewater from the community of Sunderland is pumped through a 1,300 m long forcemain to the lagoon inlet chamber and directed to Cell #1. The influent distribution chamber has provisions for connection to a future third cell.
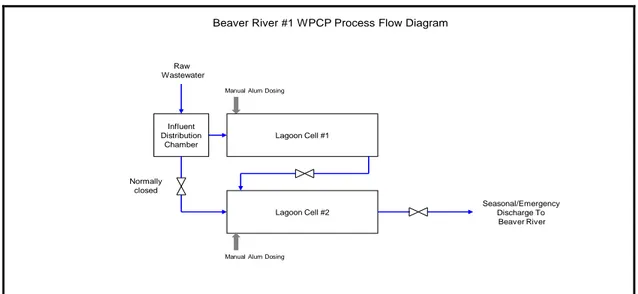
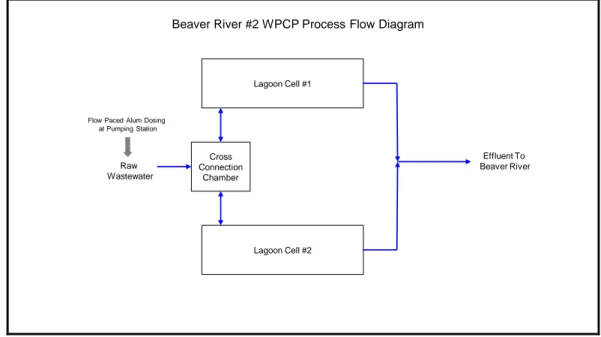
Cell #1 is designed to provide 2-day retention time to promote the settling of solids. Wastewater is then conveyed to Cell #2 via a cross connection chamber. Cell #2 has a design retention time of 106 days, and is operated as an exfiltration lagoon with provisions for direct discharge to surface water when discharge requirements exceed the exfiltration rate. In this event, the Beaver River #1 WPCP operates as a seasonal discharge lagoon.
Alum is added on a batch-wise basis to the wastewater within each lagoon to promote the chemical precipitation of phosphorus. To ensure a uniform concentration throughout the lagoon, alum is dosed using a modified watercraft. When discharge requirements exceed the exfiltration rate of Cell #2, effluent can be discharged via an outfall pipe to a ditch that discharges to the Beaver River and in turn to Lake Simcoe.
Figure 3.3 presents a process flow diagram of the treatment process at the Beaver River #1 WPCP.
Raw Wastewater
Manual Alum Dosing
Beaver River #1 WPCP Process Flow Diagram
Seasonal/Emergency Discharge To Beaver River Influent Distribution Chamber Lagoon Cell #1 Lagoon Cell #2
Manual Alum Dosing
Normally closed
Figure 3.3 Beaver River #1 WPCP Process Flow Diagram
3.2.1 Performance Requirements
The Beaver River #1 WPCP operates under CofA Number 1235-7EGMXA. The effluent TP objectives and limits for the Beaver River #1 WPCP are presented in Table 3.4. Included in the table is the interim annual phosphorus loading limit as outlined in O. Reg. 60/08 and amended in O. Reg. 130/09.
Table 3.4 Certificate of Approval and Interim Effluent Phosphorus
Objectives and Limits for the Beaver River #1 WPCP
Parameter Effluent Limit Interim Annual Loading Limit (1)
Effluent TP Concentration 0.3 mg/L n/v
Effluent TP Loading n/v 66 kg/yr
Notes: n/v – no value
1. Based on O. Reg. 60/08 and later amended by O. Reg. 130/09.
3.2.2 Historical Performance
The historic operating performance of the Beaver River #1 WPCP with respect to phosphorus removal is presented in Table 3.5.
Table 3.5 Historic Phosphorus Removal at the Beaver River #1 WPCP
Parameter 2006 (1) 2007 2008 Overall
ADF (2) (m3/d) 326 143 463 311
Raw Sewage TP Concentration (mg/L) 3.8 4.5 3.7 4.0
Raw Sewage TP Loading (kg/d) 1.2 0.6 1.7 1.2
Effluent TP Concentration (mg/L) 0.11 0.15 0.20 0.15
Effluent TP Loading (kg/d) 0.04 0.02 0.09 0.05
Annual Effluent TP Loading (kg/yr) 13.1 7.8 33.9 18.3
Phosphorus Removal (kg/d) 1.2 0.6 1.6 1.2
Total Phosphorus Removed (kg) 439 227 593 820 (3)
Operating Costs (CAD) n/a $6,838 $8,107 $14,944 (3)
Cost/kg TP Removed (CAD/kg TP) n/a $30.14 $13.68 $18.24 (4)
Notes:
n/a – not available
1. Operating Costs were not available for 2006.
2. ADF was based on total annual effluent discharged divided by the number of days in the year. 3. Two year total based on 2007 and 2008 data.
4. Based on two year total Operating Costs divided by two year Total Phosphorus Removed.
The Beaver River #1 WPCP has historically operated at approximately 49 percent of the CofA rated ADF capacity of 632 m3/d. The three year average effluent TP concentration from the plant is 0.15 mg/L, which meets the effluent objective of 0.3 mg/L. Over the period from 2006 to 2008, the monthly average effluent TP did not exceed the effluent TP compliance limit. Over the period from 2006 to 2008, the annual effluent TP loadings were below the interim limit of 66 kg/yr.
Operating costs were not available from 2006. As a result, the cost analysis was based on 2007 and 2008 data. From 2007 to 2008, approximately 820 kg of phosphorus were removed at a cost of $14,944. The effective unit removal cost for the Uxbridge Brook WPCP was $18.24 CAD/kg TP removed. It should be noted that sludge removal was not performed on the Beaver River #1 WPCP in 2007 or 2008. Therefore, the operating costs presented in Table 3.5 do not include dredging and sludge haulage costs. As a result, the cost per kg of TP removed may be underestimated as they do not include any costs related to sludge removal from the lagoons.
3.2.3 Upgrades to the Existing Facility to Achieve Effluent TP Objective
Concentrations of 0.10 mg/L
Conceptual level costs for upgrades to the Beaver River #1 WPCP were developed for the construction of a mechanical plant with tertiary filtration. Table 3.76 presents the incremental costs associated with upgrading the Beaver River #1 WPCP to
secondary treatment with tertiary filtration. Included in the table are annual O&M costs and a 25-year life cycle cost.
Table 3.6 Incremental Costs to Upgrade to Secondary Treatment with
Tertiary Filtration for the Beaver River #1 WPCP
Parameter Summary
Capital Cost (CAD) $6,840,000
Annual O&M Costs (1) (CAD) $170,000/yr
25-Year Life Cycle Cost (2) (CAD) $9,270,000
Additional TP Removed Annually (3) 46 kg/yr
Total Additional TP Removed (25-yr Total) 1,153 kg
Cost/kg TP Removed (CAD) $8,033/kg TP removed
Notes:
1. Annual O&M costs for upgrades from lagoon based systems to mechanical plants with tertiary filtration include O&M costs associated with the secondary treatment facility.
2. Calculated based on an inflation rate of 2.5 % and an interested rate of 7.5%.
3. Additional mass of TP removed at its CofA rated capacity based on a projected effluent TP concentration of 0.30 mg/L for a seasonal discharge lagoon and an effluent TP of 0.10 mg/L for a secondary treatment plant with tertiary filters.
Upgrading the Beaver River #1 WPCP to a secondary treatment facility with tertiary filtration will cost an estimated $6.8M CAD with annual operating costs of approximately $170K CAD/yr. The 25-year life cycle cost is approximately $9.3M CAD. The addition of tertiary filtration is projected to result in an annual reduction of approximately 46 kg TP/yr. Over 25 years, this results in a total reduction in effluent TP loading of 1,153 kg. Based on the 25-year life cycle cost, the cost per additional kg of TP removed is estimated to be $8,033 CAD/kg TP. It should be noted that the total estimated O&M costs for the operation of the new mechanical treatment plant are included in the annual O&M costs presented in Table 3.6.
3.2.4 Upgrades to the Existing Facility to Achieve Effluent TP Objective
Concentrations of 0.05 mg/L
Conceptual level upgrades to the Beaver River #1 WPCP were developed for the construction of a mechanical plant with membrane ultrafiltration. Table 3.7 presents the incremental costs associated with upgrading the Beaver River #1 WPCP from the existing lagoon based system to secondary treatment with membrane ultrafiltration. Included in the table are annual O&M costs and a 25-year life cycle cost.
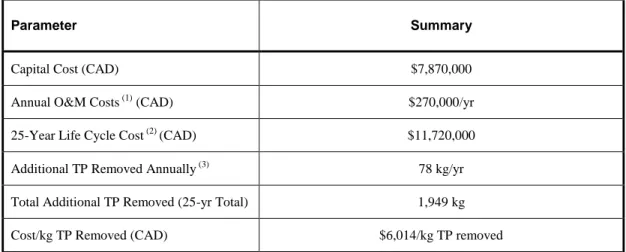
Table 3.7 Incremental Costs to Upgrade to Secondary Treatment with Membrane Ultrafiltration for the Beaver River #1 WPCP
Parameter Summary
Capital Cost (CAD) $7,060,000
Annual O&M Costs (1) (CAD) $210,000/yr
25-Year Life Cycle Cost(2) (CAD) $10,060,000
Additional TP Removed Annually (3) 58 kg/yr
Total Additional TP Removed (25-yr Total) 1,442 kg
Cost/kg TP Removed (CAD) $6,975/kg TP removed
Notes:
1. Annual O&M costs for upgrades from lagoon based systems to mechanical plants with tertiary filtration include O&M costs associated with the secondary treatment facility.
2. Calculated based on an inflation rate of 2.5 % and an interested rate of 7.5%.
3. Additional mass of TP removed at its CofA rated capacity based on a projected effluent TP concentration of 0.30 mg/L for a seasonal discharge lagoon and 0.05 mg/L after the installation of membrane
ultrafiltration.
Upgrading the Beaver River #1 WPCP to membrane ultrafiltration will cost an estimated $7.1M CAD with annual operating costs of approximately $210K CAD/yr. The 25-year life cycle cost is approximately $10.1M CAD. Upgrading to a secondary treatment plant with membrane ultrafiltration is projected to result in an annual reduction of approximately 58 kg TP/yr. Over the 25 years, this results in a total reduction in effluent TP loading of 1,442 kg. Based on the 25-year life cycle cost, the cost per additional kg of TP removed is estimated to be $6,975 CAD/kg TP. It should be noted that the total estimated O&M costs for the operation of the new mechanical treatment plant are included in the annual O&M costs presented in Table 3.7.
3.2.5 Incremental Costs to Upgrade to Membrane Ultrafiltration
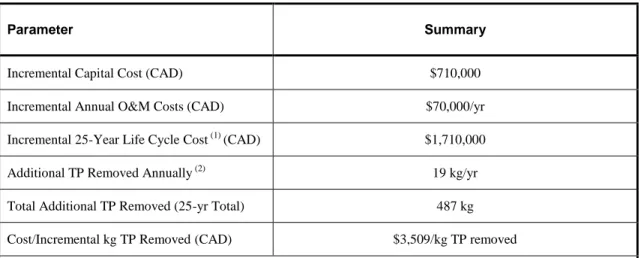
Upgrading from a lagoon based system to a mechanical plant with membrane ultrafiltration will result in improved phosphorus removal compared to upgrading to a mechanical plant with tertiary filtration. At the same time, the capital and O&M costs for a mechanical plant with membrane ultrafiltration will be higher than the costs for a mechanical plant with tertiary filtration. Table 3.8 presents the incremental cost associated with upgrading the Beaver River #1 WPCP to secondary treatment with membrane ultrafiltration compared to tertiary filtration. Included in the table are annual O&M costs and a 25-year life cycle cost.
Table 3.8 Incremental Costs to Upgrade to Membrane Ultrafiltration Instead of Tertiary Filtration for the Beaver River #1 WPCP
Parameter Summary
Incremental Capital Cost (CAD) $220,000
Incremental Annual O&M Costs (CAD) $40,000/yr
Incremental 25-Year Life Cycle Cost (1) (CAD) $790,000
Additional TP Removed Annually (2) 12 kg/yr
Total Additional TP Removed (25-yr Total) 289 kg
Cost/Incremental kg TP Removed (CAD) $2,736/kg TP removed
Notes:
1. Calculated based on an inflation rate of 2.5 % and an interested rate of 7.5%.
2. Additional mass of TP removed at its CofA rated capacity based on a projected effluent TP concentration of 0.10 mg/L for a secondary treatment plant with tertiary filters and 0.05 mg/L for a secondary treatment plant with membrane ultrafiltration.
Upgrading to membrane ultrafiltration instead of conventional tertiary filtration would result in improved phosphorus removal of 12 kg TP/yr. Over 25 years, this would result in an increase in total phosphorus removal of 289 kg. Upgrading to membrane ultrafiltration instead of conventional tertiary filtration results in an additional capital cost of $0.2M CAD, O&M costs that are nearly 24 percent greater, and a 25-year life cycle cost that is approximately $0.8M CAD greater. Incrementally, the improved phosphorus removal achieved as a result of membrane ultrafiltration over conventional tertiary filtration would come at a unit removal cost of $2,736 CAD/kg TP.
The incremental cost per unit of TP removed as a result of upgrading to a mechanical plant with membrane ultrafiltration is lower than for the upgrade to a mechanical plant with tertiary filtration. This is the result of the requirement to upgrade from a lagoon based system to mechanical treatment. The majority of the capital costs are due to the construction of the mechanical plant. The difference in 25-yr life cycle costs represents an increase of almost 9 percent, compared to an improvement in phosphorus removal of about 26 percent. The result is a lower unit removal cost for the upgrade to a mechanical plant with membrane ultrafiltration than for the upgrade to a mechanical treatment plant with tertiary filtration.
3.2.6 Summary of Conceptual Level Upgrade Costs
Based on the current configuration of the Beaver River #1 WPCP, the lagoon based system would require upgrading to a mechanical treatment plant with tertiary filtration in order to consistently achieve an effluent TP concentration of 0.10 mg/L. In order to consistently reduce effluent TP concentrations to 0.05 mg/L, membrane ultrafiltration would have to be installed.
Figure 3.4 presents a side-by-side comparison of the historic cost per kg of TP removed and the cost per additional kg of TP removed as a result of the conceptual level upgrades.
Figure 3.4 Unit Removal Costs for the Beaver River #1 WPCP
The cost per kg of TP removed at the Beaver River #1 WPCP as a result of the upgrade to tertiary filtration is about 15 percent greater than the unit cost for upgrading to membrane ultrafiltration. This is the result of a 26 percent improvement in TP removal at a cost of an additional $0.8M CAD. The cost per additional kg of TP removed as a result of upgrading to membrane ultrafiltration instead of conventional tertiary filtration is $2,736 CAD/kg TP.
3.3 Lake Simcoe (Beaverton) WPCP
The Lake Simcoe (Beaverton) WPCP is an extended aeration plant located in the Township of Brock (Beaverton). The Lake Simcoe WPCP has a CofA rated ADF capacity of 4,550 m3/d, a peak flow capacity of 22,750 m3/d through preliminary treatment, a peak flow capacity of 13,650 m3/d through secondary treatment, and a tertiary treatment capacity of 6,825 m3/d. The facility is owned and operated by the Regional Municipality of Durham.
The headworks consist of screening through an automatically raked bar screen followed by grit removal via an induced vortex aerated grit tank. A manually cleaned bar screen is also provided for by-pass screening. Preliminary treated effluent flows to the two aeration tanks. From the aeration tank, mixed liquor flows to the two secondary clarifiers. Tertiary clarification is provided following secondary clarification. Tertiary clarified effluent is passed through tertiary filtration and then disinfected with UV irradiation prior to discharge into Lake Simcoe.
WAS is digested in an aerobic digestion tank prior to being hauled off-site to another Regional facility for disposal.
Phosphorus removal at the Lake Simcoe WPCP is achieved by chemical precipitation using alum and tertiary clarification and filtration. Currently alum is added within the aeration tank, and upstream of the tertiary treatment processes. Provisions exist to add alum at the secondary clarifiers and for polymer addition to the tertiary clarifier.
Figure 3.5 presents a process flow diagram of the treatment process at the Lake Simcoe WPCP. Aerated Grit Tank Aeration Tank #1 Aeration Tank #2 Secondary Clarifier #2 Mechanically Cleaned Bar Screen Raw Wastewater Alum to Aeration RAS WAS
Lake Simcoe WPCP Process Flow Diagram
UV Disinfection Effluent To Lake Simcoe Manually Cleaned Bar Screen Tertiary Filtration Alum to Aeration Alum to Secondary Clarifiers (optional) Alum to Secondary Clarifiers (optional) Secondary Clarifier #1 Tertiary Clarifier Tertiary Sludge Alum to Tertiary Treatment Aerobic Digestion Biosolids to Regional Facility for disposal
Polymer (optional)
Figure 3.5 Lake Simcoe WPCP Process Flow Diagram
3.3.1 Performance Requirements
The Lake Simcoe WPCP operates under CofA Number 3-0390-94-956. The effluent objectives and limits for the Lake Simcoe WPCP are presented in Table 3.9. Included in the table is the interim annual phosphorus loading limit as outlined in O. Reg. 60/08 and amended in O. Reg. 130/09.
Table 3.9 Certificate of Approval and Interim Effluent Phosphorus Objectives and Limits for the Lake Simcoe WPCP
Parameter Effluent Objective (1) Effluent Limit (2) Interim Annual
Loading Limit (3)
Effluent TP Concentration 0.12 mg/L 0.3 mg/L n/v
Effluent TP Loading n/v 190 kg/yr 104 kg/yr
Notes: n/v – no value
1. Limits based on annual average concentrations. 2. Limits based on monthly average concentrations.
3. Based on O. Reg. 60/08 and later amended by O. Reg. 130/09.
3.3.2 Historical Performance
The historic operating performance of the Lake Simcoe WPCP with respect to phosphorus removal is presented in Table 3.10.
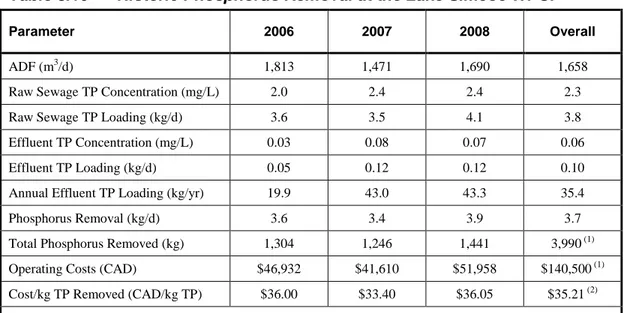
Table 3.10 Historic Phosphorus Removal at the Lake Simcoe WPCP
Parameter 2006 2007 2008 Overall
ADF (m3/d) 1,813 1,471 1,690 1,658
Raw Sewage TP Concentration (mg/L) 2.0 2.4 2.4 2.3
Raw Sewage TP Loading (kg/d) 3.6 3.5 4.1 3.8
Effluent TP Concentration (mg/L) 0.03 0.08 0.07 0.06
Effluent TP Loading (kg/d) 0.05 0.12 0.12 0.10
Annual Effluent TP Loading (kg/yr) 19.9 43.0 43.3 35.4
Phosphorus Removal (kg/d) 3.6 3.4 3.9 3.7
Total Phosphorus Removed (kg) 1,304 1,246 1,441 3,990 (1)
Operating Costs (CAD) $46,932 $41,610 $51,958 $140,500 (1)
Cost/kg TP Removed (CAD/kg TP) $36.00 $33.40 $36.05 $35.21 (2)
Notes:
1. Three year total.
2. Based on three year total Operating Costs divided by three year Total Phosphorus Removed.
The Lake Simcoe WPCP has historically operated at approximately 36 percent of the CofA rated ADF capacity of 4,550 m3/d. The three year average effluent TP concentration from the plant is 0.06 mg/L, which meets the effluent objective of 0.12 mg/L. Over the period from 2006 to 2008, the monthly average effluent TP has exceeded the effluent TP objective on two occasions. The effluent TP concentrations did not exceed the compliance limits for TP over the reviewed period. Over the period from 2006 to 2008, the annual effluent TP loadings were below the interim limit of 104 kg/yr.
From 2006 to 2008, approximately 3,990 kg of phosphorus were removed at a cost of $140,500. The estimated unit removal cost for the Lake Simcoe WPCP was $35.21 CAD/kg TP removed.
3.3.3 Upgrades to the Existing Facility to Achieve Effluent TP Objective
Concentrations of 0.10 mg/L
The Lake Simcoe WPCP has a CofA rated peak flow capacity of 13,650 m3/d through secondary treatment, while the tertiary treatment stream has a CofA rated peak flow capacity of 6,825 m3/d. Therefore, it is anticipated that in order to consistently achieve a maximum effluent TP concentration of 0.10 mg/L across the range of expected flows to the plant, the existing tertiary filtration will require expansion.
Table 3.11 presents the incremental costs associated with expanding the tertiary treatment system at the Lake Simcoe WPCP. Included in the table are annual O&M costs and a 25-year life cycle cost.
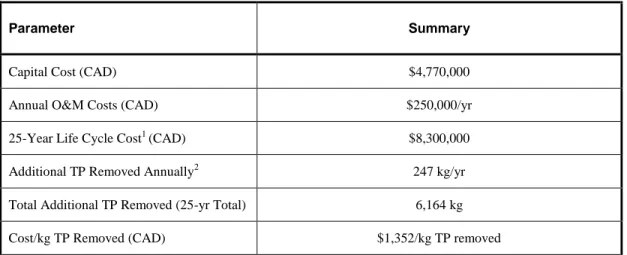
Table 3.11 Incremental Costs to Expand the Existing Tertiary Treatment
for the Lake Simcoe WPCP
Parameter Summary
Capital Cost (CAD) $780,000
Annual O&M Costs (CAD) $5,000/yr
25-Year Life Cycle Cost (1) (CAD) $900,000
Additional TP Removed Annually (2) 164 kg/yr
Total Additional TP Removed (25-yr Total) 4,088 kg
Cost/kg TP Removed (CAD) $208/kg TP removed
Notes:
1. Calculated based on an inflation rate of 2.5 % and an interested rate of 7.5%.
2. Additional mass of TP removed at its CofA rated capacity based on a projected effluent TP concentration of 0.30 mg/L for a secondary treatment plant without tertiary filtration; effluent TP concentration of 0.10 mg/L for a secondary treatment plant with tertiary filtration; and the ratio of unfiltered peak flow to total peak flow at existing conditions.
Expanding the tertiary filters at the Lake Simcoe WPCP will cost an estimated $0.8M CAD with an increase in annual operating costs of approximately $5K CAD/yr. The 25-year life cycle cost is approximately $0.9M CAD. The expansion of the tertiary treatment system is projected to result in an annual reduction of approximately 164 kg TP/yr. Over 25 years, this results in a total reduction in effluent TP loading of 4,088 kg. Based on the 25-year life cycle cost, the cost per additional kg of TP removed is estimated to be $208 CAD/kg TP.