Newsletter Inter-domain QoS, Issue 8, March 2004
Online monthly journal of INTERMON consortia
Dynamic information concerning research, standardisation and practical issues of inter-domain QoS
---Special issue on detection of faults in inter-domain
environment
There are different faults in inter-domain
environment which could influence the end-to-end
connection behaviour. The network engineer should be
able to detect different kinds of fault behaviour of QoS
parameter values, routing events (BGP-4 protocol
patterns) and traffic to obtain their patterns and to analyse
their causes in the specific context.
INTERMON toolkit allows to study faults based on
patterns (behaviour structures) by usage of dedicated
tools.
We describe the detection and analysis of different
kinds of patterns using INTERMON tools:
-
BGP-4 patterns which could impact the
behaviour of end-to-end connection
-
QoS outlier , i.e. abnormal delay and packet loss
patterns.
Based on systematical measurement and analysis
strategies to study causes of QoS abnormal behaviour
(outliers) it is possible to relate them to discovered
inter-domain routing events such as BGP-4 patterns and
traffic loads.
---Detection of inter-domain routing problems
using BGP-4 protocol patterns
P.A. Gutiérrez
1.
Introduction to BGP-4 database analysis
results
BGP-4 has been the driving force in many
measurement scenarios in the last phase of the
INTERMON project. Due to the lack of access to private
BGP-4 routing data, the project used the incomplete, but
public BGP-4 route repositories.
2.
Scenario definition
Several measurement scenarios have been used in the
INTERMON project. BGP-4 data analysis has been
initially conducted for the measurement lag between
Madrid and Salzburg. During the scenario analysis phase,
it was observed that this measurement lag passed through
the London Internet Exchange (LINX), traversing
intermittently routers which donate their routing data to
the RIPE Routing Repositories.
3.
Dataset size reduction
The data stored in the 'rrc01' directory structure of the
RIPE Routing Repositories was studied for the period
between the 27
thof November, 2003 and the 6
thof
January, 2004.
During this time, the mean size of the Routing Table
Snapshot files (
bview files) was around 5*10
5records.
The mean size of the sum of all daily Routing Activity
files (update files) for one day was around 3*10
5records.
This huge amount of data is reduced to 11 significant
routing table snapshot and 77 routing updates records for
the whole aforementioned period.
4.
BGP-4 patterns
During the period under study , different patterns of
updates could be found, depending on the way they are
classified. INTERMON has classified routing updates
based on the router they arrive at. Based on this first
criterion, following patterns were observed
1.
Intermediate AS refresh: An intermediate AS
announces routes to both endpoints in a narrow
time window:
<Update> <Type>A</Type> <Timestamp spec="27-11-2003 17:01:00">1069948860</Timestamp> <IPPrefix>194.179.0.0/18</IPPrefix> <ASPath>286 12956 3352</ASPath> </Update> <Update> <Type>A</Type> <Timestamp spec="27-11-2003 17:01:02">1069948862</Timestamp> <IPPrefix>212.183.0.0/17</IPPrefix> <ASPath>286 8447</ASPath>In the previous sample, an AS which is situated
between the endpoints and the Internet Exchange
has refreshed the routing tables and has produced
these advertisements as a result of the refresh.
2.
Route flap: A route has become unstable and is
repeatedly being advertised by a peer to the
Internet Exchange during a narrow time
window:
<Type>A</Type> <Timestamp spec="15-12-2003 08:45:43">1071474343</Timestamp> <IPPrefix>194.179.0.0/18</IPPrefix> <ASPath>13237 12956 3352</ASPath> </Update> <Update> <Type>A</Type> <Timestamp spec="15-12-2003 08:45:47">1071474347</Timestamp> <IPPrefix>194.179.0.0/18</IPPrefix> <ASPath>13237 12956 3352</ASPath> </Update>
3.
Dampened route flap: In principle, the
dampened route flap is a route flap sequence
terminated with a route withdraw advertisement.
In this case, the route flapping mechanism has
been triggered and the route is put into
quarantine until it is stable again.
4.
Traffic Engineering techniques: A route is being
advertised repeatedly with different AS_PATH
attributes. The AS_PATH_PREPEND technique
is used to artificially control the precedence of
the route in the routing table
<Update> <Type>A</Type> <Timestamp spec="11-12-2003 19:00:57">1071165657</Timestamp> <IPPrefix>212.183.0.0/17</IPPrefix> <ASPath>3356 8447</ASPath> </Update> <Update> <Type>A</Type> <Timestamp spec="11-12-2003 19:16:25">1071166585</Timestamp> <IPPrefix>212.183.0.0/17</IPPrefix> <ASPath>3356 8447 8447</ASPath> </Update> <Update> <Type>A</Type> <Timestamp spec="11-12-2003 19:46:26">1071168386</Timestamp> <IPPrefix>212.183.0.0/17</IPPrefix> <ASPath>3356 8447</ASPath>
</Update>
The time window of these pattern is quite broad, in order
to circumvent the route flap dampening mechanism.
Narrow time windows imply a high probability of route
flap dampening, which would imply that the sequence
ends with a route withdraw.
---Detection of outlier patterns for study of
abnormal QoS parameter behaviour in
inter-domain environment
I. Miloucheva
1.
Introduction to outliers
Outlier is an abnormal QoS parameter behaviour.
Detection of outlier patterns in QoS parameter
measurement data allows to study the structure of the
abnormal QoS parameter behaviour [MAM 03].
A special tool aimed at outlier detection and analysis
is integrated in INTERMON allowing to analyse
abnormal behaviour of QoS parameter of end-to-end
connections in inter-domain environment.
Using this tool, the structure of outlier values is
analysed and compared, occurrence and timely
relationships of outlier patterns of different QoS
parameter values are discovered.
The interest of this paper is to show the usage of the
outlier detection tool in packet loss and delay outlier
patterns study of real measurement data of end-to-end
connection in inter-domain environment.
2.
User interface for study of outliers
Outliers are defined related to an threshold value
d
thr_m. A sequence of x
1,...x
i,...x
n, belonging to the time
series data sequence {X
t} build an “outlier”, when for all
x
i, i = 1..n, hold that x
i> d
thr_m.
For instance., threshold for delay outliers could be
selected considering abnormal behaviour in context of
some specific application, for instance threshold of 150
ms in respect to VoIP QoS guarantee. Thresholds could
be also defined by very unexpected values, which occurs
and deviate in multiple times from the normal behaviour.
Packet loss threshold could be defined for some period,
i.e. aggregation interval, as sum of occurred packet
losses, or could be defined in form of packet loss burst,
i.e. threshold for the count of consecutive packet losses.
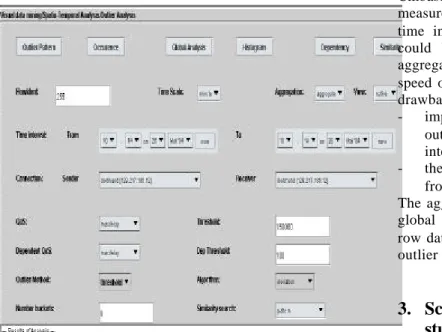
Outlier patterns are detected using a special tool with
an user interface allowing to set different options for
outlier pattern analysis, as it is shown in the next figure:
Figure 1: Outlier user interface
The outlier analysis in INTERMON is based the QoS
parameter data collected per flows which are contained in
the cmbase of INTERMON.
There are different functions to study outlier in
INTERMON which are included in the user interface:
-
Outlier structure per flow with optional specification
of start and end time for outlier. Type of outlier
pattern , i.e. decrease, increase, is discovered, which
could support to detect the cause of the outlier, for
instance packets delayed in a router [D20]. The
function includes the discovery of relative length of
outliers duration in the observed interval ?t.L
di=
? L
di,k/?t, where L
di,kis the duration of the outlier
pattern P
di,k.-
Analysis of the occurrence of the outlier patterns.
Occurrence and frequency of “outlier” sequences in
a given time interval and for a given period (daily,
monthly), i.e. the number of observations of
“outlier” patterns P
di,k, k = 1..m, related to the time
interval ? t : F
di= ? P
di, k/ ?t.
-
Global analysis of outliers in a spatio-temporal
context or in the whole data base with optional
specification of sender and receiver hosts of the
end-to-end connection.
-
Outlier structure dependencies – discover related
outliers found in the specified time intervals
following or preceding a given outlier.
-
Histogram for analysis of the values of the outliers,
and their assignment to appropriate buckets (ranges)
bi, i = 1...k, of QoS threshold values.
Cmbase allows usage of different kind of QoS parameter
measurement data - row and aggregated per specified
time interval. Different options – row and aggregate
could be used in outlier structure study. Usage of
aggregated QoS parameter data allows to increase the
speed of the discovery of outliers, but it has also some
drawbacks:
-
implies reduced accuracy in measurement (the
outlier occurrence is given in the aggregation
interval range and not at exact time it occurs)
-
the sequence of the outliers could not be obtained
from the aggregated data.
The aggregated analysis is therefore useful for study of
global outlier occurrence and dependencies, where the
row data based outlier analysis is aimed at fine grained
outlier study.
3.
Scenarios for abnormal QoS behaviour
study based on outliers
The design of cmbase allows to study outliers
considering row and aggregated QoS parameters
measured for end-to-end flows in different
spatio-temporal context.
We discuss detection of end-to-end delay outlier
patterns for fault management using real measurement
data of connection Madrid – Salzburg collected in
cmbase.
We show different scenarios to study outliers:
-
Global analysis of outliers based on selected
spatio-temporal contexts allowing to detect similar outliers
in different end-to-end connections in inter-domain
environment. A particular case is detection of
outliers contained in all measurements collected in
the data base.
-
Outlier structure analysis aimed at end-to-end delay
outlier patterns showing abnormal behaviour found
in the real measurement data as well as packet loss
outlier patterns in real measurement data. This
analysis should also show in exact way dependencies
of end-to-end delay outlier patterns from packet loss
patterns.
The global outlier analysis per aggregation period is
used to study occurrences of outliers in different
connections, which is important for evaluation of the
properties of connections for capacity planning and
forecasting.
Fine grained delay and packet loss outlier structure
analysis based on row QoS parameter data we use for
fault management in order to detect causal behaviour of
outliers and their dependencies.
3.1
Global end-to-end delay analysis of QoS
parameter data based on aggregated data
Global analysis of QoS parameter data is usually used
to discover similar outlier behaviour in different
connections (flows) measured in some specific time,
which could include a long time period.
The global analysis function allows to detect properties
of all occurrences of outliers of specific kind (end-to-end
delay, packet loss) corresponding to a given threshold in
their specific spatio-temporal context. In cmbase design,
the spatio-temporal context of the end-to-end connection
is described by the flow notion. We use the global
outlier analysis functions, to see if periodical and similar
outliers occur in different flows and their structure.
It is also used to compare the detected outliers and
to relate them to specific events found in this
spatio-temporal context. Appendix 1 shows the maximum delay
outliers exceeding 150 ms as found on different flows in
different times on connection Madrid-Salzburg.
For the end-to-end connection Madrid-Salzburg,
based on QoS monitoring, was detected that an
unexpected abnormal end-to-end delay parameter value
over 200000 ms, ca 4 minutes, occurring 11
thof
December 2003 at 04:07:00 and 04:09:09. This delay
outlier is extremely unusual, i.e. in multiple times (in
range of 1000 multitudes ) greater value that the normal
end-to-end delay behaviour in the range of 50-100 ms of
this connection.
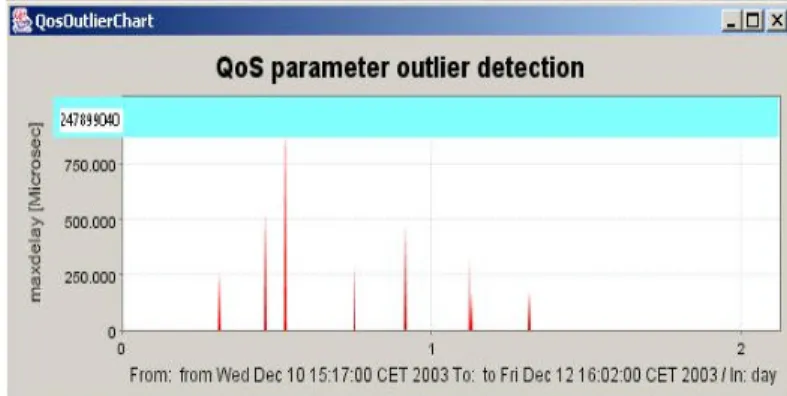
Using global analysis, it is shown based on
aggregated data (300 sec aggregation interval), that the
abnormal end-to-end delay QoS parameter values in the
range of 3-4 minutes (over 200000 ms) were found also
in other time periods (27
thof November 2003 at 21:38:00
CET).
The lists of delay outliers over 200000 ms with
description of their occurrence and maximal values,
based on aggregated QoS parameter data describing
maximum delay for all flows of the connection Madrid
Salzburg is shown:
Global Outlier Analysis: maxdelayOutlier value:200000000 [microseconds]
Flow: 141 Conn: 194.179.25.33->212.183.10.170 Aggregate: 300sec
Start/End: Wed Nov 26 16:08:00 CET 2003|Fri Nov 28 16:08:00 CET 2003
Outlier: Maximal outlier: 2.32803424E8 [microseconds] Outlier frequency: 1 Relative length: 0.0034662045
Outlier:Thu Nov 27 21:38:00 CET 2003 Max_QoS_value: 2.32803424E8 [microseconds] Distance: 105600 sec
Flow: 255 Conn: 194.179.25.33->212.183.10.170 Aggregate: 300sec
Start/End: Wed Dec 10 15:17:00 CET 2003|Fri Dec 12 16:02:00 CET 2003
Outlier: Maximal outlier: 2.4789904E8 [microseconds] Outlier frequency: 1 Relative length: 0.0017064846
Outlier:Thu Dec 11 04:07:00 CET 2003 Max_QoS_value: 2.4789904E8 [microseconds] Distance: 45900 sec
Flow: 273 Conn: Aggregate: 600sec
Start/End: Wed Dec 10 15:39:09 CET 2003|Sun Dec 14 15:39:09 CET 2003
Outlier: Maximal outlier: 2.47918688E8 [microseconds] Outlier frequency: 1 Relative length: 0.0017331023
Outlier:Thu Dec 11 04:09:09 CET 2003 Max_QoS_value: 2.47918688E8 [microseconds] Distance: 44400 sec
The global analysis based on aggregated values allows to
obtain information on spatio-temporal occurrence,
distance (i.e. time interval) between outlier and
maximum outlier value. The accuracy of outlier
frequency and their relative time is restricted by the
aggregation interval (in our case 300 sec) .
Aggregated QoS parameter values are evaluated by
minimum, mean and maximum values per interval. There
is also interesting to check in the aggregation interval
where extreme abnormal maximum delay occurs, what
are the minimum delay values which are normally due to
propagation delay and router overhead (BGP-4).
Minimum delay outlier on the connection Madrid –
Salzburg is found only on 29
thof July 2003, at 13:09 in
the range of
25629716 microsecond(see Appendix 2)
which could be due to changes of router and transmission
overhead at this period.
As in Appendix 2 is shown, minimum delay outliers over
150 ms ranging up to
578802 microsecondsare found often
on the connection Salzburg. Although
Brazil-Salzburg connection has longer end-to-end delay in
mean, the extreme maximum and minimum end-to-end
delay outlier are significant lower than on the connection
Madrid-Salzburg. This is shown in appendix 3 where the
maximum end-to-end delay outliers are shown for
Brazil-Madrid which do not exceed 1169183 microsecond in
these measurements.
The observations based on the global analysis for the two
connections have shown at least that there are two kinds
of inter-domain connections concerning end-to-end delay
outliers:
-
connections (like Madrid-Salzburg) with very
extreme end-to-end delay outliers compared to the
normal experienced delay values (in rnge of 1000
times greater outlier values comparable with normal
behaviour)
-
connections (like Brazil-Salzburg) with smaller
extreme outlier values which are greater in range of
10 times than the normal behaviour.
Correspondingly, we could use the global analysis to
detect abnormal (e.g. extreme ) packet loss rate and
packet loss bursts found in the aggregation intervals of
the different connections (see appendix 4 for packet burst
over 50 packets , i.e. maximum number of sequenced
packet losses found in the different connections in
inter-domain environment)
Packet loss like delay and other parameters depends on
the time scale of measurements. In our measurements we
use interval of 1 sec for sending of packets except in flow
273 where 20 ms was used. Therefore looking at
Appendix 4 we could conclude for the global analysis of
the packet loss bursts that in the connection
Brazil-Salzburg prevailing are bursts in range of 50-62 packets.
Very great packet loss sequences are typical for the two
connections and there are typical more packet loss
sequences reported than at connection Madrid-Salzburg.
However, the two connections experience great packet
loss bursts over 300 sequenced losses ranging to 1000
and more sequenced packet losses at different times
which should be further studied.
3.2
Analysis of outlier patterns using
aggregated data per flow – delay and
packet loss
For the different cases where the extreme abnormal
end-to-end delay outlier over 200000 ms occurred (i.e.
connection 141, 255, 273), we give the corresponding
visualisation of the maximum delay outlier behaviour
considering also outliers which exceed the threshold of
150 ms. The visualisation represents the great difference
of the extreme outlier values to the other outliers, i.e. the
extreme outlier value are given in other measurement
scale, than the rest of outliers which values are close:
Figure 2: Pattern of end-to-end delay outlier based on aggregated data with threshold of 150 ms– flow 141
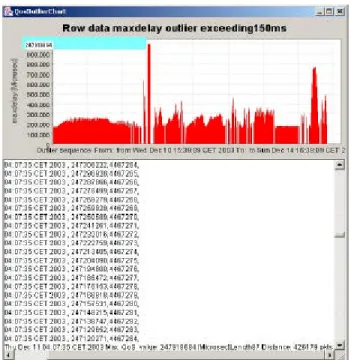
Figure 3: Pattern of end-to-end delay outliers based on aggregated data with threshold 150 ms – flow 255
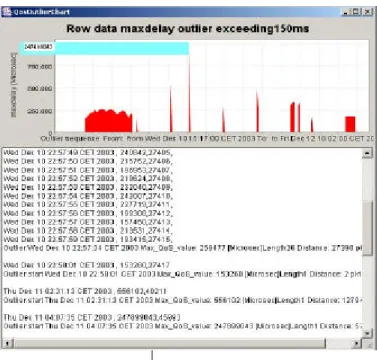
Figure 4: Pattern of end-to-end delay outliers based on aggregated data with threshold 150 ms - flow 273
The figures 3 and 4 show aggregated end-to-end delay
outliers exceeding 150 ms as detected by measurements
on the same connections for same 2 days (10
thand 11
thof
December 2003) with different granularity of
measurement intervals i.e. flow 255 interval of 1 sec and
flow 273 – interval of 20 ms. It is obvious that, using
smaller intervals of measurements, much more outliers
are detected for the same period than using greater
intervals. The outlier detection depends on the
measurement interval and this should be considered in
the fault management strategies.
For analysis of the sources of the extreme outlier of 4
minutes end-to-end delay, we checked with the global
outlier analysis interface also other real measured data
for connections Sao Paulo (Brazil) – Salzburg (Austria)
which is much more unreliable than the connection
Madrid-Salzburg and found that such great outliers do
not happened.
Using global analysis, we detected also dependencies of
the extreme and-to-end delay outliers and packet loss
bursts. Very closely to the outliers are significant packet
loss bursts which should be further investigated in the
next scenarios using fine grained outlier structure
analysis.
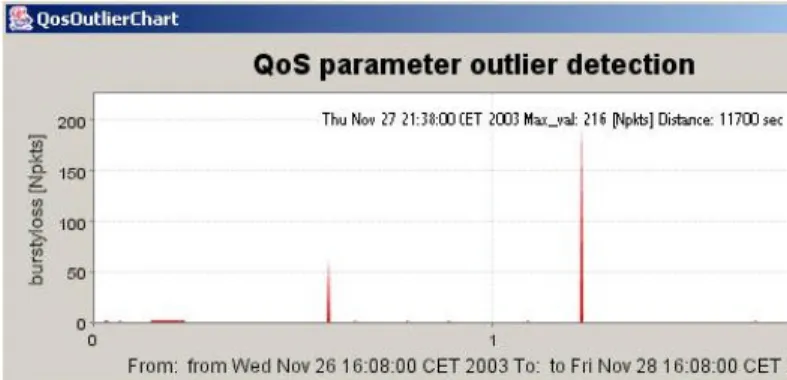
The packet loss bursts considering 2 and more sequenced
packet losses for the different flows with found extreme
delay outliers are given and the packet loss burst found
near the extreme end-to-end delay outlier is marked.
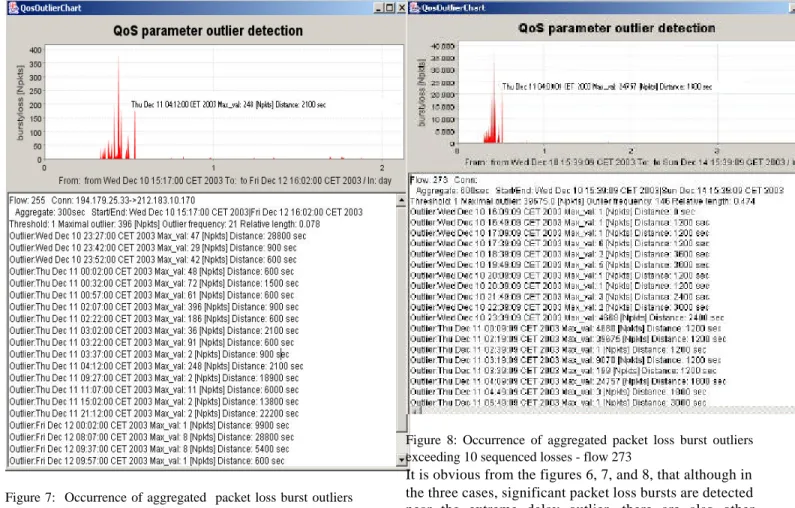
Figure 6: Occurrence of aggregated packet loss burst outliers exceeding 10 sequenced losses – flow 141
Figure 7: Occurrence of aggregated packet loss burst outliers exceeding 10 sequenced losses – flow 255
Figure 8: Occurrence of aggregated packet loss burst outliers exceeding 10 sequenced losses - flow 273
It is obvious from the figures 6, 7, and 8, that although in
the three cases, significant packet loss bursts are detected
near the extreme delay outlier, there are also other
occurrences of packet bursts of such magnitude not
directly related in timely manner with the extreme
outliers over 20000 ms.
Similar to end-to-end delay outlier, the packet loss bursts,
i.e. consecutive packets lost , is dependent on the
granularity of measurement, i.e. time intervals in which it
was measured. Therefore, the packet bursts near to the
delay outlier of 11
thof December measured in the flow
255 are significant smaller, i.e. 248 sequenced packet
losses according 1 second measurement interval,
compared with flow 273 with 24757 packet loss and the
interval of measurement 20 ms. Therefore, packet loss
burst should be considered as measurement metrics for
comparison, when the measurement interval is exactly
given or when instead of consequent losses packets, the
duration of packet loss burst is assumed.
The conclusion of the global outlier analysis of
connection Madrid – Salzburg is that extreme great delay
outliers are specific for this connection and their cause
should be studied related to some events of this
connection.
The analysis of the outliers using the aggregated QoS
parameter data is based on the maximum QoS parameter
values evaluated in the given aggregation interval.
The accuracy of the results depends on the aggregation
interval. If this interval is in the range acceptable for
application quality study, then the usage of outliers based
on aggregated QoS parameter data is preferred because
of the performance benefits looking in smaller sized
tables of the data base.
Further analysis is aimed to provide fine grained outlier
structure detection using per packet QoS parameter
measurement data, i.e. row data.
3.3
Analysis of outlier values distributions
using histogram
Using the outlier data mining tool, it is possible to do a
histogram of the found maximum end-to-end delay
outlier values considering the aggregated or row QoS
parameter values of all measured flows .
We start with histogram based on aggregated QoS
parameter data considering measurements of all flows.
The histogram based on 5 buckets is shown in figure 9:
Figure 9: Histogram of delay outliers over 150 ms of measured flows using aggregated data
The prevailing outliers of the connection assuming
threshold of 150 ms (selected in respect of VoIP
application) are in the bucket range near 150 ms until 400
ms , than there is decrease. Again, starting with very
extreme values there is some increase.
We could obtain more detailed histogram of delay
outliers over 150 ms by selecting greater number of
buckets, as for instance it is shown in figure 10:
Figure 10: Detailed histogram of delay outliers over 150 ms of measured flows using aggregated data
Here is shown based on more detailed analysis the
decreasing number of outliers starting with 400 ms, very
small number in the range of 600-1000 ms and the
increase of outlier occurrence at extreme values.
Interesting is also the study of outliers based on packet
loss and burst packet loss based on aggregated QoS
parameters and global measurement data analysis:.
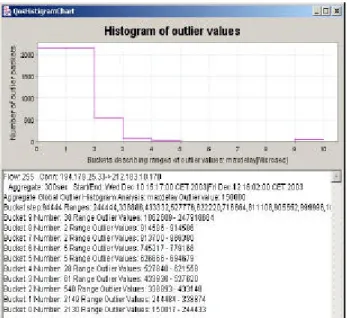
Figure 11 shows the histogram of bursty loss:
Figure 12 shows the packet loss based on aggregated
data:
Figure 12: Histogram of packet loss using aggregated data
There are similarity in the behaviour of the values of
bursty and packet loss. However, there are ranges where
the packet loss is high, but there is no bursty loss, i.e.
there is frequent loss, but not sequenced loss. Here is
again interesting, that extreme values of packet loss and
bursts of losses (i.e. highest burst) are significant.
3.4
End-to-end delay outlier structure analysis
The analysis based on row QoS parameter measurement
data allows to discover:
-
outlier structure : increasing, decreasing , plain
[MHG 03]
-
exact occurrence of outlier
-
exact time interval between outliers.
The outlier analysis based on row QoS parameter
measurement data aggregated data gives insight in exact
structure of the outlier behaviour, but could imply long
data base access times, because of the significant mount
of QoS parameter data per packet.
This analysis is preferred in fault management scenarios
where causes for outlier behaviour should be studied s
well as timely dependencies of outliers.
The next figure gives the end-to-end delay structure
description of the flow 273 with extreme outlier over
200000 ms. Because of the big differences between the
typical outliers ranging from 150 to 600 ms, and the
extreme outlier of 200000 ms, different scales are used
to represent all outliers of the end-to-end connection.
Figure 13: End-to-end delay patterns of outliers of flow 273
The extreme outlier has a string decreasing pattern
over the whole 87 packets building it, i.e. each packet of
this outlier has smaller delay that the preceding packet.
Immediately after the last packet of this outlier there is a
packet loss in time interval comparable with the
end-to-end delay of this outlier with maximum value of
247918684microseonds.
Decreasing outlier structure with dependent packet
loss could be explained with stopping of transmission in
some device (see, [D20] is given the more detailed
explanation.
We found string decreasing and increasing patterns
typical for this flow.
The next figure shows a preceding outlier starting
Thu Dec 11 02:31:13 CET 2003 with Maximum
end-to-end QoS value: 745317 [Microsec] and Length 65, which
has also a strong decreasing pattern over the whole range
of 65 packets.
Figure 14: Decreasing pattern of end-to-end delay outlier found at 02:31
It should be noted that the differences between the
sequenced values in the decreasing patterns are in range
of 8-12 ms.
Traffic patterns of 20 ms between sent packets like
flow 273 are typical only for specific kind of real time
applications like VoIP. Applications requiring services in
more coarser traffic patterns will not experience such
patterns. For this purpose we show the patterns obtained
from flow 255 which was measured every second.
Instead of decreasing pattern in the case of the outliers of
247918684and 745317 [microseconds] maximum value,
the measurement tool has reported only one value in the
two cases. In addition, we could see that a lot of outliers
occurring at the same time and experienced by the fine
grained measurements in flow 273 have not been
experienced in flow 255.
Figure 15: Patterns of end-to-end delay outliers of flow 255
The structure of the outliers of connection 141 is
derived from measurements done in 1 second intervals.
We see therefore small number of outliers. The extreme
end-to-end delay values are experienced with sequence
of decreasing outlier structures (3 outliers).
Figure 16: Outlier end-to-end delay patterns of flow 141
Interesting fact is that besides the extreme outlier there
was only two other small value outliers above 150 ms in
the two day period.
The conclusion from the discussed outliers in the
particular measurements is:
-
outlier detection and patterns depend on the
measurement scale or granularity
-
there are very extreme outliers which occurred at
different time interesting string decreasing
patterns indicating that some event stopped the
transmission.
3.5
Packet loss analysis
The end-to-end delay outlier behaviour could be
compared with packet loss and burst loss patterns
occurred in the corresponding time.
The detailed analysis of packet loss includes:
-
packet loss length patterns
-
patterns describing occurrences between packet
losses
-
detection of specific time intervals of packet
losses in order to relate them to other QoS
parameters like end-to-end delay.
Using the outlier data mining interface of INTERMON
toolkit we could detect all packet losses, their occurrence
(start, end), length of consecutive lost packets, and
distances between the packet losses.
Appendix 5 show the detailed description of packet loss
patterns for the flow 141. We see there is a significant
amount of packet loss with prevailing packet losses of 1
and 2 packets.
In addition there is a relationships between the detected
packet loss the extreme end-to-end delay outliers of flow
141 over 200000 ms. Immediately after the extreme
end-to-end delay outliers are packet losses:
Packet loss: Thu Nov 27 21:31:52 CET 2003 , Thu Nov 27 21:32:01 CET 2003, Length 8pkts Distance: 11430,105852 Packet loss: Thu Nov 27 21:32:01 CET 2003 , Thu Nov 27 21:32:05 CET 2003, Length 3pkts Distance: 1,105856
Packet loss: Thu Nov 27 21:32:05 CET 2003 , Thu Nov 27 21:35:42 CET 2003, Length 216pkts Distance: 1,106073
In order to see the concrete distribution of the packet
losses for this flow, we obtain the histogram of packet
loss lengths:
Figure 17: Packet loss distribution of flow 141
The distances between packet losses are also of interest
and are studied
The next figure shows the outlier structure analysis for
the aggregated QoS parameter data, measured in
November including similar extreme outlier value.
Figure 18: Packet loss distance distribution of flow 141
For comparison of packet loss distributions we look at
the other flows (i.e. 255 and 273), where extreme
end-to-end delay outliers were encountered.
The corresponding packet loss analysis for flow 255 is
given in figure 19:
Figure 19: Packet loss distribution of flow 255
It is shown the prevailing occurrences of small packet
losses, especially packet loss of 1 packet length.
However, there are significant packet losses ranging from
40 sequenced lost packets and over.
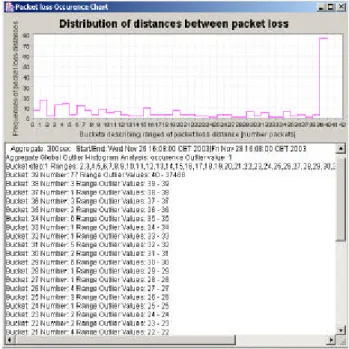
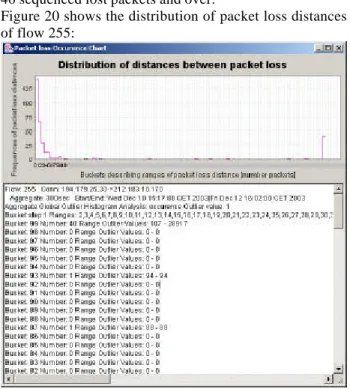
Figure 20 shows the distribution of packet loss distances
of flow 255:
Figure 20: Packet loss distance distribution of flow 255
The buckets are selected to show the numbers of packet
loss distances starting by 1 and increasing the distances
by 1 until 100 packets distance. The figure shows that
the occurrence of packet loss distances decrease rapidly
with increase of distances to 100 packets, and at very
great packet loss distance, the occurrences again increase
The detailed packet loss analysis has also shown that
immediately after the extreme outlier, there was a
significant packet loss. Similar patterns are also shown in
the analysis for flow 273 measured at the same time like
255 , but in much lower time intervals.
4.
Towards efficient analysis of
abnormal QoS behaviour
The analysis of abnormal QoS behaviour by detection
of outliers is a powerful approach which could be used in
different fault management scenarios – detection of QoS
problems caused by link failures, traffic congestion,
inter-domain routing, intrusion and denial of service
attacks. In INTERMON scenarios, we have shown
relationships between end-to-end delay and packet loss
outliers.
Further systematical monitoring and analysis
strategies of end-to-end connections in inter-domain
environment should allow to study dependencies of
discovered QoS outlier patterns and patterns describing
inter-domain routing behaviour, i.e. BGP-4 protocol
patterns.
The important understanding during development of
outlier data mining tools in INTERMON is that more
efficient technologies are needed to store and access the
outlier data. More efficient data base design based on
time series data concepts is required for further reduction
of redundant data storage. For instance, timestamps of
packets sent as time series data in equal intervals should
not be stored. This will reduce stored data and increase
performance.
There is a need for efficient data base for outlier
analysis in spatio-temporal context based on storage of
the abnormal data per end-to-end connections allowing
optimisation of time point and interval queries of outliers.
The spatio-temporal design will reduce the overhead in
the browsing of whole data base to find the flows and
their temporal dependencies belonging to the end-to-end
connection.
Because the outliers are very small portion of the total
measured packets, the data base design should contain
only the outlier packets. The measurement system should
be designed in the way to store the outliers and their
patterns in dedicated data base. Currently, the way to use
real measurement data from cmbase, which is storing all
possible performance information to the sent packets in a
data base is very slow approach in the case of fault
management scenarios where only outlier values are of
interest.
Further research direction on efficient data base
design is consideration of multiple measurement
granularities (scales) [BJW 00] in order to provide
efficient operations to manipulate and query these data
along the temporal dimensions.
5.
Reference
[BJW 00]
C.Bettini, S.Jajodia, S.X.Wang, Time
Granularities in Databases, Data Mining and Temporal
Reasoning, Springer Verlag, ISBN 3540669973, July
2000.
[MAM 03] I. Miloucheva, A. Anzaloni, E. Müller, A
practical approach to forecast Quality of Service
parameters considering outliers, First international
workshop on Inter-domain performance and simulation,
IPS 2003, Salzburg 20-21 February.
[D20] Evaluation of visual data mining, INTERMON
Deliverable D20
Appendix 1: Global end-to-end delay outliers
in cmbase for the flows of Madrid-Salzburg
obtain for aggregated QoS parameter data
Flow: 137 Conn: 194.179.25.33->212.183.10.170 Aggregate: 300sec
Start/End: Tue Nov 18 16:08:00 CET 2003|Thu Nov 20 16:08:00 CET 2003
Outlier: Maximal outlier: 290399.0 [microseconds] Outlier frequency: 6 Relative length: 0.011111111
Outlier: :Tue Nov 18 16:13:00 CET 2003 Max_QoS_value: 290399.0 [microseconds] Distance: 0 sec
Outlier: :Tue Nov 18 18:23:00 CET 2003 Max_QoS_value: 251555.0 [microseconds] Distance: 7800 sec
Outlier: :Wed Nov 19 08:03:00 CET 2003 Max_QoS_value: 241807.0 [microseconds] Distance: 49200 sec
Outlier: :Wed Nov 19 13:58:00 CET 2003 Max_QoS_value: 182485.0 [microseconds] Distance: 21300 sec
Outlier: :Wed Nov 19 18:08:00 CET 2003 Max_QoS_value: 155468.0 [microseconds] Distance: 15000 sec
Outlier: :Thu Nov 20 12:53:00 CET 2003 Max_QoS_value: 290399.0 [microseconds] Distance: 67500 sec
Flow: 140 Conn: 194.179.25.33->212.183.10.170 Aggregate: 300sec
Start/End: Mon Nov 24 16:28:00 CET 2003|Wed Nov 26 16:08:00 CET 2003
Outlier: Maximal outlier: 391841.0 [microseconds] Outlier frequency: 5 Relative length: 0.0088495575
Outlier: :Mon Nov 24 19:48:00 CET 2003 Max_QoS_value: 158323.0 [microseconds] Distance: 11700 sec
Outlier: :Tue Nov 25 08:38:00 CET 2003 Max_QoS_value: 172103.0 [microseconds] Distance: 46200 sec
Outlier: :Tue Nov 25 15:03:00 CET 2003 Max_QoS_value: 391841.0 [microseconds] Distance: 23100 sec
Outlier: :Wed Nov 26 10:13:00 CET 2003 Max_QoS_value: 340329.0 [microseconds] Distance: 69000 sec
Outlier: :Wed Nov 26 12:33:00 CET 2003 Max_QoS_value: 178529.0 [microseconds] Distance: 8400 sec
Flow: 150 Conn: 194.179.25.33->212.183.10.170 Aggregate: 300sec
Start/End: Mon Nov 24 16:20:00 CET 2003|Wed Nov 26 16:20:00 CET 2003
Outlier: Maximal outlier: 397789.0 [microseconds] Outlier frequency: 6 Relative length: 0.010507881
Outlier: :Tue Nov 25 08:35:00 CET 2003 Max_QoS_value: 171421.0 [microseconds] Distance: 58200 sec
Outlier: :Tue Nov 25 13:05:00 CET 2003 Max_QoS_value: 201746.0 [microseconds] Distance: 16200 sec
Outlier: :Wed Nov 26 07:50:00 CET 2003 Max_QoS_value: 184903.0 [microseconds] Distance: 67500 sec
Outlier: :Wed Nov 26 09:40:00 CET 2003 Max_QoS_value: 397789.0 [microseconds] Distance: 6600 sec
Outlier: :Wed Nov 26 10:10:00 CET 2003 Max_QoS_value: 339292.0 [microseconds] Distance: 1800 sec
Outlier: :Wed Nov 26 10:50:00 CET 2003 Max_QoS_value: 256037.0 [microseconds] Distance: 2400 sec
Flow: 154 Conn: 212.183.10.170->194.179.25.33 Aggregate: 1800sec
Start/End: Tue Nov 25 10:00:00 CET 2003|Thu Nov 27 10:00:00 CET 2003
Outlier: Maximal outlier: 336103.0 [microseconds] Outlier frequency: 11 Relative length: 0.23958333
Outlier: :Tue Nov 25 13:00:00 CET 2003 Max_QoS_value: 256065.0 [microseconds] Distance: 5400 sec
Outlier: :Tue Nov 25 17:00:00 CET 2003 Max_QoS_value: 194816.0 [microseconds] Distance: 14400 sec
Outlier: :Tue Nov 25 20:00:00 CET 2003 Max_QoS_value: 160585.0 [microseconds] Distance: 10800 sec
Outlier: :Wed Nov 26 03:00:00 CET 2003 Max_QoS_value: 154343.0 [microseconds] Distance: 25200 sec
Outlier: :Wed Nov 26 13:30:00 CET 2003 Max_QoS_value: 336103.0 [microseconds] Distance: 21600 sec
Outlier: :Wed Nov 26 15:30:00 CET 2003 Max_QoS_value: 225889.0 [microseconds] Distance: 7200 sec
Outlier: :Wed Nov 26 17:30:00 CET 2003 Max_QoS_value: 165682.0 [microseconds] Distance: 5400 sec
Outlier: :Wed Nov 26 22:30:00 CET 2003 Max_QoS_value: 165681.0 [microseconds] Distance: 18000 sec
Outlier: :Thu Nov 27 03:30:00 CET 2003 Max_QoS_value: 172253.0 [microseconds] Distance: 18000 sec
Outlier: :Thu Nov 27 05:00:00 CET 2003 Max_QoS_value: 248508.0 [microseconds] Distance: 5400 sec
Outlier: :Thu Nov 27 07:00:00 CET 2003 Max_QoS_value: 159371.0 [microseconds] Distance: 7200 sec
Flow: 151 Conn: 194.179.25.33->212.183.10.170 Aggregate: 1800sec
Start/End: Tue Nov 25 10:00:00 CET 2003|Thu Nov 27 10:00:00 CET 2003
Outlier: Maximal outlier: 475116.0 [microseconds] Outlier frequency: 1 Relative length: 0.010416667
Outlier: :Wed Nov 26 15:30:00 CET 2003 Max_QoS_value: 475116.0 [microseconds] Distance: 104400 sec
Flow: 141 Conn: 194.179.25.33->212.183.10.170 Aggregate: 300sec
Start/End: Wed Nov 26 16:08:00 CET 2003|Fri Nov 28 16:08:00 CET 2003
Outlier: Maximal outlier: 2.32803424E8 [microseconds] Outlier frequency: 3 Relative length: 0.006932409
Outlier: :Thu Nov 27 08:03:00 CET 2003 Max_QoS_value: 188597.0 [microseconds] Distance: 57000 sec
Outlier: :Thu Nov 27 12:03:00 CET 2003 Max_QoS_value: 272219.0 [microseconds] Distance: 14400 sec
Outlier: :Thu Nov 27 21:38:00 CET 2003 Max_QoS_value: 2.32803424E8 [microseconds] Distance: 34200 sec
Flow: 237 Conn: Aggregate: 1800sec
Start/End: Mon Dec 01 10:00:00 CET 2003|Wed Dec 03 09:59:00 CET 2003
Outlier: Maximal outlier: 220143.0 [microseconds] Outlier frequency: 2 Relative length: 0.04761905
Outlier: :Mon Dec 01 11:30:00 CET 2003 Max_QoS_value: 220143.0 [microseconds] Distance: 3600 sec
Outlier: :Tue Dec 02 05:30:00 CET 2003 Max_QoS_value: 176225.0 [microseconds] Distance: 64800 sec
Flow: 143 Conn: 194.179.25.33->212.183.10.170 Aggregate: 300sec Start/End: Sun Nov 30 16:08:00 CET 2003|Tue Dec 02 16:08:00 CET 2003
Outlier: Maximal outlier: 202102.0 [microseconds] Outlier frequency: 1 Relative length: 0.022222223
Outlier: :Sun Nov 30 19:33:00 CET 2003 Max_QoS_value: 202102.0 [microseconds] Distance: 12000 sec
Flow: 144 Conn: 194.179.25.33->212.183.10.170 Aggregate: 300sec Start/End: Tue Dec 02 16:08:00 CET 2003|Thu Dec 04 16:08:00 CET 2003
Outlier: Maximal outlier: 576339.0 [microseconds] Outlier frequency: 3 Relative length: 0.005376344
Outlier: :Wed Dec 03 06:28:00 CET 2003 Max_QoS_value: 159294.0 [microseconds] Distance: 51300 sec
Outlier: :Wed Dec 03 09:08:00 CET 2003 Max_QoS_value: 208690.0 [microseconds] Distance: 9600 sec
Outlier: :Wed Dec 03 14:08:00 CET 2003 Max_QoS_value: 576339.0 [microseconds] Distance: 18000 sec
Flow: 255 Conn: 194.179.25.33->212.183.10.170 Aggregate: 300sec Start/End: Wed Dec 10 15:17:00 CET 2003|Fri Dec 12 16:02:00 CET 2003
Outlier: Maximal outlier: 2.4789904E8 [microseconds] Outlier frequency: 8 Relative length: 0.013651877
Outlier: :Wed Dec 10 22:57:00 CET 2003 Max_QoS_value: 259477.0 [microseconds] Distance: 27300 sec
Outlier: :Thu Dec 11 02:32:00 CET 2003 Max_QoS_value: 556102.0 [microseconds] Distance: 12900 sec
Outlier: :Thu Dec 11 04:07:00 CET 2003 Max_QoS_value: 2.4789904E8 [microseconds] Distance: 5700 sec
Outlier: :Thu Dec 11 09:27:00 CET 2003 Max_QoS_value: 301532.0 [microseconds] Distance: 19200 sec
Outlier: :Thu Dec 11 13:22:00 CET 2003 Max_QoS_value: 489872.0 [microseconds] Distance: 14100 sec
Outlier: :Thu Dec 11 18:22:00 CET 2003 Max_QoS_value: 338081.0 [microseconds] Distance: 18000 sec
Outlier: :Thu Dec 11 18:32:00 CET 2003 Max_QoS_value: 167544.0 [microseconds] Distance: 600 sec
Outlier: :Thu Dec 11 23:02:00 CET 2003 Max_QoS_value: 173614.0 [microseconds] Distance: 16200 sec
Flow: 256 Conn: 194.179.25.33->212.183.10.170 Aggregate: 300sec Start/End: Fri Dec 12 16:02:00 CET 2003|Sun Dec 14 16:02:00 CET 2003
Outlier: Maximal outlier: 764014.0 [microseconds] Outlier frequency: 3 Relative length: 0.006932409
Outlier: :Sat Dec 13 15:27:00 CET 2003 Max_QoS_value: 196309.0 [microseconds] Distance: 84000 sec
Outlier: :Sat Dec 13 22:57:00 CET 2003 Max_QoS_value: 764014.0 [microseconds] Distance: 26700 sec
Outlier: :Sat Dec 13 23:57:00 CET 2003 Max_QoS_value: 459266.0 [microseconds] Distance: 3600 sec
Flow: 257 Conn: 194.179.25.33->212.183.10.170 Aggregate: 300sec Start/End: Sun Dec 14 16:02:00 CET 2003|Tue Dec 16 16:02:00 CET 2003
Outlier: Maximal outlier: 198579.0 [microseconds] Outlier frequency: 1 Relative length: 0.0032894737
Outlier: :Mon Dec 15 14:22:00 CET 2003 Max_QoS_value: 198579.0 [microseconds] Distance: 80100 sec
Flow: 260 Conn: 194.179.25.33->212.183.10.170 Aggregate: 300sec Start/End: Sat Dec 20 16:02:00 CET 2003|Mon Dec 22 16:02:00 CET 2003
Outlier: Maximal outlier: 350332.0 [microseconds] Outlier frequency: 3 Relative length: 0.0051993066
Outlier: :Mon Dec 22 10:22:00 CET 2003 Max_QoS_value: 170829.0 [microseconds] Distance: 152100 sec
Outlier: :Mon Dec 22 11:17:00 CET 2003 Max_QoS_value: 350332.0 [microseconds] Distance: 3300 sec
Outlier: :Mon Dec 22 11:52:00 CET 2003 Max_QoS_value: 204140.0 [microseconds] Distance: 2100 sec
Flow: 273 Conn: Aggregate: 600sec Start/End: Wed Dec 10 15:39:09 CET 2003|Sun Dec 14 15:39:09 CET 2003Outlier: 150000 Maximal outlier: 2.47918688E8 [microseconds] Outlier frequency: 28 Relative length: 0.058925476
Outlier:Wed Dec 10 22:59:09 CET 2003 Max_QoS_value: 270618.0 [microseconds] Distance: 25800 sec
Outlier:Thu Dec 11 02:29:09 CET 2003 Max_QoS_value: 745317.0 [microseconds] Distance: 12600 sec
Outlier:Thu Dec 11 02:59:09 CET 2003 Max_QoS_value: 191810.0 [microseconds] Distance: 1800 sec
Outlier:Thu Dec 11 04:09:09 CET 2003 Max_QoS_value: 2.47918688E8 [microseconds] Distance: 4200 sec Outlier:Thu Dec 11 05:49:09 CET 2003 Max_QoS_value: 280604.0 [microseconds] Distance: 6000 sec
Outlier:Thu Dec 11 07:29:09 CET 2003 Max_QoS_value: 188281.0 [microseconds] Distance: 6000 sec
Outlier:Thu Dec 11 08:29:09 CET 2003 Max_QoS_value: 175063.0 [microseconds] Distance: 3600 sec
Outlier:Thu Dec 11 08:59:09 CET 2003 Max_QoS_value: 445469.0 [microseconds] Distance: 1800 sec
Outlier:Thu Dec 11 09:29:09 CET 2003 Max_QoS_value: 195122.0 [microseconds] Distance: 1800 sec
Outlier:Thu Dec 11 10:29:09 CET 2003 Max_QoS_value: 242520.0 [microseconds] Distance: 3600 sec
Outlier:Thu Dec 11 11:29:09 CET 2003 Max_QoS_value: 176251.0 [microseconds] Distance: 3600 sec
Outlier:Thu Dec 11 13:49:09 CET 2003 Max_QoS_value: 462444.0 [microseconds] Distance: 7800 sec
Outlier:Thu Dec 11 14:09:09 CET 2003 Max_QoS_value: 378038.0 [microseconds] Distance: 1200 sec
Outlier:Thu Dec 11 15:09:09 CET 2003 Max_QoS_value: 395292.0 [microseconds] Distance: 1800 sec
Outlier:Thu Dec 11 15:49:09 CET 2003 Max_QoS_value: 421556.0 [microseconds] Distance: 2400 sec
Outlier:Thu Dec 11 17:49:09 CET 2003 Max_QoS_value: 241061.0 [microseconds] Distance: 6600 sec
Outlier:Thu Dec 11 18:19:09 CET 2003 Max_QoS_value: 369970.0 [microseconds] Distance: 1800 sec
Outlier:Thu Dec 11 18:39:09 CET 2003 Max_QoS_value: 207128.0 [microseconds] Distance: 1200 sec
Outlier:Thu Dec 11 22:59:09 CET 2003 Max_QoS_value: 182890.0 [microseconds] Distance: 15600 sec
Outlier:Fri Dec 12 08:59:09 CET 2003 Max_QoS_value: 193584.0 [microseconds] Distance: 36000 sec
Outlier:Fri Dec 12 09:29:09 CET 2003 Max_QoS_value: 187641.0 [microseconds] Distance: 1800 sec
Outlier:Fri Dec 12 10:39:09 CET 2003 Max_QoS_value: 388580.0 [microseconds] Distance: 4200 sec
Outlier:Fri Dec 12 13:49:09 CET 2003 Max_QoS_value: 321796.0 [microseconds] Distance: 11400 sec
Outlier:Fri Dec 12 14:39:09 CET 2003 Max_QoS_value: 163630.0 [microseconds] Distance: 3000 sec
Outlier:Fri Dec 12 15:39:09 CET 2003 Max_QoS_value: 271728.0 [microseconds] Distance: 3600 sec
Outlier:Fri Dec 12 16:49:09 CET 2003 Max_QoS_value: 211482.0 [microseconds] Distance: 4200 sec
Outlier:Sat Dec 13 22:59:09 CET 2003 Max_QoS_value: 768346.0 [microseconds] Distance: 108000 sec
Outlier:Sat Dec 13 23:59:09 CET 2003 Max_QoS_value: 516283.0 [microseconds] Distance: 3600 sec
Appendix 2 : Global outlie r analysis
Madrid-Salzburg and Brazil-Madrid-Salzburg based on
aggregated data for minimum end-to-end
delay outlier
Global Outlier Analysis: mindelayOutlier value:150000 Flow: 9 Conn: 194.179.25.33->195.3.85.134 Aggregate: 300sec
Start/End: Tue Jul 29 11:54:00 CEST 2003|Thu Jul 31 11:54:00 CEST 2003
Outlier: Maximal outlier: 25629716 [Microsec] Outlier frequency: 1 Relative length: 0.833
Outlier:Tue Jul 29 13:09:00 CEST 2003 Max_val: 25629716 [Microsec] Distance: 0 sec
Flow: 10 Conn: 161.24.3.26->195.3.85.134 Aggregate: 300sec Start/End: Tue Jul 29 11:54:00 CEST 2003|Thu Jul 31 11:54:00 CEST 2003
Outlier: Maximal outlier: 578802 [Microsec] Outlier frequency: 3 Relative length: 0.168
Outlier:Tue Jul 29 12:24:00 CEST 2003 Max_val: 578802 [Microsec] Distance: 0 sec
Outlier:Tue Jul 29 14:29:00 CEST 2003 Max_val: 219948 [Microsec] Distance: 6600 sec
Outlier:Tue Jul 29 15:29:00 CEST 2003 Max_val: 468756 [Microsec] Distance: 2700 sec
Flow: 49 Conn: 161.24.3.26->195.3.85.134 Aggregate: 300sec Start/End: Wed Aug 13 16:22:00 CEST 2003|Thu Aug 14 16:22:00 CEST 2003
Outlier: Maximal outlier: 161990 [Microsec] Outlier frequency: 7 Relative length: 0.294
Outlier:Wed Aug 13 17:12:00 CEST 2003 Max_val: 161004 [Microsec] Distance: 0 sec
Outlier:Wed Aug 13 18:32:00 CEST 2003 Max_val: 150554 [Microsec] Distance: 4800 sec
Outlier:Wed Aug 13 18:52:00 CEST 2003 Max_val: 150771 [Microsec] Distance: 1200 sec
Outlier:Wed Aug 13 19:07:00 CEST 2003 Max_val: 150492 [Microsec] Distance: 600 sec
Outlier:Wed Aug 13 19:37:00 CEST 2003 Max_val: 155308 [Microsec] Distance: 600 sec
Outlier:Wed Aug 13 20:07:00 CEST 2003 Max_val: 158022 [Microsec] Distance: 600 sec
Outlier:Thu Aug 14 01:17:00 CEST 2003 Max_val: 161990 [Microsec] Distance: 600 sec
Flow: 43 Conn: 161.24.3.26->195.3.85.134 Aggregate: 300sec Start/End: Thu Aug 14 16:17:00 CEST 2003|Fri Aug 15 16:17:00 CEST 2003
Outlier: Maximal outlier: 169060 [Microsec] Outlier frequency: 7 Relative length: 0.823
Outlier:Thu Aug 14 16:52:00 CEST 2003 Max_val: 159085 [Microsec] Distance: 0 sec
Outlier:Thu Aug 14 18:32:00 CEST 2003 Max_val: 154566 [Microsec] Distance: 3300 sec
Outlier:Thu Aug 14 20:52:00 CEST 2003 Max_val: 161497 [Microsec] Distance: 2400 sec
Outlier:Thu Aug 14 21:32:00 CEST 2003 Max_val: 154828 [Microsec] Distance: 600 sec
Outlier:Thu Aug 14 21:42:00 CEST 2003 Max_val: 150149 [Microsec] Distance: 600 sec
Outlier:Fri Aug 15 02:27:00 CEST 2003 Max_val: 168441 [Microsec] Distance: 2100 sec
Outlier:Fri Aug 15 14:42:00 CEST 2003 Max_val: 169060 [Microsec] Distance: 2100 sec
Flow: 93 Conn: 161.24.3.26->195.3.85.134 Aggregate: 120sec Start/End: Tue Sep 09 18:13:00 CEST 2003|Thu Sep 11 18:13:00 CEST 2003
Outlier: Maximal outlier: 207280 [Microsec] Outlier frequency: 1 Relative length: 6.939
Outlier:Thu Sep 11 05:37:00 CEST 2003 Max_val: 207280 [Microsec] Distance: 127320 sec
Flow: 94 Conn: 161.24.3.26->195.3.85.134 Aggregate: 120sec Start/End: Thu Sep 11 18:13:00 CEST 2003|Sat Sep 13 18:13:00 CEST 2003
Outlier: Maximal outlier: 182231 [Microsec] Outlier frequency: 6 Relative length: 0.077
Outlier:Fri Sep 12 07:29:00 CEST 2003 Max_val: 177957 [Microsec] Distance: 47040 sec
Outlier:Fri Sep 12 08:43:00 CEST 2003 Max_val: 179292 [Microsec] Distance: 360 sec
Outlier:Fri Sep 12 09:05:00 CEST 2003 Max_val: 179517 [Microsec] Distance: 240 sec
Outlier:Fri Sep 12 10:35:00 CEST 2003 Max_val: 182231 [Microsec] Distance: 360 sec
Outlier:Fri Sep 12 10:57:00 CEST 2003 Max_val: 181579 [Microsec] Distance: 360 sec
Outlier:Fri Sep 12 11:15:00 CEST 2003 Max_val: 180652 [Microsec] Distance: 240 sec
Appendix 3 : Maximum end-to-end delay
outlier values over 150 ms for connection
Brazil-Salzburg based on aggregated data
Flow: 5 Conn: 161.24.3.26->195.3.85.134 Aggregate: 300sec Start/End: Fri Jul 25 09:31:00 CEST 2003|Fri Jul 25 11:31:00 CEST 2003Outlier: Maximal outlier: 242425 [Microsec] Outlier frequency: 2 Relative length: 0.48
Outlier:Fri Jul 25 10:16:00 CEST 2003 Max_val: 242425 [Microsec] Distance: 0 sec
Outlier:Fri Jul 25 10:36:00 CEST 2003 Max_val: 234303 [Microsec] Distance: 600 sec
Flow: 6 Conn: 161.24.3.26->195.3.85.134 Aggregate: 300sec Start/End: Fri Jul 25 11:35:00 CEST 2003|Mon Jul 28 11:35:00 CEST 2003
Outlier: Maximal outlier: 211883 [Microsec] Outlier frequency: 2 Relative length: 0.018
Outlier:Fri Jul 25 11:50:00 CEST 2003 Max_val: 211883 [Microsec] Distance: 0 sec
Outlier:Fri Jul 25 12:10:00 CEST 2003 Max_val: 183677 [Microsec] Distance: 1200 sec
Flow: 10 Conn: 161.24.3.26->195.3.85.134 Aggregate: 300sec Start/End: Tue Jul 29 11:54:00 CEST 2003|Thu Jul 31 11:54:00 CEST 2003
Outlier: Maximal outlier: 694679 [Microsec] Outlier frequency: 4 Relative length: 0.253
Outlier:Tue Jul 29 12:29:00 CEST 2003 Max_val: 694679 [Microsec] Distance: 0 sec
Outlier:Tue Jul 29 13:34:00 CEST 2003 Max_val: 471966 [Microsec] Distance: 600 sec
Outlier:Tue Jul 29 13:49:00 CEST 2003 Max_val: 176721 [Microsec] Distance: 900 sec
Outlier:Tue Jul 29 13:59:00 CEST 2003 Max_val: 214221 [Microsec] Distance: 600 sec
Flow: 22 Conn: 161.24.3.26->195.3.85.134 Aggregate: 300sec Start/End: Thu Aug 07 15:36:00 CEST 2003|Fri Aug 08 15:36:00 CEST 2003
Outlier: Maximal outlier: 543194 [Microsec] Outlier frequency: 10 Relative length: 0.799
Outlier:Thu Aug 07 15:56:00 CEST 2003 Max_val: 395935 [Microsec] Distance: 0 sec
Outlier:Fri Aug 08 04:26:00 CEST 2003 Max_val: 512391 [Microsec] Distance: 600 sec
Outlier:Fri Aug 08 07:21:00 CEST 2003 Max_val: 543194 [Microsec] Distance: 600 sec
Outlier:Fri Aug 08 07:36:00 CEST 2003 Max_val: 173874 [Microsec] Distance: 600 sec
Outlier:Fri Aug 08 08:46:00 CEST 2003 Max_val: 268489 [Microsec] Distance: 600 sec
Outlier:Fri Aug 08 09:01:00 CEST 2003 Max_val: 272640 [Microsec] Distance: 900 sec
Outlier:Fri Aug 08 10:31:00 CEST 2003 Max_val: 298619 [Microsec] Distance: 1500 sec
Outlier:Fri Aug 08 11:11:00 CEST 2003 Max_val: 258551 [Microsec] Distance: 600 sec
Outlier:Fri Aug 08 11:41:00 CEST 2003 Max_val: 235443 [Microsec] Distance: 600 sec
Outlier:Fri Aug 08 11:56:00 CEST 2003 Max_val: 248791 [Microsec] Distance: 600 sec
Flow: 41 Conn: 161.24.3.26->195.3.85.134 Aggregate: 300sec Start/End: Mon Aug 11 14:18:00 CEST 2003|Wed Aug 13 14:18:00 CEST 2003
Outlier: Maximal outlier: 459359 [Microsec] Outlier frequency: 8 Relative length: 0.313
Outlier:Mon Aug 11 17:28:00 CEST 2003 Max_val: 459359 [Microsec] Distance: 0 sec
Outlier:Mon Aug 11 17:43:00 CEST 2003 Max_val: 201685 [Microsec] Distance: 900 sec
Outlier:Mon Aug 11 18:03:00 CEST 2003 Max_val: 226041 [Microsec] Distance: 1200 sec
Outlier:Mon Aug 11 18:43:00 CEST 2003 Max_val: 175647 [Microsec] Distance: 2400 sec
Outlier:Mon Aug 11 18:58:00 CEST 2003 Max_val: 191699 [Microsec] Distance: 900 sec
Outlier:Mon Aug 11 19:08:00 CEST 2003 Max_val: 154709 [Microsec] Distance: 600 sec
Outlier:Mon Aug 11 19:38:00 CEST 2003 Max_val: 225459 [Microsec] Distance: 1200 sec
Outlier:Mon Aug 11 20:03:00 CEST 2003 Max_val: 244194 [Microsec] Distance: 1200 sec
Flow: 46 Conn: 161.24.3.26->195.3.85.134 Aggregate: 300sec Start/End: Mon Aug 18 16:17:00 CEST 2003|Wed Aug 20 16:17:00 CEST 2003
Outlier: Maximal outlier: 482491 [Microsec] Outlier frequency: 6 Relative length: 0.922
Outlier:Tue Aug 19 08:47:00 CEST 2003 Max_val: 482491 [Microsec] Distance: 300 sec
Outlier:Tue Aug 19 12:57:00 CEST 2003 Max_val: 275613 [Microsec] Distance: 900 sec
Outlier:Wed Aug 20 01:52:00 CEST 2003 Max_val: 482491 [Microsec] Distance: 1200 sec
Outlier:Wed Aug 20 08:37:00 CEST 2003 Max_val: 407339 [Microsec] Distance: 600 sec
Outlier:Wed Aug 20 11:57:00 CEST 2003 Max_val: 323293 [Microsec] Distance: 600 sec
Outlier:Wed Aug 20 13:42:00 CEST 2003 Max_val: 232107 [Microsec] Distance: 1500 sec
Flow: 93 Conn: 161.24.3.26->195.3.85.134 Aggregate: 120sec Start/End: Tue Sep 09 18:13:00 CEST 2003|Thu Sep 11 18:13:00 CEST 2003
Outlier: Maximal outlier: 456610 [Microsec] Outlier frequency: 94 Relative length: 0.709
Outlier:Wed Sep 10 00:05:00 CEST 2003 Max_val: 375256 [Microsec] Distance: 0 sec
Outlier:Wed Sep 10 00:15:00 CEST 2003 Max_val: 232777 [Microsec] Distance: 240 sec
Outlier:Wed Sep 10 00:19:00 CEST 2003 Max_val: 215010 [Microsec] Distance: 240 sec
Outlier:Wed Sep 10 00:23:00 CEST 2003 Max_val: 152380 [Microsec] Distance: 240 sec
Outlier:Wed Sep 10 00:29:00 CEST 2003 Max_val: 236792 [Microsec] Distance: 240 sec
Outlier:Wed Sep 10 00:43:00 CEST 2003 Max_val: 183341 [Microsec] Distance: 600 sec
Outlier:Wed Sep 10 00:49:00 CEST 2003 Max_val: 303945 [Microsec] Distance: 360 sec
Outlier:Wed Sep 10 00:57:00 CEST 2003 Max_val: 217244 [Microsec] Distance: 480 sec
Outlier:Wed Sep 10 01:05:00 CEST 2003 Max_val: 213509 [Microsec] Distance: 240 sec
Outlier:Wed Sep 10 01:17:00 CEST 2003 Max_val: 303427 [Microsec] Distance: 240 sec
Outlier:Wed Sep 10 01:23:00 CEST 2003 Max_val: 185388 [Microsec] Distance: 240 sec
Outlier:Wed Sep 10 01:35:00 CEST 2003 Max_val: 202521 [Microsec] Distance: 240 sec
Outlier:Wed Sep 10 01:41:00 CEST 2003 Max_val: 210688 [Microsec] Distance: 240 sec
Outlier:Wed Sep 10 02:01:00 CEST 2003 Max_val: 325558 [Microsec] Distance: 240 sec
Outlier:Wed Sep 10 02:51:00 CEST 2003 Max_val: 277623 [Microsec] Distance: 240 sec
Outlier:Wed Sep 10 02:55:00 CEST 2003 Max_val: 153853 [Microsec] Distance: 240 sec
Outlier:Wed Sep 10 04:09:00 CEST 2003 Max_val: 305947 [Microsec] Distance: 240 sec
Outlier:Wed Sep 10 04:19:00 CEST 2003 Max_val: 232099 [Microsec] Distance: 240 sec
Outlier:Wed Sep 10 04:25:00 CEST 2003 Max_val: 190467 [Microsec] Distance: 240 sec
Outlier:Wed Sep 10 04:59:00 CEST 2003 Max_val: 271571 [Microsec] Distance: 480 sec
Outlier:Wed Sep 10 05:17:00 CEST 2003 Max_val: 229729 [Microsec] Distance: 360 sec
Outlier:Wed Sep 10 05:23:00 CEST 2003 Max_val: 263648 [Microsec] Distance: 240 sec
Outlier:Wed Sep 10 05:47:00 CEST 2003 Max_val: 284562 [Microsec] Distance: 240 sec
Outlier:Wed Sep 10 06:11:00 CEST 2003 Max_val: 227645 [Microsec] Distance: 240 sec
Outlier:Wed Sep 10 06:27:00 CEST 2003 Max_val: 227519 [Microsec] Distance: 480 sec
Outlier:Wed Sep 10 06:39:00 CEST 2003 Max_val: 208781 [Microsec] Distance: 600 sec
Outlier:Wed Sep 10 07:35:00 CEST 2003 Max_val: 314760 [Microsec] Distance: 240 sec
Outlier:Wed Sep 10 08:31:00 CEST 2003 Max_val: 262389 [Microsec] Distance: 240 sec
Outlier:Wed Sep 10 08:45:00 CEST 2003 Max_val: 207265 [Microsec] Distance: 360 sec
Outlier:Wed Sep 10 09:03:00 CEST 2003 Max_val: 206825 [Microsec] Distance: 240 sec
Outlier:Wed Sep 10 09:09:00 CEST 2003 Max_val: 220416 [Microsec] Distance: 240 sec
Outlier:Wed Sep 10 09:17:00 CEST 2003 Max_val: 224559 [Microsec] Distance: 240 sec
Outlier:Wed Sep 10 09:21:00 CEST 2003 Max_val: 227686 [Microsec] Distance: 240 sec
Outlier:Wed Sep 10 09:29:00 CEST 2003 Max_val: 233463 [Microsec] Distance: 240 sec
Outlier:Wed Sep 10 09:39:00 CEST 2003 Max_val: 228584 [Microsec] Distance: 600 sec
Outlier:Wed Sep 10 09:43:00 CEST 2003 Max_val: 196516 [Microsec] Distance: 240 sec
Outlier:Wed Sep 10 09:53:00 CEST 2003 Max_val: 229923 [Microsec] Distance: 600 sec
Outlier:Wed Sep 10 10:01:00 CEST 2003 Max_val: 210155 [Microsec] Distance: 240 sec
Outlier:Wed Sep 10 10:09:00 CEST 2003 Max_val: 173181 [Microsec] Distance: 480 sec
Outlier:Wed Sep 10 10:13:00 CEST 2003 Max_val: 185547 [Microsec] Distance: 240 sec
Outlier:Wed Sep 10 10:17:00 CEST 2003 Max_val: 159254 [Microsec] Distance: 240 sec
Outlier:Wed Sep 10 10:21:00 CEST 2003 Max_val: 180304 [Microsec] Distance: 240 sec
Outlier:Wed Sep 10 10:25:00 CEST 2003 Max_val: 168690 [Microsec] Distance: 240 sec
Outlier:Wed Sep 10 10:29:00 CEST 2003 Max_val: 172421 [Microsec] Distance: 240 sec
Outlier:Wed Sep 10 10:35:00 CEST 2003 Max_val: 151299 [Microsec] Distance: 360 sec
Outlier:Wed Sep 10 10:47:00 CEST 2003 Max_val: 209589 [Microsec] Distance: 720 sec
Outlier:Wed Sep 10 11:01:00 CEST 2003 Max_val: 227367 [Microsec] Distance: 360 sec
Outlier:Wed Sep 10 11:11:00 CEST 2003 Max_val: 227219 [Microsec] Distance: 360 sec
Outlier:Wed Sep 10 11:19:00 CEST 2003 Max_val: 150944 [Microsec] Distance: 480 sec
Outlier:Wed Sep 10 11:23:00 CEST 2003 Max_val: 224881 [Microsec] Distance: 240 sec
Outlier:Wed Sep 10 11:45:00 CEST 2003 Max_val: 156096 [Microsec] Distance: 1080 sec
Outlier:Wed Sep 10 23:45:00 CEST 2003 Max_val: 456610 [Microsec] Distance: 1560 sec
Outlier:Thu Sep 11 03:35:00 CEST 2003 Max_val: 342662 [Microsec] Distance: 240 sec
Outlier:Thu Sep 11 05:11:00 CEST 2003 Max_val: 376575 [Microsec] Distance: 240 sec
Outlier:Thu Sep 11 05:23:00 CEST 2003 Max_val: 222615 [Microsec] Distance: 240 sec
Outlier:Thu Sep 11 05:37:00 CEST 2003 Max_val: 207280 [Microsec] Distance: 720 sec
Outlier:Thu Sep 11 06:51:00 CEST 2003 Max_val: 216595 [Microsec] Distance: 4440 sec
Outlier:Thu Sep 11 06:55:00 CEST 2003 Max_val: 196974 [Microsec] Distance: 240 sec
Outlier:Thu Sep 11 07:03:00 CEST 2003 Max_val: 226904 [Microsec] Distance: 240 sec
Outlier:Thu Sep 11 07:17:00 CEST 2003 Max_val: 205817 [Microsec] Distance: 720 sec
Outlier:Thu Sep 11 07:23:00 CEST 2003 Max_val: 188250 [Microsec] Distance: 240 sec
Outlier:Thu Sep 11 07:33:00 CEST 2003 Max_val: 166782 [Microsec] Distance: 600 sec
Outlier:Thu Sep 11 07:43:00 CEST 2003 Max_val: 189671 [Microsec] Distance: 600 sec
Outlier:Thu Sep 11 07:49:00 CEST 2003 Max_val: 185204 [Microsec] Distance: 240 sec
Outlier:Thu Sep 11 07:55:00 CEST 2003 Max_val: 177305 [Microsec] Distance: 360 sec
Outlier:Thu Sep 11 08:03:00 CEST 2003 Max_val: 201196 [Microsec] Distance: 360 sec
Outlier:Thu Sep 11 08:13:00 CEST 2003 Max_val: 207688 [Microsec] Distance: 240 sec
Outlier:Thu Sep 11 08:19:00 CEST 2003 Max_val: 212310 [Microsec] Distance: 360 sec
Outlier:Thu Sep 11 08:25:00 CEST 2003 Max_val: 218479 [Microsec] Distance: 240 sec
Outlier:Thu Sep 11 08:31:00 CEST 2003 Max_val: 222619 [Microsec] Distance: 360 sec
Outlier:Thu Sep 11 08:39:00 CEST 2003 Max_val: 226311 [Microsec] Distance: 360 sec
Outlier:Thu Sep 11 08:57:00 CEST 2003 Max_val: 167776 [Microsec] Distance: 1080 sec
Outlier:Thu Sep 11 09:13:00 CEST 2003 Max_val: 167589 [Microsec] Distance: 960 sec
Outlier:Thu Sep 11 09:17:00 CEST 2003 Max_val: 209222 [Microsec] Distance: 240 sec
Outlier:Thu Sep 11 09:27:00 CEST 2003 Max_val: 183414 [Microsec] Distance: 600 sec
Outlier:Thu Sep 11 09:33:00 CEST 2003 Max_val: 181860 [Microsec] Distance: 240 sec
Outlier:Thu Sep 11 09:43:00 CEST 2003 Max_val: 190147 [Microsec] Distance: 600 sec
Outlier:Thu Sep 11 09:51:00 CEST 2003 Max_val: 199436 [Microsec] Distance: 360 sec
Outlier:Thu Sep 11 10:01:00 CEST 2003 Max_val: 206789 [Microsec] Distance: 360 sec
Outlier:Thu Sep 11 10:07:00 CEST 2003 Max_val: 211655 [Microsec] Distance: 360 sec
Outlier:Thu Sep 11 10:11:00 CEST 2003 Max_val: 215786 [Microsec] Distance: 240 sec
Outlier:Thu Sep 11 10:29:00 CEST 2003 Max_val: 227160 [Microsec] Distance: 600 sec
Outlier:Thu Sep 11 10:55:00 CEST 2003 Max_val: 158060 [Microsec] Distance: 1440 sec
Outlier:Thu Sep 11 11:01:00 CEST 2003 Max_val: 160065 [Microsec] Distance: 360 sec
Outlier:Thu Sep 11 11:07:00 CEST 2003 Max_val: 165266 [Microsec] Distance: 360 sec
Outlier:Thu Sep 11 11:25:00 CEST 2003 Max_val: 180620 [Microsec] Distance: 1080 sec
Outlier:Thu Sep 11 11:31:00 CEST 2003 Max_val: 186818 [Microsec] Distance: 360 sec
Outlier:Thu Sep 11 11:45:00 CEST 2003 Max_val: 196035 [Microsec] Distance: 720 sec
Outlier:Thu Sep 11 11:55:00 CEST 2003 Max_val: 217990 [Microsec] Distance: 480 sec
Outlier:Thu Sep 11 12:01:00 CEST 2003 Max_val: 212216 [Microsec] Distance: 360 sec
Outlier:Thu Sep 11 12:09:00 CEST 2003 Max_val: 222586 [Microsec] Distance: 240 sec
Outlier:Thu Sep 11 12:17:00 CEST 2003 Max_val: 222499 [Microsec] Distance: 480 sec
Outlier:Thu Sep 11 12:21:00 CEST 2003 Max_val: 178551 [Microsec] Distance: 240 sec
Outlier:Thu Sep 11 12:43:00 CEST 2003 Max_val: 343915 [Microsec] Distance: 360 sec
Flow: 94 Conn: 161.24.3.26->195.3.85.134 Aggregate: 120sec Start/End: Thu Sep 11 18:13:00 CEST 2003|Sat Sep 13 18:13:00 CEST 2003
Outlier: Maximal outlier: 1169183 [Microsec] Outlier frequency: 57 Relative length: 0.902
Outlier:Fri Sep 12 00:27:00 CEST 2003 Max_val: 403619 [Microsec] Distance: 0 sec
Outlier:Fri Sep 12 00:31:00 CEST 2003 Max_val: 156559 [Microsec] Distance: 240 sec
Outlier:Fri Sep 12 00:49:00 CEST 2003 Max_val: 243616 [Microsec] Distance: 360 sec
Outlier:Fri Sep 12 11:17:00 CEST 2003 Max_val: 380445 [Microsec] Distance: 240 sec
Outlier:Fri Sep 12 11:25:00 CEST 2003 Max_val: 207751 [Microsec] Distance: 480 sec
Outlier:Fri Sep 12 11:31:00 CEST 2003 Max_val: 209820 [Microsec] Distance: 240 sec
Outlier:Fri Sep 12 11:35:00 CEST 2003 Max_val: 213571 [Microsec] Distance: 240 sec
Outlier:Fri Sep 12 11:39:00 CEST 2003 Max_val: 216986 [Microsec] Distance: 240 sec
Outlier:Fri Sep 12 11:55:00 CEST 2003 Max_val: 231316 [Microsec] Distance: 240 sec
Outlier:Fri Sep 12 12:07:00 CEST 2003 Max_val: 240282 [Microsec] Distance: 360 sec
Outlier:Fri Sep 12 12:15:00 CEST 2003 Max_val: 151365 [Microsec] Distance: 480 sec
Outlier:Fri Sep 12 16:51:00 CEST 2003 Max_val: 349717 [Microsec] Distance: 240 sec
Outlier:Fri Sep 12 17:59:00 CEST 2003 Max_val: 342262 [Microsec] Distance: 240 sec
Outlier:Sat Sep 13 02:19:00 CEST 2003 Max_val: 1169183 [Microsec] Distance: 240 sec
Outlier:Sat Sep 13 02:25:00 CEST 2003 Max_val: 236645 [Microsec] Distance: 240 sec
Outlier:Sat Sep 13 03:47:00 CEST 2003 Max_val: 340821 [Microsec] Distance: 360 sec
Outlier:Sat Sep 13 05:39:00 CEST 2003 Max_val: 533454 [Microsec] Distance: 720 sec
Outlier:Sat Sep 13 07:13:00 CEST 2003 Max_val: 397589 [Microsec] Distance: 360 sec
Outlier:Sat Sep 13 07:51:00 CEST 2003 Max_val: 566041 [Microsec] Distance: 360 sec
Outlier:Sat Sep 13 07:57:00 CEST 2003 Max_val: 209258 [Microsec] Distance: 240 sec
Outlier:Sat Sep 13 08:51:00 CEST 2003 Max_val: 417103 [Microsec] Distance: 240 sec
Outlier:Sat Sep 13 08:55:00 CEST 2003 Max_val: 231810 [Microsec] Distance: 240 sec
Outlier:Sat Sep 13 08:59:00 CEST 2003 Max_val: 150017 [Microsec] Distance: 240 sec
Outlier:Sat Sep 13 09:09:00 CEST 2003 Max_val: 394351 [Microsec] Distance: 600 sec
Outlier:Sat Sep 13 09:17:00 CEST 2003 Max_val: 162461 [Microsec] Distance: 360 sec
Outlier:Sat Sep 13 09:31:00 CEST 2003 Max_val: 217142 [Microsec] Distance: 240 sec
Outlier:Sat Sep 13 09:55:00 CEST 2003 Max_val: 241499 [Microsec] Distance: 240 sec
Outlier:Sat Sep 13 10:03:00 CEST 2003 Max_val: 195340 [Microsec] Distance: 240 sec
Outlier:Sat Sep 13 10:09:00 CEST 2003 Max_val: 203958 [Microsec] Distance: 240 sec
Outlier:Sat Sep 13 10:15:00 CEST 2003 Max_val: 204215 [Microsec] Distance: 240 sec
Outlier:Sat Sep 13 10:23:00 CEST 2003 Max_val: 208569 [Microsec] Distance: 480 sec
Outlier:Sat Sep 13 10:27:00 CEST 2003 Max_val: 162852 [Microsec] Distance: 240 sec
Outlier:Sat Sep 13 10:35:00 CEST 2003 Max_val: 223583 [Microsec] Distance: 480 sec
Outlier:Sat Sep 13 10:41:00 CEST 2003 Max_val: 225079 [Microsec] Distance: 240 sec
Outlier:Sat Sep 13 10:45:00 CEST 2003 Max_val: 224631 [Microsec] Distance: 240 sec
Outlier:Sat Sep 13 10:53:00 CEST 2003 Max_val: 232492 [Microsec] Distance: 480 sec
Outlier:Sat Sep 13 10:57:00 CEST 2003 Max_val: 235261 [Microsec] Distance: 240 sec