This Research has been prepared and issued by BBY Ltd and remains the property of BBY Ltd. No material contained in this Research may be reproduced or distributed without prior written approval of BBY, except as allowed by the Copyright Act. This Research is current at the date of publishing. For updates or further information regarding this research, please contact your advisor. BBY does or seeks to undertake business with companies covered in its research and therefore, Investors should consider this report as only a single factor in making their investment decisions. For explanations regarding ratings and other important disclosures, please refer to the disclosure section at the end of this document.
Background and Introduction
Self-Managed Superannuation Funds (SMSFs) are the fastest growing sector of the
superannuation industry, increasing by 78% since 2009, to be worth an estimated $558
billion at last count (Australian Tax Office (ATO) SMSF report - March 2014).
According to The
Interim Murray Committee Report on the Financial System (Part 1)
released in July 2014:
“
A number of submissions highlight the benefits of SMSFs to individuals and the
superannuation system. SMSFs deliver members greater flexibility and control, because
members can tailor their investments to suit their individual needs. Several stakeholders
say this is often the main motivation of people participating in SMSFs.
Other drivers of the growth in SMSFs include perceived or actual lower fees and better tax
outcomes. The growing number of SMSFs may be a positive sign that more Australians
are actively engaging with their retirement savings.
Several submissions note that SMSFs provide a source of competition to APRA-regulated
funds.
Industry and retail funds have expanded their range of products in response
to the growth in SMSFs
and also provide administrative services to them.”
This is particularly true with regard to the Listed Investment Companies (LICs) space. Both
the popularity and the number of LICs have continued to increase.
Our last report in May 2014 reviewed 30 LICS. Since then 8 new LICs have listed on the
ASX and at least 3 are in the process of raising capital.
We have also seen record capital raisings from new LICs: Future Generation Fund (FGX)
and QV Equities Limited (QVE).
In this report we provide an update on 43 LICs: 34 domestic; and 9 global
.
From the 43 LICs reviewed, we placed BUY recommendations on 9 companies. These are
(in alphabetical order): Australian Leaders Fund (ALF); Cadence Capital Limited (CDM);
Carlton Investments Limited (CIN); Contango Microcap (CTN); Diversified United
Investment Limited (DUI); Mirrabooka Investments Limited (MIR); Naos Emerging
Opportunities Company Limited (NCC); Ozgrowth Limited (OZG); and Westoz Investment
Company Limited (WIC).
The market capitalisations of Australian-listed LICs now exceed $24.2 billion (1.53% of the
ASX), with many more in the pipeline to be listed on the ASX.
$24.2 billion equates to just 4.3% of the $558 billion SMSF market.
Russell Wright
Director, Industrials
Research
rxw@bby.com.au
Tel +612 9226 0091
David Menz
Research Assistant
Listed Investment
Companies (LICs)
Company profiles of the Listed Investment Companies mentioned are attached at the end of this
document.
Code Company Price ($) Current Target Recommendation Previous Target Previous
23/09/2014 Price ($) Price ($) Recommendation
ABW Aurora Absolute Return Fund 1.04 1.04 UNDERPERFORM
ACQ Acorn Capital Investment Fund Limited 0.88 0.94 UNDERPERFORM
AFI Australian Foundation Investment Company Limited 6.03 6.01 UNDERPERFORM 5.86 UNDERPERFORM
AGF AMP Capital China Growth Fund 0.77 0.82 UNDERPERFORM 0.76 UNDERPERFORM
ALF Australian Leaders Fund Limited 1.63 1.63 BUY 1.69 BUY
AMH AMCIL Limited 0.93 0.93 UNDERPERFORM 0.93 UNDERPERFORM
AOD Aurora Dividend Income Trust (Managed Fund) 0.98 0.98 UNDERPERFORM
ARG Argo Investments Limited 7.80 7.69 UNDERPERFORM 7.27 UNDERPERFORM
AUI Australian United Investment Company Limited 8.50 8.67 UNDERPERFORM 8.32 UNDERPERFORM AUP Aurora Property Buy-Write Income Trust 5.37 5.44 UNDERPERFORM
BAF Blue Sky Alternatives Access Fund Limited 0.96 0.96 UNDERPERFORM
BKI BKI Investment Company Limited 1.59 1.63 UNDERPERFORM 1.63 UNDERPERFORM
BST Barrack St Investments Limited 1.00 0.98 UNDERPERFORM
CAM Clime Capital Limited 0.97 1.03 UNDERPERFORM 1.03 UNDERPERFORM
CDM Cadence Capital Limited 1.39 1.43 BUY 1.44 BUY
CIN Carlton Investments Limited 28.00 31.02 BUY 29.47 BUY
CTN Contango Microcap Limited 1.12 1.32 BUY 1.24 BUY
CYA Century Australia Investments Limited 0.88 0.91 UNDERPERFORM 0.91 UNDERPERFORM
DJW Djerriwarrh Investments Limited 4.63 4.20 UNDERPERFORM 4.19 UNDERPERFORM
DUI Diversified United Investment Limited 3.67 3.91 BUY 3.76 BUY
EGI Ellerston Global Investments
-EMF Emerging Markets Masters Fund 1.71 1.67 UNDERPERFORM 1.58 UNDERPERFORM
FGX Future Generation Investment Fund Limited 1.04 1.01 UNDERPERFORM
FSI Flagship Investments Limited 1.53 1.80 UNDERPERFORM 1.69 UNDERPERFORM
GWP Global Wealth Partners 1.25
HHV Hunter Hall Global Value Limited 1.13 1.20 UNDERPERFORM 1.09 UNDERPERFORM
MFF Magellan Flagship Fund Limited 1.49 1.49 UNDERPERFORM 1.46 UNDERPERFORM
MIR Mirrabooka Investments Limited 2.59 2.59 BUY 2.51 UNDERPERFORM
MLT Milton Corporation Limited 4.39 4.40 UNDERPERFORM 4.35 UNDERPERFORM
NAC NAOS Absolute Opportunities Fund 1.00
NCC NAOS Emerging Opportunities Company Limited 1.10 1.20 BUY 1.24 BUY
OZG Ozgrowth Limited 0.20 0.24 BUY 0.24 BUY
PAF PM Capital Asian Opportunities Fund Limited 0.93 0.95 UNDERPERFORM PGF PM Capital Global Opportunities Fund Limited 0.95 0.95 UNDERPERFORM
PMC Platinum Capital Limited 1.81 1.65 UNDERPERFORM 1.65 UNDERPERFORM
QVE QV Equities Limited 0.96 1.00 UNDERPERFORM
SNC Sandon Capital Investments Limited 0.97 1.00 UNDERPERFORM
TGG Templeton Global Growth Fund Limited 1.40 1.39 UNDERPERFORM 1.32 UNDERPERFORM
WAM WAM Capital Limited 1.98 1.91 UNDERPERFORM 1.86 UNDERPERFORM
WAX WAM Research Limited 1.18 1.16 UNDERPERFORM 1.12 UNDERPERFORM
WHF Whitefield Limited 4.29 4.40 UNDERPERFORM 4.28 UNDERPERFORM
WIC Westoz Investment Company Limited 1.20 1.29 BUY 1.35 BUY
WMK Watermark Market Neutral Fund Limited 1.10 0.99 UNDERPERFORM 1.03 UNDERPERFORM INITATION INITATION INITATION INITATION IPO INITATION INITATION IPO INITATION IPO INITATION INITATION INITATION INITATION INITATION INITATION INITATION
Target Price and Recommendation Changes ... 2
Total shareholder returns and the manager ... 4
Market Capitalisation & Liquidity ... 5
Premiums/discounts to Net Tangible Assets (NTA) ... 6
Fees – both management fees and performance fees (where applicable) ... 8
Yield (including franking) and sustainability of dividends ... 9
Summary Recommendations ... 10
Future drivers of LICs ... 11
Stock Profiles………. 12
Appendix 1 ……… 55
Appendix 2 ……… 55
The total shareholder return (TSR) is the capital gain plus dividends.
Total shareholder returns are a measure which differentiates the performance of all LICs.
A key attribute in evaluating investment performance of LICs is the 10-year shareholder return.
Below is a table ranking all ASX listed LICs (40 are in our universe) by 10-year TSR.
Table 1: 10-year total shareholder returns (ranked in order of 10 year returns)
Code Company 10 5 3 1 Comments
Year Year Year Year TSR TSR TSR TSR
CTN Contango Microcap Limited 16.7% 12.8% 2.6% 30.6% Before fees
WAM WAM Capital Limited 14.0% 16.1% 17.7% 16.4% Reported as portfolio return before expenses fees and taxes
MIR Mirrabooka Investments Limited 14.0% 15.7% 23.7% 19.2%
AMH AMCIL Limited 13.5% 14.5% 13.0% 14.7%
DUI Diversified United Investment Limited 11.4% 11.7% 15.2% 25.1%
AFI Australian Foundation Investment Company Limited 10.9% 9.8% 16.6% 12.5%
BKI BKI Investment Company Limited 10.5% 15.1% 16.7% 21.0%
MLT Milton Corporation Limited 10.2% 14.5% 18.8% 28.6%
AUI Australian United Investment Company Limited 10.0% 10.8% 12.7% 23.7%
ARG Argo Investments Limited 8.8% 11.2% 10.9% 17.1%
DJW Djerriwarrh Investments Limited 8.7% 8.0% 13.6% 12.8%
WHF Whitefield Limited 8.7% N/A 14.5% 17.7% NA: Not discolsed
HHV Hunter Hall Global Value Limited 6.1% 11.2% 11.1% 21.5%
TGG Templeton Global Growth Fund Limited 4.4% 11.8% 18.1% 23.2%
CIN Carlton Investments Limited N/A N/A N/A N/A NA: Performance not disclosed
ALF Australian Leaders Fund Limited N/A 12.5% 18.8% 6.5% NA: Not disclosed
CDM Cadence Capital Limited N/A 217.8% 52.6% 17.1% NA: Inception (8.8 years to 30/06/14 = 373.74%, 119.7% after fees)
FGX Future Generation Investment Fund Limited N/A N/A N/A N/A NA: New listing
QVE QV Equities Limited N/A N/A N/A N/A NA: Recent listing
WAX WAM Research Limited N/A N/A 18.0% 20.5% NA: Change investment strategy Jul-10, before fees and expenses
WIC Westoz Investment Company Limited N/A N/A N/A N/A NA: Not discolsed
WMK Watermark Market Neutral Fund Limited N/A N/A N/A 1.7% NA: No Data, Inception Jul-13
CAM Clime Capital Limited N/A 16.6% 7.7% 1.2% NA: Change in management July 2009
OZG Ozgrowth Limited N/A N/A N/A N/A NA: Not discolsed
CYA Century Australia Investments Limited N/A 19.1% 14.3% 24.5% NA: Inception 8/4/04 BAF Blue Sky Alternatives Access Fund Limited N/A N/A N/A 33.0% NA: Recent listing
ACQ Acorn Capital Investment Fund Limited N/A N/A N/A N/A NA: Inception May 2014
FSI Flagship Investments Limited N/A 15.2% 16.8% 26.2% NA: 10-year not supplied, performance before fees and expenses NCC NAOS Emerging Opportunities Company Limited N/A N/A N/A 30.5% NA: Inception 26/02/13
SNC Sandon Capital Investments Limited N/A N/A N/A N/A NA: Inception Dec-13
ABW Aurora Absolute Return Fund N/A N/A 5.3% 3.6% NA: Change in investment strategy 1/3/11 (3.87%)
AOD Aurora Dividend Income Trust (Managed Fund) N/A N/A 12.4% 9.8% NA: Inception 16/11/05 (8.1% since)
BST Barrack St Investments Limited N/A N/A N/A N/A NA: Recent listing
AUP Aurora Property Buy-Write Income Trust N/A 10.8% 9.0% 8.2% NA: Inception July-07
MFF Magellan Flagship Fund Limited N/A N/A N/A N/A NA: No data (inception Dec-06)
PMC Platinum Capital Limited N/A 10.2% 15.5% 17.9% NA: No data
AGF AMP Capital China Growth Fund N/A N/A -2.6% -6.6% NA: Inception 10/01/07 (2.4%)
PGF PM Capital Global Opportunities Fund Limited N/A N/A N/A N/A NA: No data inception Dec-13
EMF Emerging Markets Masters Fund N/A N/A N/A N/A NA: No data
PAF PM Capital Asian Opportunities Fund Limited N/A N/A 2.0% -3.4% NA: No data (inception May-14)
Liquidity can also be driven by trends too. According to Australian Foundation Investment Company Limited
(AFI): “
Supply and demand for shares at any one time can fluctuate. In particular, listed investment company
shares sometimes fall out of favour. When the general market is running strongly investors may elect to move
out of "value" shares into "growth stocks". Conversely when market conditions are more subdued investors may
value a steadier stream of dividends and a value based approach to investing
.”
Many LICs have engaged in on-market buybacks to increase liquidity.
Table 2: LIC’s Market Capitalisation with Liquidity
Code Company Price Market cap Monthly % of
23/09/2014 ($m) Turnover ($m) Mkt Cap
Domestic LICs
AFI Australian Foundation Investment Company Limited 6.03 6359.5
33.51
0.5%
ARG Argo Investments Limited 7.80 5183.425.24
0.5%
MLT Milton Corporation Limited 4.39 2772.413.08
0.5%
DJW Djerriwarrh Investments Limited 4.63 1012.110.39
1.0%
AUI Australian United Investment Company Limited 8.50 927.7
3.42
0.4%
BKI BKI Investment Company Limited 1.59 882.3
7.78
0.9%
CIN Carlton Investments Limited 28.00 741.3
1.04
0.1%
WAM WAM Capital Limited 1.98 672.7
13.55
2.0%
DUI Diversified United Investment Limited 3.67 628.0
3.35
0.5%
ALF Australian Leaders Fund Limited 1.63 396.0
13.61
3.4%
MIR Mirrabooka Investments Limited 2.59 365.3
3.14
0.9%
WHF Whitefield Limited 4.29 327.42.49
0.8%
CDM Cadence Capital Limited 1.39 274.28.42
3.1%
AMH AMCIL Limited 0.93 217.61.29
0.6%
FGX Future Generation Investment Fund Limited 1.04 191.0
0.92
0.5%
CTN Contango Microcap Limited 1.12 176.6
4.90
2.8%
QVE QV Equities Limited 0.96 177.2
0.73
0.4%
WAX WAM Research Limited 1.18 164.6
3.14
1.9%
WIC Westoz Investment Company Limited 1.20 155.1
2.42
1.6%
WMK Watermark Market Neutral Fund Limited 1.00 86.7
2.35
2.7%
CAM Clime Capital Limited 0.97 78.7
1.30
1.7%
OZG Ozgrowth Limited 0.20 70.41.14
1.6%
CYA Century Australia Investments Limited 0.88 69.70.96
1.4%
BAF Blue Sky Alternatives Access Fund Limited 0.96 58.00.22
0.4%
ACQ Acorn Capital Investment Fund Limited 0.88 44.70.56
1.3%
FSI Flagship Investments Limited 1.53 37.10.33
0.9%
NCC NAOS Emerging Opportunities Company Limited 1.10 38.9
1.70
4.4%
SNC Sandon Capital Investments Limited 0.97 34.0
0.65
1.9%
ABW Aurora Absolute Return Fund 1.04 30.1
1.74
5.8%
AOD Aurora Dividend Income Trust (Managed Fund) 0.98 23.5
0.83
3.5%
BST Barrack St Investments Limited 1.00 16.0
0.01
0.1%
AUP Aurora Property Buy-Write Income Trust 5.37 12.9
0.11
0.9%
NAC NAOS Absolute Opportunities Fund 1.00-GWP Global Wealth Partners 1.25
-Global LICs
MFF Magellan Flagship Fund Limited 1.49 529.7
11.49
2.2%
PMC Platinum Capital Limited 1.81 420.3
13.56
3.2%
AGF AMP Capital China Growth Fund 0.77 286.6
6.87
2.3%
The two stocks with the largest dollar turnover liquidity, AFI and Argo Investments Limited (ARG), are also the two
with the largest market capitalisation.
But other factors such as marketing and TSR are also significant drivers of liquidity as a percentage of market
capitalisation.
For example, Naos Emerging Opportunities Company Limited (NCC) has almost 5 times the liquidity of a higher
market capitalisation stock such as Flagship Investments Limited (FSI). NCC is the second highest LIC ranked
on our list of average monthly turnover relative to market capitalisation.
Premiums/discounts to Net Tangible Assets (NTA)
According to Clime Capital Limited (CAM)’s website:
“
LICs are unique investment vehicles because they can trade at a discount or premium to the assets that they
own. When investors want to sell shares in the LICs, the share price may fall below the value of its net asset
backing (or NTA). The net asset backing per share is what you would get per share if all the underlying shares
were sold on the stock market.
We refer to this as trading at a discount to NTA. This can provide a great buying opportunity for investors,
because they can buy into a portfolio of shares at less than it would cost to buy them separately on the ASX.
On the other hand, when the shares in a LIC rally, the share price may trade higher than the value of the assets
it owns. In other words, you could buy the shares in the portfolio cheaper on the stock market (on average). This
is referred to as trading at a premium to NTA. This situation can provide a selling opportunity for investors
.”
On the next page is a table ranking ASX listed LICs (40 are in our universe) by premium or discount to Net
Asset Value (or NTA).
Seven of the LICs in our universe trade at more than a 10% discount to NTA; CAM, ACQ, HHV, FSI, AGF, CTN,
and OZG. This compares to 6 LICs trading at more than a 10% discount to NTA
in our last LIC report
.
Twelve LICs trade at more than a 5% discount to NAV, compared to fourteen in our last report.
Fifteen trade a premium to NTA, with three trading at premiums over 15%.
Code
Company
Price
Most
Premium
$
recent
or
pretax NAV
Discount
DJW
Djerriwarrh Investments Limited
4.63
3.76
23.14%
PMC
Platinum Capital Limited
1.81
1.48
22.30%
ALF
Australian Leaders Fund Limited
1.63
1.41
15.60%
MIR
Mirrabooka Investments Limited
2.59
2.32
11.64%
FGX
Future Generation Investment Fund Limited
1.04
0.97
7.22%
WAM
WAM Capital Limited
1.98
1.85
6.62%
EMF
Emerging Markets Masters Fund
1.71
1.62
5.56%
WAX
WAM Research Limited
1.18
1.14
3.50%
BST
Barrack St Investments Limited
1.00
0.97
3.39%
ARG
Argo Investments Limited
7.80
7.58
2.90%
TGG
Templeton Global Growth Fund Limited
1.40
1.38
1.30%
AMH
AMCIL Limited
0.93
0.92
1.09%
ABW
Aurora Absolute Return Fund
1.04
1.03
0.97%
AFI
Australian Foundation Investment Company Limited
6.03
5.99
0.67%
WMK
Watermark Market Neutral Fund Limited
1.00
0.99
0.51%
MLT
Milton Corporation Limited
4.39
4.41
-0.45%
MFF
Magellan Flagship Fund Limited
1.49
1.50
-0.60%
BAF
Blue Sky Alternatives Access Fund Limited
0.96
0.97
-0.84%
AOD
Aurora Dividend Income Trust (Managed Fund)
0.98
0.99
-1.26%
PGF
PM Capital Global Opportunities Fund Limited
0.95
0.96
-1.88%
QVE
QV Equities Limited
0.96
0.98
-1.94%
AUP
Aurora Property Buy-Write Income Trust
5.37
5.51
-2.54%
CDM
Cadence Capital Limited
1.39
1.43
-3.01%
PAF
PM Capital Asian Opportunities Fund Limited
0.93
0.97
-3.76%
AUI
Australian United Investment Company Limited
8.50
8.84
-3.85%
BKI
BKI Investment Company Limited
1.59
1.67
-4.79%
WHF
Whitefield Limited
4.29
4.51
-4.88%
SNC
Sandon Capital Investments Limited
0.97
1.02
-4.98%
DUI
Diversified United Investment Limited
3.67
3.91
-6.14%
WIC
Westoz Investment Company Limited
1.20
1.29
-7.26%
CYA
Century Australia Investments Limited
0.88
0.95
-7.89%
NCC
NAOS Emerging Opportunities Company Limited
1.10
1.20
-8.33%
CIN
Carlton Investments Limited
28.00
31.02
-9.74%
CAM
Clime Capital Limited
0.97
1.09
-11.01%
ACQ
Acorn Capital Investment Fund Limited
0.88
1.00
-11.57%
HHV
Hunter Hall Global Value Limited
1.13
1.28
-12.31%
FSI
Flagship Investments Limited
1.53
1.80
-14.81%
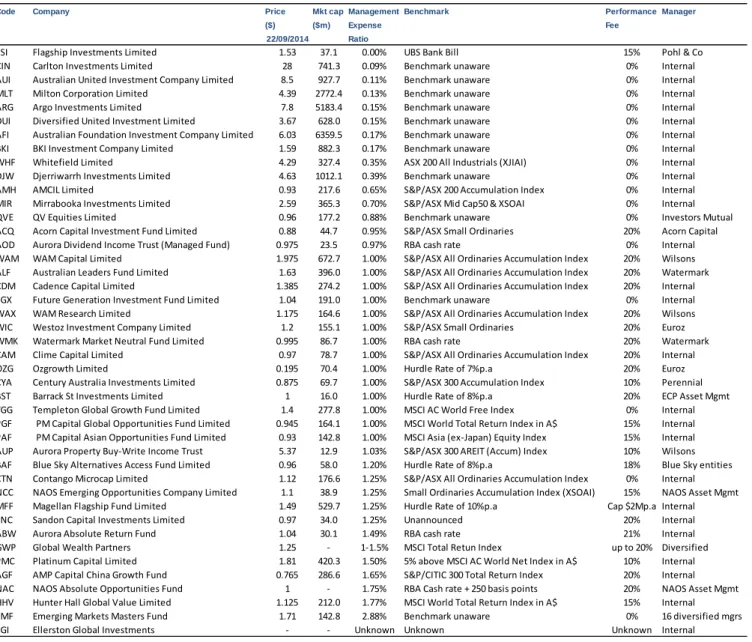
LIC fees vary widely. For our universe of stocks management fees range widely too - from FSI’s zero (although
performance fees are payable) to EMF’s lofty 2.88%.
Also worth noting is that
FGX’s management fee of 1% is donated to selected Australian children’s charities
rather than the managers. This can be thought of as either 0% or 1% depending on the investor’s priorities. The
managers are working pro-bono and no performance fee is charged. In the interests of full disclosure we have
included it as a 1% fee.
Table 4: Management Expense Ratios (fees) for LICs
Code Company Price Mkt cap Management Benchmark Performance Manager
($) ($m) Expense Fee
22/09/2014 Ratio
FSI Flagship Investments Limited 1.53 37.1 0.00% UBS Bank Bill 15% Pohl & Co
CIN Carlton Investments Limited 28 741.3 0.09% Benchmark unaware 0% Internal
AUI Australian United Investment Company Limited 8.5 927.7 0.11% Benchmark unaware 0% Internal
MLT Milton Corporation Limited 4.39 2772.4 0.13% Benchmark unaware 0% Internal
ARG Argo Investments Limited 7.8 5183.4 0.15% Benchmark unaware 0% Internal
DUI Diversified United Investment Limited 3.67 628.0 0.15% Benchmark unaware 0% Internal
AFI Australian Foundation Investment Company Limited 6.03 6359.5 0.17% Benchmark unaware 0% Internal
BKI BKI Investment Company Limited 1.59 882.3 0.17% Benchmark unaware 0% Internal
WHF Whitefield Limited 4.29 327.4 0.35% ASX 200 All Industrials (XJIAI) 0% Internal
DJW Djerriwarrh Investments Limited 4.63 1012.1 0.39% Benchmark unaware 0% Internal
AMH AMCIL Limited 0.93 217.6 0.65% S&P/ASX 200 Accumulation Index 0% Internal
MIR Mirrabooka Investments Limited 2.59 365.3 0.70% S&P/ASX Mid Cap50 & XSOAI 0% Internal
QVE QV Equities Limited 0.96 177.2 0.88% Benchmark unaware 0% Investors Mutual
ACQ Acorn Capital Investment Fund Limited 0.88 44.7 0.95% S&P/ASX Small Ordinaries 20% Acorn Capital
AOD Aurora Dividend Income Trust (Managed Fund) 0.975 23.5 0.97% RBA cash rate 0% Internal
WAM WAM Capital Limited 1.975 672.7 1.00% S&P/ASX All Ordinaries Accumulation Index 20% Wilsons
ALF Australian Leaders Fund Limited 1.63 396.0 1.00% S&P/ASX All Ordinaries Accumulation Index 20% Watermark CDM Cadence Capital Limited 1.385 274.2 1.00% S&P/ASX All Ordinaries Accumulation Index 20% Internal
FGX Future Generation Investment Fund Limited 1.04 191.0 1.00% Benchmark unaware 0% Internal
WAX WAM Research Limited 1.175 164.6 1.00% S&P/ASX All Ordinaries Accumulation Index 20% Wilsons
WIC Westoz Investment Company Limited 1.2 155.1 1.00% S&P/ASX Small Ordinaries 20% Euroz
WMK Watermark Market Neutral Fund Limited 0.995 86.7 1.00% RBA cash rate 20% Watermark
CAM Clime Capital Limited 0.97 78.7 1.00% S&P/ASX All Ordinaries Accumulation Index 20% Internal
OZG Ozgrowth Limited 0.195 70.4 1.00% Hurdle Rate of 7%p.a 20% Euroz
CYA Century Australia Investments Limited 0.875 69.7 1.00% S&P/ASX 300 Accumulation Index 10% Perennial
BST Barrack St Investments Limited 1 16.0 1.00% Hurdle Rate of 8%p.a 20% ECP Asset Mgmt
TGG Templeton Global Growth Fund Limited 1.4 277.8 1.00% MSCI AC World Free Index 0% Internal
PGF PM Capital Global Opportunities Fund Limited 0.945 164.1 1.00% MSCI World Total Return Index in A$ 15% Internal PAF PM Capital Asian Opportunities Fund Limited 0.93 142.8 1.00% MSCI Asia (ex-Japan) Equity Index 15% Internal AUP Aurora Property Buy-Write Income Trust 5.37 12.9 1.03% S&P/ASX 300 AREIT (Accum) Index 10% Wilsons
BAF Blue Sky Alternatives Access Fund Limited 0.96 58.0 1.20% Hurdle Rate of 8%p.a 18% Blue Sky entities
CTN Contango Microcap Limited 1.12 176.6 1.25% S&P/ASX All Ordinaries Accumulation Index 0% Internal NCC NAOS Emerging Opportunities Company Limited 1.1 38.9 1.25% Small Ordinaries Accumulation Index (XSOAI) 15% NAOS Asset Mgmt
MFF Magellan Flagship Fund Limited 1.49 529.7 1.25% Hurdle Rate of 10%p.a Cap $2Mp.a Internal
SNC Sandon Capital Investments Limited 0.97 34.0 1.25% Unannounced 20% Internal
ABW Aurora Absolute Return Fund 1.04 30.1 1.49% RBA cash rate 21% Internal
GWP Global Wealth Partners 1.25 - 1-1.5% MSCI Total Retun Index up to 20% Diversified
PMC Platinum Capital Limited 1.81 420.3 1.50% 5% above MSCI AC World Net Index in A$ 10% Internal
AGF AMP Capital China Growth Fund 0.765 286.6 1.65% S&P/CITIC 300 Total Return Index 20% Internal
NAC NAOS Absolute Opportunities Fund 1 - 1.75% RBA Cash rate + 250 basis points 20% NAOS Asset Mgmt
HHV Hunter Hall Global Value Limited 1.125 212.0 1.77% MSCI World Total Return Index in A$ 15% Internal
EMF Emerging Markets Masters Fund 1.71 142.8 2.88% Benchmark unaware 0% 16 diversified mgrs
EGI Ellerston Global Investments - - Unknown Unknown Unknown Internal
Source: Companies & BBY
Management fees are often augmented by performance fees. Performance fees are payable once the
performance exceeds a specified benchmark.
Code Company Price Market cap Last FY Grossed Franking
($) ($m) Dividend up Yield
23/09/2014
MIR Mirrabooka Investments Limited 2.59 365.3 $ 0.200 11.03% 100%
OZG Ozgrowth Limited 0.20 70.4 $ 0.015 10.99% 100%
WIC Westoz Investment Company Limited 1.20 155.1 $ 0.090 10.71% 100%
ALF Australian Leaders Fund Limited 1.63 396.0 $ 0.120 10.52% 100%
CDM Cadence Capital Limited 1.39 274.2 $ 0.100 10.31% 100%
AMH AMCIL Limited 0.93 217.6 $ 0.065 9.98% 100%
WAM WAM Capital Limited 1.98 672.7 $ 0.130 9.40% 100%
WAX WAM Research Limited 1.18 164.6 $ 0.075 9.12% 100%
CTN Contango Microcap Limited 1.12 176.6 $ 0.086 8.94% 38%
DJW Djerriwarrh Investments Limited 4.63 1012.1 $ 0.260 8.02% 100%
AUP Aurora Property Buy-Write Income Trust 5.37 12.9 $ 0.429 7.98% 0% NCC NAOS Emerging Opportunities Company Limited 1.10 38.9 $ 0.058 7.47% 100% WMK Watermark Market Neutral Fund Limited 1.00 86.7 $ 0.050 7.18% 100%
FSI Flagship Investments Limited 1.53 37.1 $ 0.073 6.77% 100%
CAM Clime Capital Limited 0.97 78.7 $ 0.043 6.33% 100%
PMC Platinum Capital Limited 1.81 420.3 $ 0.080 6.31% 100%
BKI BKI Investment Company Limited 1.59 882.3 $ 0.070 6.24% 100%
TGG Templeton Global Growth Fund Limited 1.40 277.8 $ 0.060 6.12% 100%
HHV Hunter Hall Global Value Limited 1.13 212.0 $ 0.065 6.12% 14%
ABW Aurora Absolute Return Fund 1.04 30.1 $ 0.063 6.08% 0%
MLT Milton Corporation Limited 4.39 2772.4 $ 0.180 5.86% 100%
WHF Whitefield Limited 4.29 327.4 $ 0.170 5.66% 100%
DUI Diversified United Investment Limited 3.67 628.0 $ 0.140 5.45% 100% AUI Australian United Investment Company Limited 8.50 927.7 $ 0.320 5.38% 100% AFI Australian Foundation Investment Company Limited 6.03 6359.5 $ 0.220 5.21% 100%
ARG Argo Investments Limited 7.80 5183.4 $ 0.280 5.13% 100%
CIN Carlton Investments Limited 28.00 741.3 $ 1.000 5.10% 100%
EMF Emerging Markets Masters Fund 1.71 142.8 $ 0.060 3.51% 0%
AGF AMP Capital China Growth Fund 0.77 286.6 $ 0.019 2.51% 0%
AOD Aurora Dividend Income Trust (Managed Fund) 0.98 23.5 $ 0.020 2.05% 0%
MFF Magellan Flagship Fund Limited 1.49 529.7 $ 0.020 1.34% 0%
FGX Future Generation Investment Fund Limited 1.04 191.0 $ - 0.00% 0%
QVE QV Equities Limited 0.96 177.2 $ - 0.00% 0%
CYA Century Australia Investments Limited 0.88 69.7 $ 0.050 0.00% 100% BAF Blue Sky Alternatives Access Fund Limited 0.96 58.0 $ - 0.00% 0% ACQ Acorn Capital Investment Fund Limited 0.88 44.7 $ - 0.00% 0%
BST Barrack St Investments Limited 1.00 16.0 $ - 0.00% 0%
PGF PM Capital Global Opportunities Fund Limited 0.95 164.1 $ - 0.00% 0% PAF PM Capital Asian Opportunities Fund Limited 0.93 51.2 $ - 0.00% 0%
SNC Sandon Capital Investments Limited 0.97 34.0 $ - 0.00% 0%
Source: Companies & BBY
BBY places a BUY recommendation on stocks that we expect will return 10% or more (grossed up yield) over a
12-month period.
This definition captures five LICs as seen in the above table:
Ozgrowth Limited (OZG)
Total shareholder returns – commonly measured over 10 years – a measure of the manager;
Liquidity (market capitalisation);
Premiums/discounts to Net Tangible Assets (NTA);
Fees – both management fees and performance fees (where applicable); and
Yield (including franking) and sustainability of dividends.
Before placing a
BUY
recommendation on a LIC, BBY considers if the Gross yield exceeds 10%
or all of the
following four conditions are met;
Discount to NTA exceeds 5% and;
10-year TSR exceeds 10% and;
Gross yield exceeds 5% and;
Performance fees are less than or equal to 15%.
The following table summarises these attributes for the 34 domestic and 9 global LICs.
Refer to
page two
for the full list of recommendations including price targets and revisions from our last report.
Table 6: Summary of attributes
Code Company Price Target PriceGross Yield Discount 10Yr TSR Gross Yield Perf Fees Recommendation ($) ($) >10% >5% >10% >5% <15.01%
23/09/2014
Domestic LICs
AFI Australian Foundation Investment Company Limited 6.03 6.01 - - YES YES YES UNDERPERFORM ARG Argo Investments Limited 7.80 7.69 - - - YES YES UNDERPERFORM MLT Milton Corporation Limited 4.39 4.40 - - YES YES YES UNDERPERFORM DJW Djerriwarrh Investments Limited 4.63 4.20 - - - YES YES UNDERPERFORM AUI Australian United Investment Company Limited 8.50 8.67 - - - YES YES UNDERPERFORM BKI BKI Investment Company Limited 1.59 1.63 - - YES YES YES UNDERPERFORM CIN Carlton Investments Limited 28.00 31.02 - YES YES YES YES BUY WAM WAM Capital Limited 1.98 1.91 - - YES YES - UNDERPERFORM DUI Diversified United Investment Limited 3.67 3.91 - - YES YES YES BUY ALF Australian Leaders Fund Limited 1.63 1.63 YES - YES YES - BUY MIR Mirrabooka Investments Limited 2.59 2.59 YES - YES YES YES BUY WHF Whitefield Limited 4.29 4.40 - - - YES YES UNDERPERFORM CDM Cadence Capital Limited 1.39 1.43 YES - YES YES - BUY AMH AMCIL Limited 0.93 0.93 - - YES YES YES UNDERPERFORM FGX Future Generation Investment Fund Limited 1.04 1.01 - - - - YES UNDERPERFORM CTN Contango Microcap Limited 1.12 1.32 - YES YES YES YES BUY QVE QV Equities Limited 0.96 1.00 - - - - YES UNDERPERFORM WAX WAM Research Limited 1.18 1.16 - - - YES - UNDERPERFORM WIC Westoz Investment Company Limited 1.20 1.29 YES YES - YES - BUY WMK Watermark Market Neutral Fund Limited 1.00 0.99 - - - YES - UNDERPERFORM CAM Clime Capital Limited 0.97 1.03 - YES - YES - UNDERPERFORM OZG Ozgrowth Limited 0.20 0.24 YES YES - YES - BUY CYA Century Australia Investments Limited 0.88 0.91 - YES - - YES UNDERPERFORM BAF Blue Sky Alternatives Access Fund Limited 0.96 0.96 - - - UNDERPERFORM ACQ Acorn Capital Investment Fund Limited 0.88 0.94 - YES - - - UNDERPERFORM FSI Flagship Investments Limited 1.53 1.80 - YES - YES YES UNDERPERFORM NCC NAOS Emerging Opportunities Company Limited 1.10 1.20 - YES EXCEPTION YES YES BUY SNC Sandon Capital Investments Limited 0.97 1.00 - - - UNDERPERFORM ABW Aurora Absolute Return Fund 1.04 1.04 - - - YES - UNDERPERFORM AOD Aurora Dividend Income Trust (Managed Fund) 0.98 0.98 - - - - YES UNDERPERFORM BST Barrack St Investments Limited 1.00 0.98 - - - UNDERPERFORM AUP Aurora Property Buy-Write Income Trust 5.37 5.44 - - - YES YES UNDERPERFORM
NAC NAOS Absolute Opportunities Fund 1.00 GWP Global Wealth Partners 1.25
According to the Australian Financial Review (9 July 2014):
“SMSFs have invested around $18 billion in listed
trusts, including exchange traded products, at the end of June last year. This compares to the larger $66.5 billion
invested in unlisted managed investments and unlisted trusts, the $158 billion SMSFs invested in cash, according
to ATO figures.”
The Australian superannuation industry is set to grow further due to the looming increases in the superannuation
guarantee contributions.
According to Superguide (3 September 2014): “
In the 2014 Federal Budget, the planned increase in
Superannuation Guarantee contributions from 9.25% to 12% over the next 5 years has been rejigged by the
Liberal government, stretching the timeframe to 8 years. Due to negotiations with the Palmer United Party to get
the Mineral Resource Rent Tax repealed, the timeframe has now stretched to 12 years.
Effective from 1 July 2014, the Superannuation Guarantee percentage increased 9.5%, and will expected to rise
to 12% by July 2022 (already extended from July 2020) under the Liberal government, rather than the original
starting date of 2019, planned by the former ALP government and what is currently law.
The Liberal government promised in the 2014 Federal Budget that the SG rate increase will stall for 3 years (from
1 July 2015), rising to 10% from 1 July 2018. The SG rate would then increase by 0.5% each year until it reached
12% by July 2022. What the Liberal government is now introducing is that the SG rate will stall from 1 July 2015
for 7 years (until 30 June 2021), and then increase by 0.5% each year following until SG reached 12% from 1 July
2025.”
Table 7: Superannuation Guarantee Entitlements
Financial Year
Proposal Rate before
Parliament (%)
Rate Under Current
law (%)
2012/2013
n/a
9
2013/2014
n/a
9.25
2014/2015
9.5
9.5
2015/2016
9.5
10.0
2016/2017
9.5
10.5
2017/2018
9.5
11.0
2018/2019
9.5
11.5
2019/2020
9.5
12.0
2020/2021
9.5
12.0
2021/2022
10
12.0
2022/2023
10.5
12.0
2023/2024
11.0
12.0
2024/2025
11.5
12.0
2025/2026
12.0
12.0
Source: Superguide (3/0/14)
There is nothing to suggest that the looming increases in the superannuation guarantee contributions will do
anything to inhibit Australia’s booming SMSF industry.
There is nothing to indicate that the SMSFs’ interest in LICs will diminish.
This Research has been prepared and issued by BBY Ltd and remains the property of BBY Ltd. No material contained in this Research may be reproduced or distributed without prior written approval of BBY, except as allowed by the Copyright Act. This Research is current at the date of publishing. For updates or further information regarding this research, please contact
your advisor. BBY does or seeks to undertake business with companies covered in its research and therefore, Investors should consider this report as only a single factor in making their investment decisions. For explanations regarding ratings and other important disclosures, please refer to the disclosure section at the end of this document.
A small-cap absolute-return LIC charging the highest performance fees
Aurora Absolute Return Fund (ABW):
♦
is one of the smallest LICs in our universe in Australia
by market capitalisation;
♦
trades at a negligible 0.97% premium to NTA;
♦
has no 10-year TSR as inception date was just July
2006;
♦
has a very high management expense ratio of 1.49%;
♦
charges a 20.5% performance fee on returns in excess
of the RBA cash rate; and
♦
offers a healthy 6.08% (zero franked) yield.
The majority of asset classes invested in by the Fund are
units in an unlisted registered managed investment scheme
that predominately holds highly liquid assets. The
Responsible Entity estimates that under normal market
conditions at least 90% of the Fund’s assets are able to be
liquidated within 10 business days.
Investment Aim
The Fund aims to achieve a high rate of return, comprising
both income and capital growth (and preservation of the
capital of the Fund) over both rising and falling equity
markets. Please note that while we aim to achieve this
objective, the returns are not guaranteed.
Company Data
Number of shares 29M
Market capitalisation $30M
Free Float (%) na
12 month high/low $1.08/$1.02
Average monthly turnover $2M
% S&P/ASX 200 n/a
% All Ordinaries n/a
DDM Ranking #296/540
ESG Disclaimer Score (Ranking) n/a
GICS Industry Group Diversified Financials
BBY Technical View
– as at 22/09/2014Short Term Uptrend Resistance $1.05
Long Term Downtrend Support $1.02
ABW Share Price Performance
Aurora Absolute Return Fund
ABW
A$1.04
TARGET PRICE
A$1.04
UNDERPERFORM
Aurora Sandringham Australia Equity Income Trust is a listed investment company incorporated in Australia. The Fund will generally hold S&P/ASX 200 Index market exposure, either directly through a portfolio of shares, Index ETFs, or through derivatives. The Fund may utilise debt funding to allow it to invest in the arbitrage strategies.
Russell Wright
+61 2 9226 0091
rxw@bby.com.au
This Research has been prepared and issued by BBY Ltd and remains the property of BBY Ltd. No material contained in this Research may be reproduced or distributed without prior written approval of BBY, except as allowed by the Copyright Act. This Research is current at the date of publishing. For updates or further information regarding this research, please contact your advisor. BBY does or seeks to undertake business with companies covered in its research and therefore, Investors should consider this report as only a single factor in making their investment decisions. For explanations regarding ratings and other important disclosures, please refer to the disclosure section at the end of this document.
A new Microcap specialist, listed at the start of May
Acorn Capital Investment Fund Limited (ACQ):
♦
is a new LIC in Australia, listed on May 1st;
♦
trades at a large 11.57% discount to NTA,;
♦
has a sizeable management expense ratio of 0.95%
♦
and charges a 20% performance fee on returns in excess
of the S&P/ASX Small Ordinary Accumulation Index
Ticker Company Name
Weight (%)
SRV
Servcorp Limited
4.04
SDL
Sundance Resources Limited
3.34
HZN
Horizon Oil Limited
2.82
PIR
Papillon Resources Limited
2.56
ESV
Eservglobal Limited
2.04
ICQ
Icar Asia Limited
2.02
Amaysim Australia
1.96
Sub161
1.89
GHC
Generation Healthcare REIT
1.89
WTP
Watpac Limited
1.75
Total
(ex. Cash)
24.31
Top 10 Investments as at 31 August 2014
Investment Aim
ACQ’s primary objective is to achieve after-fee returns on its
investment portfolio in the long term that are higher than the
S&P/ASX Small Ordinaries Accumulation Index, through
long-term capital growth by way of investment in a diversified
portfolio of Microcap Companies. This will be achieved via
investments in Listed Microcaps and Unlisted Microcaps
(where the Manager determines that such opportunities
present relative better value).
Company Data
Number of shares 51M
Market capitalisation $46M
Free Float (%)
12 month high/low $0.96/$0.85
Average monthly turnover $1M
% S&P/ASX 200 n/a
% All Ordinaries n/a
DDM Ranking n/a
ESG Disclaimer Score (Ranking) n/a
GICS Industry Group Diversified Financials
BBY Technical View
– as at 23/09/2014Short Term Range Resistance $0.94
Long Term Range Support $0.86
ACQ Share Price Performance
Limited
ACQ
A$0.90
TARGET PRICE
A$0.94
UNDERPERFORM
The Acorn Capital Investment Fund is run by Acorn Capital, a boutique investment manager specialising in Australian microcap companies. The fund’s primary objective is to achieve after fee returns higher than the S&P/ASX Small ordinaries index, through long-term capital growth by way of investment in a diversified portfolio of microcap companies.
Russell Wright
+61 2 9226 0091
rxw@bby.com.au
This Research has been prepared and issued by BBY Ltd and remains the property of BBY Ltd. No material contained in this Research may be reproduced or distributed without prior written approval of BBY, except as allowed by the Copyright Act. This Research is current at the date of publishing. For updates or further information regarding this research, please contact your advisor. BBY does or seeks to undertake business with companies covered in its research and therefore, Investors should consider this report as only a single factor in making their investment decisions. For explanations regarding ratings and other important disclosures, please refer to the disclosure section at the end of this document.
The largest LIC in Australia
Australian Foundation Investment Company Limited (AFI):
♦
is the largest LIC in Australia by market capitalisation;
♦
trades at a negligible 0.6% premium to NTA;
♦
has a healthy 10-year TSR of 10.9%;
♦
has a creditable management expense ratio of just
0.17%;
♦
charges no performance fees and is “benchmark
unaware”; and
♦
offers a modest 5.21% grossed up fully franked yield.
Company Name Total Value (A$ million) CBA Commonwealth Bank of Australia 689.8
WBC Westpac Banking Corporation 639.0
BHP BHP Billiton Limited 516.7
NAB National Australia Bank Limited 332.2
WES Wesfarmers Limited 327.1
TLS Telstra Corporation Limited 291.6
ANZ Australia and New Zealand Banking Group Limited 283.7
RIO RIO Tinto Limited 228.7
WOW Woolworths Limited 228.3
OSH Oil Search Limited 159.7
TCL Transurban Group 158.8
AMC Amcor Limited 146.9
WPL Woodside Petroleum Limited 140.2
AMP AMP Limited 118.2
STO Santos Limited 117.5
ORG Origin Energy Limited 108.0
BXB Brambles Limited 106.1
CPU Computershare Limited 100.5
QBE QBE Insurance Group Limited 95.5
APA APA Group 90.2
AGK AGL Energy Limited 86.0
CSL Csl Limited 80.8
RHC Ramsay Health Care Limited 70.7
IPL Incitec Pivot Limited 69.4
MLT Milton Corporation Limited 65.2
Total 5251.0
As % of Total Portfolio Value (excludes Cash) 79.6% Top 25 Investments as at 31 August 2014
Investment Aim
To provide attractive investment returns through access to a
steady stream of fully franked dividends and enhancement of
capital invested.
Company Data
Number of shares 1,055M Market capitalisation $6,338M Free Float (%) 98.4 12 month high/low $6.33/$5.70Average monthly turnover $45M
% S&P/ASX 200 n/a
% All Ordinaries n/a
DDM Ranking #281/540
ESG Disclaimer Score (Ranking) n/a
GICS Industry Group Diversified Financials
BBY Technical View
– as at 23/09/2014Short Term Downtrend Resistance $6.35
Long Term Range Support $6.00
AFI Share Price Performance
Australian Foundation Investment
Company Limited
AFI
A$6.01
TARGET PRICE
A$6.01
UNDERPERFORM
Australian Foundation Investment Company Limited is a listed investment company incorporated in Australia. The Fund aims to pay dividends over time, grow faster than the rate of inflation, and provide attractive total returns over the medium to long term. The Fund invests in Australian equities, with a medium to long-term view of value.
Russell Wright
+61 2 9226 0091
rxw@bby.com.au
This Research has been prepared and issued by BBY Ltd and remains the property of BBY Ltd. No material contained in this Research may be reproduced or distributed without prior written approval of BBY, except as allowed by the Copyright Act. This Research is current at the date of publishing. For updates or further information regarding this research, please contact your advisor. BBY does or seeks to undertake business with companies covered in its research and therefore, Investors should consider this report as only a single factor in making their investment decisions. For explanations regarding ratings and other important disclosures, please refer to the disclosure section at the end of this document.
A mid-tier Global LIC investing in China
Amp Capital China Growth Fund (AGF):
♦
is a mid-tier global LIC in our universe in Australia by
market capitalisation;
♦
trades at a very large 15.00% discount to NTA;
♦
has no 10-year TSR as inception date was 20 November
2006;
♦
has a large 1.65% management expense ratio;
♦
charges 20% performance fees on excess returns above
the S&P/CITIC 300 Total Return Index; and
♦
offers a paltry 2.51% grossed up yield.
Company Name Sector Weight (%)
China Vanke Co Ltd Real Estate Mgt & Dev 5.53 Ping An Insurance Group Co of China Ltd Insurance 5.21 CITIC Securities Co Ltd Capital Markets 4.07 China Merchants Bank Corp Ltd Commercial Banks 3.75 China Minsheng Banking Corp Ltd Commercial Banks 3.61 Shanghai Pudong Development Bank Co Ltd Commercial Banks 3.59 Industrial Bank Co Ltd Commercial Banks 3.50
Kwelchow Moutai Co Ltd Beverages 3.29
Gree Electric Appliances Inc Houshold Durables 2.64 Poly Real Estate Group Co Ltd Real Estate Mgt & Dev 2.52 Anuhi Conch Cement Co Ltd Construction Materials 2.43 Zhengzhou Yutong Bus Co Ltd Machinery 2.40 Ping An Bank Co Ltd Commercial Banks 2.15
Byd Co Ltd Automobiles 2.04
SAIC Motor Corp Ltd Automobiles 1.83
Midea Group Co Ltd Houshold Durables 1.77 Sealand securities Co Ltd Capital Markets 1.74 BesTV New Media Co Ltd Houshold Durables 1.69 Haitong Securities Co Ltd Capital Markets 1.58 China Merchants Securities Co Ltd Capital Markets 1.58
Total 56.92
Twenty largest stock positions as at 31 July 2014
Investment Aim
To achieve long-term capital growth for investors by
investing in China A shares, which are shares in companies
listed on China’s Shanghai or Shenzhen stock exchanges;
and outperform the S&P/CITIC 300 Total Return Index
(expressed in Australian dollars).
Company Data
Number of shares 375M
Market capitalisation $290M
Free Float (%) 61.5
12 month high/low $0.87/$0.63
Average monthly turnover $7M
% S&P/ASX 200 n/a
% All Ordinaries n/a
DDM Ranking #195/540
ESG Disclaimer Score (Ranking) n/a
GICS Industry Group Diversified Financials
BBY Technical View
– as at 22/09/2014Short Term Uptrend Resistance $0.811
Long Term Uptrend Support $0.721
AGF Share Price Performance
AMP Capital China Growth Fund
AGF
A$0.78
TARGET PRICE
A$0.82
UNDERPERFORM
AMP Capital China Growth Fund is an investment entity incorporated in Australia. The Fund aims to provide long-term capital growth and to outperform the S&P/CITIC 300 Index. The Fund invests in China A shares listed on China's Shanghai or Shenzhen exchanges. China A shares are not readily available to Australian investors, and provide exposure to the growing Chinese economy.
Russell Wright
+61 2 9226 0091
rxw@bby.com.au
This Research has been prepared and issued by BBY Ltd and remains the property of BBY Ltd. No material contained in this Research may be reproduced or distributed without prior written approval of BBY, except as allowed by the Copyright Act. This Research is current at the date of publishing. For updates or further information regarding this research, please contact your advisor. BBY does or seeks to undertake business with companies covered in its research and therefore, Investors should consider this report as only a single factor in making their investment decisions. For explanations regarding ratings and other important disclosures, please refer to the disclosure section at the end of this document.
A mid-tier domestic LIC boasting a yield >10%
Australian Leaders Fund (ALF):
♦
is the tenth-largest LIC in Australia by market
capitalisation;
♦
trades at a very large 15.56% premium to NTA;
♦
has not recently disclosed a 10-year TSR, it however
discloses a 5 year TSR of 12.5%;
♦
has a high management expense ratio of 1.00%;
♦
and charges a 20% no performance fee on returns in
excess of the S&P/ASX All Ordinaries Accumulation
Index; and
♦
offers an excellent 10.52% grossed up fully franked
yield.
Ticker Company Name Weightings
ANZ Australia and New Zealand Banking Group Limited 4.96%
CBA Commonwealth Bank of Australia 4.18%
RIO RIO Tinto Limited 3.72%
WES Wesfarmers Limited 2.36%
PRY Primary Health Care Limited 2.07%
ORG Origin Energy Limited 2.03%
CWN Crown Resorts Limited 1.96%
WOR WorleyParsons Limited 1.85%
SEA Sundance Energy Australia Limited 1.79% IQE Intueri Education Group Limited 1.78%
Total 26.70%
Top 10 Holdings as at 30 June 2014
Investment Aim
The fund looks to invest in leading Australian companies, with
strong business fundamentals on attractive terms. By
constructing a portfolio of these undervalued shares we hope
to deliver superior returns to our shareholders over time.
Company Data
Number of shares 243M
Market capitalisation $392M
Free Float (%) 91.9
12 month high/low $1.84/$1.59
Average monthly turnover $14M
% S&P/ASX 200 n/a
% All Ordinaries n/a
DDM Ranking #272/540
ESG Disclaimer Score (Ranking) n/a
GICS Industry Group Diversified Financials
BBY Technical View
– as at 22/09/2014Short Term Downtrend Resistance $1.71
Long Term Downtrend Support $1.59
ALF Share Price Performance
Australian Leaders Fund Limited
ALF
A$1.62
TARGET PRICE
A$1.63
BUY
Australian Leaders Fund Ltd is an investment company incorporated in Australia. The Fund aims to provide a high rate of return, deliver a secure income stream of fully franked dividends, and preserve capital. The Fund invests up to 50% in liquid assets. At least 70% of the equity portion of the Fund are included in the S&P/ASX 100 Index. The Fund may short sell up to 30% of equity.
Russell Wright
+61 2 9226 0091
rxw@bby.com.au
This Research has been prepared and issued by BBY Ltd and remains the property of BBY Ltd. No material contained in this Research may be reproduced or distributed without prior written approval of BBY, except as allowed by the Copyright Act. This Research is current at the date of publishing. For updates or further information regarding this research, please contact your advisor. BBY does or seeks to undertake business with companies covered in its research and therefore, Investors should consider this report as only a single factor in making their investment decisions. For explanations regarding ratings and other important disclosures, please refer to the disclosure section at the end of this document.
Mid-tier LIC with top 5 10-year TSR
AMCIL Limited (AMH):
♦
is a mid-tier sized LIC in Australia by market
capitalisation;
♦
trades at a negligible 1.09% premium to NTA;
♦has an excellent 10-year TSR of 13.5%;
♦
has a sizeable management expense ratio of 0.65%;
♦charges no performance fees but measures itself against
the S&P/ASX All Ordinaries Accumulation Index; but
♦offers an excellent 9.98% grossed up fully franked yield.
Ticker Company Name Total Value ($ million)
OSH Oil Search Limited 17,464
CBA Commonwealth Bank of Australia 15,762 BHP BHP Billiton Limited 15,494 WBC Westpac Banking Corporation 11,075
TCL Transurban Group 9,901
STO Santos Limited 9,829
NAB National Australia Bank Limited 8,830 TLS Telstra Corporation Limited 8,603
BXB Brambles Limited 8,204
QBE QBE Insurance Group Limited 6,583
CSL Csl Limited 5,922
AMP AMP Limited 5,826
EQT Equity Trustees Limited 5,675 QUB Qube Holdings Limited 4,550 IPL Incitec Pivot Limited 4,517 TGR Tassal Group Limited 4,511
RMD ResMed Inc. 4,204
BKW Brickworks Limited 4,147
IPP Iproperty Group Limited 4,129 LIC Lifestyle Communities Limited 3,990 159,216 As $ of Total Portfolio 75.30%
Valued at closing prices at 31 August 2014
Investment Aim
To provide shareholders with attractive returns through strong
capital growth in the portfolio over the medium to long-term
together with the generation of dividend income.
Company Data
Number of shares 234M
Market capitalisation $218M
Free Float (%) 70.7
12 month high/low $1.01/$0.82
Average monthly turnover $1M
% S&P/ASX 200 n/a
% All Ordinaries n/a
DDM Ranking #303/540
ESG Disclaimer Score (Ranking) n/a
GICS Industry Group Diversified Financials
BBY Technical View
– as at 22/09/2014Short Term Downtrend Resistance $0.969
Long Term Uptrend Support $0.918
AMH Share Price Performance
AMCIL Limited
AMH
A$0.93
TARGET PRICE
A$0.93
UNDERPERFORM
AMCIL Ltd is an investment company incorporated in Australia. The Fund aims to provide total returns comprising both income & capital growth, which exceed the return of the ASX All Ord Acc Index over the medium to long term. The Fund takes advantage of opportunities arising from thematic/cyclical rotations in the market, corporate activity and stock specific situations within Aust and NZ.
Russell Wright
+61 2 9226 0091
rxw@bby.com.au
This Research has been prepared and issued by BBY Ltd and remains the property of BBY Ltd. No material contained in this Research may be reproduced or distributed without prior written approval of BBY, except as allowed by the Copyright Act. This Research is current at the date of publishing. For updates or further information regarding this research, please contact your advisor. BBY does or seeks to undertake business with companies covered in its research and therefore, Investors should consider this report as only a single factor in making their investment decisions. For explanations regarding ratings and other important disclosures, please refer to the disclosure section at the end of this document.
A low market cap LIC focusing on dividend returns
Aurora Dividend Income Trust (Managed Fund) (AOD):
♦
is a lower-tier LIC in Australia by market capitalisation;
♦
trades at a negligible 1.26% discount to NTA;
♦
has no 10-year TSR yet%;
♦
has a sizeable management expense ratio of 0.97%;
♦
does not charge a performance fee; and
♦
offers a paltry grossed up yield of 2.05%.
As the fund is hedged the top companies list is irrelevant in
the case of AOD.
Investment Aim
The objective of the Trust is to maintain a permanent
exposure to companies that pay fully franked dividends whilst
reducing market exposure. The aim is to be relative to the
Australian equity market and to provide investors with:
“
greater total returns over rolling 5 year periods; more income
and franking credits each year; and less volatility
.”
Company Data
Number of shares 30M
Market capitalisation $29M
Free Float (%) n/a
12 month high/low $1.06/$0.97
Average monthly turnover $1M
% S&P/ASX 200 n/a
% All Ordinaries n/a
DDM Ranking #248/540
ESG Disclaimer Score (Ranking) n/a
GICS Industry Group Diversified Financials
BBY Technical View
– as at 22/09/2014Short Term Downtrend Resistance $1.00
Long Term Downtrend Support $0.961
AOD Share Price Performance
Aurora Dividend Income Trust
(Managed Fund)
AOD
A$0.97
TARGET PRICE
A$0.98
UNDERPERFORM
Aurora Sandringham Dividend Income Trust is a listed investment company incorporated in Australia. The Fund aims provide Unit holders with income returns in excess of the RBA Cash Rate whilst minimising capital risk. Neither, returns or capital are guaranteed. The Fund predominantly invests in the top 30 companies trading on the ASX.
Russell Wright
+61 2 9226 0091
rxw@bby.com.au
This Research has been prepared and issued by BBY Ltd and remains the property of BBY Ltd. No material contained in this Research may be reproduced or distributed without prior written approval of BBY, except as allowed by the Copyright Act. This Research is current at the date of publishing. For updates or further information regarding this research, please contact your advisor. BBY does or seeks to undertake business with companies covered in its research and therefore, Investors should consider this report as only a single factor in making their investment decisions. For explanations regarding ratings and other important disclosures, please refer to the disclosure section at the end of this document.
The second largest LIC by market capitalisation
Argo Investments Limited (ARG):
♦
is the second-largest LIC in Australia by market
capitalisation;
♦
trades at negligible 2.90% premium to NTA;
♦
has a reasonable 10-year TSR of 8.8%;
♦
has a creditable management expense ratio of 0.15%;
♦
charges no performance fees and is “benchmark
unaware”; and
♦
offers a modest 5.13% grossed up fully franked yield.
Ticker Company Name Weightings
WBC Westpac Banking Corporation 7.0%
ANZ Australia and New Zealand Banking Group Limited 6.1%
BHP BHP Billiton Limited 5.7%
WES Wesfarmers Limited 4.6%
TLS Telstra Corporation Limited 4.6%
CBA Commonwealth Bank of Australia 4.5%
NAB National Australia Bank Limited 3.8%
MLT Milton Corporation Limited 3.3%
RIO RIO Tinto Limited 3.0%
AUI Australian United Investment Company Limited 3.0%
WOW Woolworths Limited 2.9%
MQG Macquarie Group Limited 2.7%
ORG Origin Energy Limited 2.1%
CSL Csl Limited 1.6%
STO Santos Limited 1.4%
RHC Ramsay Health Care Limited 1.4%
AMP AMP Limited 1.4%
WPL Woodside Petroleum Limited 1.4%
Twenty-First Century Fox Incorporated 1.2%
SYD Sydney Airport 1.2%
Total 62.9%
Top 20 Investments as at 31 August 2014
Investment Aim
Maximise long-term returns to shareholders through a balance
of capital and dividend growth.
Company Data
Number of shares 664M
Market capitalisation $5,067M
Free Float (%) 94.8
12 month high/low $8.14/$6.75
Average monthly turnover $29M
% S&P/ASX 200 n/a
% All Ordinaries n/a
DDM Ranking #270/540
ESG Disclaimer Score (Ranking) n/a
GICS Industry Group Diversified Financials
BBY Technical View
– as at 22/09/2014Short Term Downtrend Resistance $8.07
Long Term Uptrend Support $7.52
ARG Share Price Performance
Argo Investments Limited
ARG
A$7.63
TARGET PRICE
A$7.69
UNDERPERFORM
Argo Investments Ltd is a listed investment company incorporated in Australia. The objective of the Company is to maximize long-term secure returns through a balance of capital and dividend growth. The Company invests in about 180 companies and trusts representing a cross section of Australian enterprises, including a number with substantial overseas operations.
Russell Wright
+61 2 9226 0091
rxw@bby.com.au
This Research has been prepared and issued by BBY Ltd and remains the property of BBY Ltd. No material contained in this Research may be reproduced or distributed without prior written approval of BBY, except as allowed by the Copyright Act. This Research is current at the date of publishing. For updates or further information regarding this research, please contact your advisor. BBY does or seeks to undertake business with companies covered in its research and therefore, Investors should consider this report as only a single factor in making their investment decisions. For explanations regarding ratings and other important disclosures, please refer to the disclosure section at the end of this document.
The fifth-largest LIC in Australia by market capitalisation
Australian United Investment Company Limited (AUI):
♦
is the fifth-largest LIC in Australia by market
capitalisation;
♦
trades at a modest 3.85% discount to NTA;
♦
has a healthy 10-year TSR of 10.0%;
♦
has a creditable management expense ratio of 0.11%;
♦
charges no performance fees and is “benchmark
unaware”; and
♦
offers a modest 5.38% grossed up fully franked yield.
Ticker Company Name Weight (%)
ANZ Australia and New Zealand Banking Group Limited 8.5
WBC Westpac Banking Corporation 7.6
CBA Commonwealth Bank of Australia 7.5
BHP BHP Billiton Limited 6.9
NAB National Australia Bank Limited 6.8
WES Wesfarmers Limited 5.8
RIO RIO Tinto Limited 5.5
WPL Woodside Petroleum Limited 4.9
DUI Diversified United Investment Limited 4.4
WOW Woolworths Limited 4.0
TCL Transurban Group 2.6
ORG Origin Energy Limited 2.2
CSL Csl Limited 2.1
OSH Oil Search Limited 2.0
ORI Orica Limited 1.9
BXB Brambles Limited 1.8
TLS Telstra Corporation Limited 1.5
STO Santos Limited 1.5
AHD Amalgamated Holdings Limited 1.4
AMP AMP Limited 1.4
SOL Washington H Soul Pattinson & Company Limited 1.3 Top 25 Investments as at 31 August 2014
Investment Aim
AUI seeks, through careful portfolio management, to reduce
risk and improve income from dividends and interest so as
to maintain and grow dividend distributions to shareholders
over the long term.
Company Data
Number of shares 109M
Market capitalisation $921M
Free Float (%) 42.9
12 month high/low $9.24/$7.50
Average monthly turnover $2M
% S&P/ASX 200 n/a
% All Ordinaries n/a
DDM Ranking #233/540
ESG Disclaimer Score (Ranking) n/a
GICS Industry Group Diversified Financials
BBY Technical View
– as at 22/09/2014Short Term Downtrend Resistance $8.84
Long Term Uptrend Support $8.33
AUI Share Price Performance
Australian United Investment
Company Limited
AUI
A$8.44
TARGET PRICE
A$8.67
UNDERPERFORM
Australian United Investment Company Ltd is an investment company incorporated in Australia. The objective of the Company is to reduce risk and improve income from dividends and interest over the long term. The Company primarily invests in shares of companies listed on the ASX based on their individual prospects for income and growth.
Russell Wright
+61 2 9226 0091
rxw@bby.com.au
This Research has been prepared and issued by BBY Ltd and remains the property of BBY Ltd. No material contained in this Research may be reproduced or distributed without prior written approval of BBY, except as allowed by the Copyright Act. This Research is current at the date of publishing. For updates or further information regarding this research, please contact your advisor. BBY does or seeks to undertake business with companies covered in its research and therefore, Investors should consider this report as only a single factor in making their investment decisions. For explanations regarding ratings and other important disclosures, please refer to the disclosure section at the end of this document.
A low market cap LIC focused on real estate fundamentals
Aurora Property Buy-Write Income Trust (AUP):
♦
is a bottom-tier LIC in Australia by market capitalisation;
♦
trades at a negligible 2.54% discount to NTA;
♦
has no published 10-year TSR yet, as inception was
only 4 July 2007. Its current return since inception is
1.22%;
♦
has a large management expense ratio of 1.03%;
♦
charges 10.25% performance fees on excess returns
above the S&P/ASX 300 AREIT (Accum) Index; and
♦
offers a healthy 7.98% grossed up fully franked yield.
Ticker Company Name
SCG
Scentre Group
SGP
Stockland
CQR
Charter Hall Retail Reit
CFX
CFS Retail Property Trust Group
WFD
Westfield Corporation
Top 5 Portfolio Holdings as at 30 June 2014
Investment Aim
The Aurora Property Buy-Write Income Trust (the Trust) is an A
trust that aims to generate income from an active strategy of se
a portfolio of ASX listed Australian Real Estate Investment Tru
Company Data
Number of shares 2M
Market capitalisation $13M
Free Float (%) n/a
12 month high/low $5.50/$5.21
Average monthly turnover $0M
% S&P/ASX 200 n/a
% All Ordinaries n/a
DDM Ranking #256/540
ESG Disclaimer Score (Ranking) n/a
GICS Industry Group Real Estate
BBY Technical View
– as at 22/09/2014Short Term Downtrend Resistance $5.37
Long Term Downtrend Support $5.32
AUP Share Price Performance
Trust
AUP
A$5.37
TARGET PRICE
A$5.44
UNDERPERFORM
Aurora Property Buy-Write Income Trust is a listed investment fund incorporated in Australia. The Fund aims to provide investors with income. The Fund purchases Australian listed property securities and then sells call options over these securities in order to provide additional income over the medium term. The Fund holds 10 securities, which will be equally weighted & rebalanced every 3 months.