Principles for determining regulatory
depreciation allowances
September 2003
The Allen Consulting Group ii The Allen Consulting Group Pty Ltd
ACN 007 061 930 Melbourne 4th Floor, 128 Exhibition St Melbourne VIC 3000 Telephone: (61-3) 9654 3800 Facsimile: (61-3) 9654 6363 Sydney
3rd Floor, Fairfax House, 19 Pitt St Sydney NSW 2000
Telephone: (61-2) 9247 2466 Facsimile: (61-2) 9247 2455
Canberra
Level 12, 15 London Circuit Canberra ACT 2600
GPO Box 418, Canberra ACT 2601 Telephone: (61-2) 6230 0185 Facsimile: (61-2) 6230 0149
Perth
Level 25, 44 St George’s Tce Perth WA 6000 Telephone: (61-8) 9221 9911 Facsimile: (61-8) 9221 9922 Online Email: allcon@allenconsult.com.au Website: www.allenconsult.com.au Disclaimer:
While The Allen Consulting Group endeavours to provide reliable analysis and believes the material it presents is accurate, it will not be liable for any claim by any party acting on such information.
The Allen Consulting Group iii
Contents
Section A
Purpose, Overview and Conclusions
1
Purpose and Structure 1
Recommendations 2
Section B
Guiding Principles for Regulatory Depreciation
3
Economic Efficiency 3
Other Principles 4
Section C
Implications of these Objectives for Regulatory Depreciation
5
Economic Efficiency 5
Other Principles – Price Stability and Intergenerational Equity 9 Section D
Implications for IPART’s Review of Electricity Distribution Charges11
Conclusion on Principles 11
Recommendations 13
Attachment A
Financial Capital Maintenance Vs Operating Capability Maintenance14
Attachment B
What is the Relevance of the Contestable Market Standard and
DORC?
18
Attachment C
Back-Ended Depreciation, Vintages of Assets and ‘Switching’
Methods
20
Impact of Vintages 20
PR I N C I P L E S F O R R E G U L A T O R Y D E P R E C I A T I O N: NO T E T O I P A R T
The Allen Consulting Group 1
Section A
Purpose, Overview and Conclusions
Purpose and Structure
The purpose of this note is to discuss the guidance that may be obtained from economic and other principles for the derivation of the allowance for regulatory depreciation to be factored into revenue benchmarks (and hence, regulated charges). Observations are then made on the derivation of regulatory depreciation allowances for the next regulatory period for the NSW electricity distributors (that is, future depreciation), and on the value that is taken as regulatory depreciation for the previous regulatory period.
The structure of this note is as follows.
Section B discusses the relevant objectives the Tribunal typically pursues when determining regulated charges and all components thereof, which include economic efficiency, intergenerational equity and price stability, administrative simplicity and certainty and consistency (and ease of replicability). Attachment A also addresses whether any implications for regulatory depreciation can be drawn from the debate in the accounting literature, which is whether the most appropriate standard for presenting the financial performance is one that is based upon maintaining its financial capital intact, or maintaining its operating (physical) capability.
Section C then discusses the implications of economic efficiency and price stability and intergenerational equity for the derivation of regulatory depreciation allowances in detail. Attachment B discusses in more detail an important issue for the derivation of a regulatory depreciation allowance for the whole of a firm – which is the effect of different depreciation methodologies where there are vintages of assets.
Attachment C discusses a related issue, which is whether there are merits in setting regulatory depreciation so that prices mimic the outcome of a perfectly contestable market over time. A contestable market outcome would follow (approximately) by setting regulatory depreciation so that the regulatory asset bases of the distributors track the depreciated optimised replacement costs of their assets over time. The conclusion is that the contestable market standard is not the same as efficiency – and may produce results that are clearly inefficient.
Section D then summarises the implications of the objectives for regulatory depreciation, and presents recommendation for the derivation of regulatory depreciation for the NSW electricity distributors for the next regulatory period, as well as for the adjustment for depreciation that is made when updating the regulatory values of the distributors’ assets to the start of the next regulatory period. These recommendations are reproduced next.
PR I N C I P L E S F O R R E G U L A T O R Y D E P R E C I A T I O N: NO T E T O I P A R T
The Allen Consulting Group 2
Recommendations
Forward-Looking Depreciation Allowances
The current approach – straight-line depreciation in inflation-indexed terms – should be retained, unless the distributors present a convincing case that a more accelerated return of capital is required to ensure all costs can be expected to be recovered over the economic lives of the assets.
• It is possible that such an approach is consistent with economic efficiency – which would reflect a view that congestion is typically localised and generally occurs at different parts of the network at different times – although the precise implications of economic efficiency for the determination of regulatory depreciation are unclear.
• Straight-line depreciation may be expected to generate reasonably constant prices over the long term.
• A change to the current depreciation method for existing assets (i.e. to back-end depreciation) may imply much lower prices than would have occurred under the alternative regime – and higher prices in the future.
• The application of straight-line depreciation is simple, consistent with what has been done in the past, and consistent with that applied to all other regulated energy distributors serving mature markets.
In addition, to the extent that congestion on the network is becoming more widespread, then economic efficiency would suggest that prices should be raised to signal to customers the scarcity of capacity – which should be achieved through advancing (not deferring) depreciation, if required.
In recommending that (inflation-indexed) straight-line depreciation continue to be used, we would also recommend that the application of the methodology be revised over time as more information becomes available. In particular, this would imply using updated information about the expected remaining lives of the various assets when determining the forward-looking depreciation allowances.
Regulatory Depreciation over the Previous Regulatory Period
With respect to the updating of the regulatory asset bases for regulatory depreciation over the previous regulatory period, the most important principle is consistency with the assumptions reflected in the price controls for the previous regulatory period, with the other relevant objectives being simplicity and efficiency.
There is no rationale to countenance any reopening of the effective lives or depreciation method that was used to determine regulated charges for the previous regulatory period. To do would merely provide the regulated entities with obvious gaming opportunities, with little implication for economic efficiency.
PR I N C I P L E S F O R R E G U L A T O R Y D E P R E C I A T I O N: NO T E T O I P A R T
The Allen Consulting Group 3
Section B
Guiding Principles for Regulatory
Depreciation
Economic Efficiency
The implications of economic efficiency for the setting of regulated charges that may have an implication for the determination of the regulatory depreciation methodology include the following:
• Efficient pricing – prices be consistent with signalling to customers the relative scarcity of ‘resources’ used to provide network services. This condition ensures customers’ decisions about whether to connect to the network or to use the system at a particular time are also socially optimal decisions.
• Efficient investment – investors be provided with the incentive to invest in long-lived assets that will be required to ensure that the service continues to be provided at the desired service levels over the long term.
• Efficient production – the regime encourages the selection of the least-cost means of providing the relevant level of service, and that the construction and ongoing operation and maintenance be undertaken in a least-cost manner. The first condition – efficient pricing – implies that average prices should limit the scope for the regulated entity to make unnecessarily high returns (as higher prices inevitably depress upstream and downstream activity). It also implies that costs caused by customers’ decisions are reflected in the prices that they face. Signalling the costs caused by decisions in prices will encourage users of the system to change their usage patterns (where such a change would be efficient) and, in turn, reduce the overall cost of providing the regulated services.
• For electricity distribution, however, it needs to be borne in mind that congestion on the network is often localised. Efficient pricing implies signalling the relative availability of capacity in different locations, so that customers take account of the relative costs caused by society by locating in different areas.
The combination of the first and the second condition (efficient pricing and sufficiency of returns) is normally taken as implying that the regulated charges should be designed such that investors would expect to recover the cost of efficient investments.
The third condition requires the regime to provide the regulated entity with incentives to invest and operate efficiently, one tool for which is price cap regula tion, which is promoted for NSW electricity distribution (amongst other things) through price cap regulation. The optimal incentive (i.e. the length of time over which prices are permitted to diverge from cost) involves a trade -off – stronger incentives may promote higher productive efficiency, but also create higher risk that prices will exceed cost (and so reduce activity in related markets) or fall below cost (and so threaten continued investment).
PR I N C I P L E S F O R R E G U L A T O R Y D E P R E C I A T I O N: NO T E T O I P A R T
The Allen Consulting Group 4
The first two of these conditions are relevant to the determination of the future regulatory depreciation allowances, while the third condition is relevant to the determination of regulatory depreciation allowances in the previous regulatory period.
Other Principles
The other principles that the Tribunal typically has considered relevant to the derivation of regulatory depreciation allowances include the following:
• Price stability and intergenerational equity – the regulatory depreciation profile simultaneously sets the time profile of prices, and the allocation of the costs associated with the network between customers of today and the future. All else constant, a lower variance in prices over time and more equal inter-temporal allocation of common costs across customers may be preferred.
• Administrative simplicity – as discussed further below, the derivation of the optimal approach for regulatory depreciation may be a complex task. All else constant, a simple approach that is considered to approximate a more complex calculation should be preferred.
• Certainty and consistency – the efficiency of investment in both the regulated service and in upstream and downstream activities are enhanced by consistency in decisions across time, and – in the absence of strong grounds otherwise – adherence to previous commitments. The ease with which an approach can be replicated from one regulatory period to the next may be an important contributor to certainty and consistency.
PR I N C I P L E S F O R R E G U L A T O R Y D E P R E C I A T I O N: NO T E T O I P A R T
The Allen Consulting Group 5
Section C
Implications of these Objectives for
Regulatory Depreciation
The regulatory depreciation allowance is the return of capital to investors over the life of the asset. A general result (but subject to some caveats – discussed below) is that the profile of regulatory depreciation determines only the time profile of tariffs over the life of an asset – it does not change the value of the resulting revenue stream.1
• Thus, subject to the caveat discussed below, any depreciation method can be consistent with encouraging efficient investment.
• The choice between the different depreciation profiles then depends upon the time profile of charges that is produced – and, in particular, how that expected time profile of charges compares to the objectives discussed above.2 A point that needs to be borne in mind when assessing different depreciation methods, however, is that much of the analysis of depreciation methods in the economic literature focuses on single assets. However, the regulatory depreciation allowance for a utility will reflect the contribution of a portfolio of assets, all of different vintages. The implications of ‘portfolio’ and ‘vintage’ effects are also discussed below.
Economic Efficiency
The Lower Bound – Economic Depreciation (the Caveat)
In most applications in financial economics, the appropriate measure of depreciation is the rate of economic depreciation. Economic depreciation can be defined as the change in the market value of an asset between two points in time (adjusted for cash flows into or distributions from the relevant financial asset over that period).
However, where monopoly assets are regulated, the concept of economic depreciation is circular, as the rate of economic depreciation will reflect the depreciation methodology that is selected by the regulator. This reflects the fact that the selected regulatory depreciation profile determines the future regulatory value of the business – and hence, the change in the value of the asset over that period.
1
This outcome is demonstrated in: Schmalensee, R (1989), ‘An Expository Note on Depreciation and Profitability Under Rate-of-Return Regulation’, Journal of Regulatory Economics, Vol 1, pp.293-298). More generally, any revenue stream that has a net present value of zero can be expressed in terms of a ‘building block’ revenue calculation (i.e. as the sum of return on assets, depreciation and operating expenses), where the sum of the depreciation allowances over time equal the original cost of the asset. Note that under historical cost accounting (nominal WACC), the money of the day values will sum to the original cost, whereas if an inflation-indexed accounting convention is used (real WACC), the sum of regulatory depreciation allowances expressed in constant price terms will equate to the original cost of the asset.
2
It is important to note that the profile of regulatory depreciation and the profile of prices will not (at least not necessarily) be the same – but just that there is a one-to-one relationship between prices and depreciation.
PR I N C I P L E S F O R R E G U L A T O R Y D E P R E C I A T I O N: NO T E T O I P A R T
The Allen Consulting Group 6
The one caveat to the circularity in the concept of economic depreciation is that the asset owner must expect to recover the whole of the value of the regulatory asset base over its economic life (this is required to ensure that the second condition for economic efficiency – efficient investment – is met). A regulated entity’s ability to recover capital in the future will be dependent on the prices that it will be able to charge, which in turn would be dependent on the actual competition that it may face in the future. While electricity distributors clearly have the ability to set prices that permit the recovery of the whole of their revenue requirements (and more) at present, it is conceivable that technological changes may expose distribution to more actual competition in the future.
To the extent that actual competition may be expected to provide a constraint to a distributors’ ability to set prices in the future, then the concept of economic depreciation imposes a lower bound to the rate of regulatory depreciation. In particular, the rate of regulatory depreciation should be sufficient to ensure that a regulated entity would expect to recover its costs in the future, taking account of the potential constraints imposed by future competitors.3
• Note that a higher rate of regulatory depreciation (and hence higher prices) now would imply that a regulated entity would be able to set lower charges in the future and still recover all of its costs.
In practice, however, it is questionable whether future actual competition from an alternative network would place much of a constraint on the prices that the NSW electricity distributors would be permitted to charge, at least given the existing approach to regulatory depreciation.
• This is because existing prices are probably not too dissimilar to that of a hypothetical (efficient) new entrant, and because the strong economies of scale, scope and density in distribution implies that average prices would probably need to be much higher than efficient (whole -of-system) new entrant levels before the threat of substantial bypass (that is, a threat from competing networks) from of the system was a material possibility.
That said, the more relevant form of competition for electricity networks in the future may derive from alternative means of providing the delivered energy service – such as embedded (or micro) generation.
• Note, however, that the threat from embedded generation is likely to be localised. Thus, the extent to which embedded generation affects a distributor’s ability to recover its costs in total depends upon whether a regulator permits it to reallocate its costs to other customers. If the regulator requires costs to be quarantined in specific regions, this would imply higher lower bound to regulatory depreciation.
Accordingly, it is important to keep in mind the likely future competition to NSW electricity distribution when assessing regulatory depreciation.
3
The impact of future competition on the permissible regulatory depreciation profiles was analysed in: Crew, M and Kleindorfer, P (1992), Economic Depreciation and the Regulated Firm under Competition and Technological Change’, Journal of Regulatory Economics, Vol 4, pp.51-61.
PR I N C I P L E S F O R R E G U L A T O R Y D E P R E C I A T I O N: NO T E T O I P A R T
The Allen Consulting Group 7
• One means of doing this is to project forward regulated prices under plausible assumptions about future expenditure requirements, and to form a view about whether there is any material likelihood of alternative technologies competing and taking a substantial part of the distributors’ loads.
• Alternatively, if the principle that regulatory depreciation should reflect future competitive threats is stated, it should be possible to rely upon the distributors to make a case that such a threat exists and that, as a consequence, a faster rate of regulatory depreciation is required.
Above the Lower Bound – Economic Efficiency – Single Asset Business The concept of economic efficiency provides further insights for the rate of regulatory depreciation than specifying a lower bound – although it is a complex matter to implement these insights.
As discussed above, there is a one-to-one relationship between the price level (at least on average) and regulatory depreciation – and as a consequence, the efficient regulatory depreciation profile can be defined as the depreciation profile that is consistent with delivering efficient prices. Thus, the concept of an efficient price – but more importantly, how this efficient price may vary over time – needs to be understood.
The theoretically efficient price for the use of any facility is short run marginal cost,4 which for infrastructure assets is typically very low while the facility is unused, but reflects the value of the service to the marginal user during congestion (such a charging approach is known as ‘peak load pricing’). The implication of ‘peak load pricing’ is that all of the fixed costs would be recovered during times of congestion. This, in turn, implies that depreciation should only be factored into charges at times of congestion.5
• What this means about the depreciation method is complex. Where assets are initially underutilised but demand grows over time, the recovery of capital should be deferred initially (i.e. to the period when the asset is congested). However, the optimal deferral period depends upon how long it takes for the asset to be fully utilised and for the next increment to be installed (and then how long it takes for the subsequent increment to capacity to become congested etc). The initial deferral of depreciation suggests that the optimal depreciation profile may be back-ended,7 but an unambiguous conclusion is not possible.
4
An alternative paradigm for charging is long-run marginal cost (LRMC). This is the increase in the forward-looking cost of providing the service that is caused by an increase in the use of a particular asset, which in turn is the increase in the discounted cost associated with bringing forward future planned investments. While LRMC results in some of the fixed costs being recovered when the asset is not congested under, LRMC also increases at the time of the next increment draws nearer. Accordingly, the timing of depreciation under SRMC and LRMC would be expected to be similar.
5
This is the conclusion in: Baumol, W (1971), ‘Optimal Depreciation Policy: Pricing the Products of Durable Assets’, The Bell Journal Economics and Management Science, Vol 2, pp.645. A recovery of fixed cost only arises in non-congested times when the intensity of use of the asset causes its service potential to decline, in which case the value of the reduction in service potential in the period should be reflected in deprec iation (this cost is referred to as the ‘user cost’). In contrast, any decline in service potential that is unrelated to the intensity of use of the asset should have no effect on the timing of the recovery of fixed costs.
7
The term ‘back-ended’ is used to refer to a depreciation profile under which more than half of the real value of the investment is returned to investors in the second half of its expected life.
PR I N C I P L E S F O R R E G U L A T O R Y D E P R E C I A T I O N: NO T E T O I P A R T
The Allen Consulting Group 8
It is important to note that ‘peak load pricing’ would only expect to recover the cost of an increment to capacity where increments are added in fairly small lumps – or more specifically, where there are not large cost savings from installing a much large increment to capacity.8 In the latter case, peak load pricing would fail to recover all costs, and so a residual would need to be recovered. Efficiency would require to be spread over customers and over time in a way that least distorts demand from the efficient level.
• Note that even where there is a residual to be recovered, some or much of the cost of an asset would be expected to be recovered at peak times – and the more cost that is recovered at peak times, the closer the implications are to the ‘peak load pricing’ model, discussed above.
The recovery of this residual is likely to imply a degree of back-ending of depreciation, given that usage patterns are likely to be least distorted if any mark-up on prices is approximately equalised over the life of the asset.9 Growing demand would exacerbate the argument for back-ending, although rising operating costs as assets age would be an offsetting factor. Note, however, that the importance of equalising the effect on prices over time will also depend upon the efficiency impact of recovering the residual at any point in time – which in turn depends upon whether the utilities are able to set efficient (non-linear) prices. A conclusion to be drawn from the above are that the derivation of the theoretically efficient regulatory depreciation approach for a single asset business would be a very complex task – requiring knowledge, amongst other things, of the expected pattern of congestion over the life of the asset. However, as a general rule, we can say that the appropriate response to emerging congestion on an asset would be to increase the rate of recovery of capital (which is a consequence of permitting prices to rise to signal the value of congested assets). Intuition also suggests that, in general, the optimal recovery of fixed costs (through depreciation) may back-ended, although an unambiguous conclusion is not possible .
Above the Lower Bound – Economic Efficiency – Portfolio of Assets
Where an entity has a portfolio of assets, the optimal regulatory depreciation for the entity as a whole will reflect the extent of congestion across this whole portfolio of assets. The computation of such an amount would be too complex a task to attempt; however, intuition may provide some guidance.
First, if congestion is localised, and occurs at different intervals, it is possible that the optimal depreciation may be approximately constant over time. That is, it is possible that different areas become congested at different times, and so different areas provide the ‘return of capital’ at any time – but that, in aggregate, the ‘return of capital’ is reasonably constant.
As straight-line depreciation returns capital evenly over the life of an asset, a back-ended depreciation profile implies that depreciation is deferred compared to straight-line depreciation. 8
For electricity distribution, short run marginal cost pricing may recover most of the cost associated with the addition of transformers at zone substations (which come in fairly small increments), but leave a residual to be recovered for assets like new subtransmission lines, which display large economies of scale (and thus are likely to be [optimally] added in large lumps).
9
Burness and Patrick (1992) derived back-ended depreciation as a general result for price regulated utilities in a model that appeared implicitly to assume excess capacity over the life of the asset (Burness, H, Patrick, R (1992), ‘Optimal Depreciation, Payments to Capital, and Natural Monopoly Regulation’, Journal of Regulatory Economics, Vol 4, p.45).
PR I N C I P L E S F O R R E G U L A T O R Y D E P R E C I A T I O N: NO T E T O I P A R T
The Allen Consulting Group 9
• This conclusion would imply that efficient pricing would be achieved through the allocation of costs between different regions at any point in time, rather than through the amount of capital in aggregate that is returned to investors at any point in time. This intuition would also provide support for the use of (or at least, not rule out) straight-line (inflation-indexed) depreciation.
Secondly, to the extent that substantial areas of the network were expected to become congested at the same time, then depreciation as a whole should be increased – that is, depreciation should be used to permit prices to rise to the level required to signal the value of scarce capacity.
Thirdly, to the extent that short run marginal cost charging is expected to lead to a large unrecovered residual cost, depreciation that facilitates more stable prices over time in aggregate should be preferred.
The depreciation consistent with the goal of price stability is discussed next.
Other Principles – Price Stability and Intergenerational Equity
Single Asset Business
In contrast to economic efficiency, the objective of more stable prices over time is more easily to apply in practice.
For a single asset business, if (amongst other things) operating costs and demand are constant, then a real annuity would be consistent with constant prices in real terms. However, the following factors are also relevant.
• Where demand is ris ing (i.e. there is initial underutilisation of an asset), then depreciation would need to be back-ended compared to an annuity to retain constant prices.
• Where operating and maintenance costs rise as the asset ages, then depreciation would need to be advanced compared to an annuity in order to retain constant prices.
• Where replacement costs are rising (which is likely for electricity distribution), then an annuity will preserve prices in real terms while an asset remains in existence – but then there will be a discreet jump in prices at the time of replacement. If the discreet jump in prices at the time of asset replacement is to be avoided, then a real increase in prices over the life of an asset would be required – which would imply back-ended depreciation compared to an annuity.
Portfolio of Assets with Different Vintages
However, as with the discussion on economic efficiency, the impact on average prices across the whole network from different regulatory depreciation methods will reflects the aggregate impact of any change in methods across all vintages of assets.
PR I N C I P L E S F O R R E G U L A T O R Y D E P R E C I A T I O N: NO T E T O I P A R T
The Allen Consulting Group 10
The effect of vintages of assets on the average price across a network is discussed in Attachment C. The relevant conclusions of that analysis are as follows.
• First, the average price level under the different depreciation approaches will depend upon the average life of the assets – reflecting the fact that while back-ended depreciation implies lower prices early in the life of an asset, the flip-side is higher prices later in the asset’s life.
– By way of example, if the weighted average useful life of all assets is 40 years, straight-line depreciation would be expected to imply lower prices across the network than annuity depreciation if, on average, the assets are more than about a quarter of the way through their useful lives.
• Secondly, while annuity depreciation will generate prices that will remain constant (assuming operating costs are constant), other depreciation methods will also generate prices that remain constant if the weighted average life of assets (as a proportion of useful life) remains constant. For straight-line depreciation, prices will rise over time if assets are getting younger on average, but fall over time if assets are getting older on average.
– However, this tendency for newer assets to imply higher prices may be offset by the tendency for newer assets to require less maintenance and to be cheaper to operate (and vice versa for ageing assets).
• Thirdly, a change from one form of depreciation methodology (say, from straight-line) to a more back-ended methodology (say, annuity) part way through the life of an asset will imply much lower prices at the time of the change – but much higher prices towards the end of the asset’s life – than had annuity depreciation been applied from the commencement of the asset’s life. – That is, switching to a preferred methods midway through the life of an asset will result in prices over the remaining life of the asset that differ substantially from those consistent with the preferred method.
The practical implications of these findings include the following.
• First, it is likely that existing average prices in NSW – which are a product of straight-line depreciation – are lower than would have been implied by annuity depreciation had this methodology always been applied to set prices, given the average age of the NSW electricity distribution assets.
• Secondly, while it is an empirical matter, the current approach – straight-line depreciation – may be expected to result in reasonable constant prices over the longer term.
• Thirdly, there should be a presumption against changing depreciation methodologies part way through the life of an asset, given the potential adverse implications for the time-path of prices from such switching.
PR I N C I P L E S F O R R E G U L A T O R Y D E P R E C I A T I O N: NO T E T O I P A R T
The Allen Consulting Group 11
Section D
Implications for IPART’s Review of Electricity
Distribution Charges
This section draws out the implications for regulatory depreciation of the theoretical principles discussed above. It is divided into two sections, the first addresses the implications for the future regulatory depreciation allowances, and the second addresses the implications for the regulatory depreciation that is used to update the regulatory asset bases to the start of the next regulatory period.
Conclusion on Principles
First, the conclusions from the discussion of the principles above can be summarised as follows.
Economic Principles
Economic efficiency provides one concrete rule for regulatory depreciation – which is that regulated entities should be permitted to recover their capital at a sufficiently fast rate that they will be able to recover all costs, given the potential for future competition from both network and non-network solutions.
Beyond the rule above, the discussion of the economic principles above suggests that the task of deriving the optimal depreciation methodology would be very complex, given that the optimal depreciation methodology requires knowledge (amongst other things) of the timing of future congestion across the whole portfolio of assets.
However, if congestion is localised, and occurs at different intervals, it is plausible that the optimal depreciation may be approximately constant over time.
• This conclusion would imply that efficient pricing would be achieved through the allocation of costs between different regions at any point in time, rather than through the amount of capital in aggregate that is returned to investors at any point in time. This intuition would also provide support for the use of (or at least, not rule out) straight-line (inflation-indexed) depreciation.
Secondly, to the extent that substantial areas of the network was expected to become congested at the same time, then depreciation as a whole should be increased – that is, depreciation should be used to permit prices to rise to the level required to signal the value of capacity.
Thirdly, to the extent that short run marginal cost charging is expected to lead to a large unrecovered residual cost, depreciation that facilitates more stable prices over time in aggregate should be preferred.
PR I N C I P L E S F O R R E G U L A T O R Y D E P R E C I A T I O N: NO T E T O I P A R T
The Allen Consulting Group 12
Intergenerational Equity and Price Stability
First, it is likely that average prices in NSW are lower – which are a product of straight-line depreciation – are lower than would have been implied by annuity depreciation had this methodology always been applied to set prices, given the average age of the NSW electricity distribution assets.
Secondly, while it is an empirical matter, the current approach – straight-line depreciation – may be expected to result in reasonable constant prices over the longer term.
Thirdly, there should be a presumption against changing depreciation methodologies part way through the life of an asset, given the potential adverse implications for the time-path of prices from switching methodologies for such assets.
Administrative Simplicity, Consistency and Certainty
This principle implies that the choice of methods should be limited to one of the depreciation methods taken from the accounting field. In particular, a computation of the type required to determine the economically efficient regulatory depreciation profile should be avoided.
PR I N C I P L E S F O R R E G U L A T O R Y D E P R E C I A T I O N: NO T E T O I P A R T
The Allen Consulting Group 13
Recommendations
Forward-Looking Depreciation Allowances
The current approach – straight-line depreciation in inflation-indexed terms – should be retained, unless the distributors present a convincing case that a more accelerated return of capital is required to ensure all costs can be expected to be recovered over the economic lives of the assets.
• It is possible that such an approach is consistent with economic efficiency – which would reflect a view that congestion is typically localised and generally occurs at different parts of the network at different times – although the precise implications of economic efficiency for the determination of regulatory depreciation are unclear.
• Straight-line depreciation may be expected to generate reasonably constant prices over the long term.
• A change to the current depreciation method for existing assets (i.e. to back-end depreciation) may imply much lower prices than would have occurred under the alternative regime – and higher prices in the future.
• The application of straight-line depreciation is simple, consistent with what has been done in the past, and consistent with that applied to all other regulated energy distributors serving mature markets.
In addition, to the extent that congestion on the network is becoming more widespread, then economic efficiency would suggest that prices should be raised to signal to customers the scarcity of capacity – which should be achieved through advancing (not deferring) depreciation, if required.
In recommending that (inflation-indexed) straight-line depreciation continue to be used, we would also recommend that the application of the methodology be revised over time as more information becomes available. In particular, this would imply using updated information about the expected remaining lives of the various assets when determining the forward-looking depreciation allowances.
Regulatory Depreciation over the Previous Regulatory Period
With respect to the updating of the regulatory asset bases for regulatory depreciation over the previous regulatory period, the most important principle is consistency with the assumptions reflected in the price controls for the previous regulatory period, with the other relevant objectives being simplicity and efficiency.
There is no rationale to countenance any reopening of the effective lives or depreciation method that was used to determine regulated charges for the previous regulatory period. To do would merely provide the regulated entities with obvious gaming opportunities, with little implication for economic efficiency.
PR I N C I P L E S F O R R E G U L A T O R Y D E P R E C I A T I O N: NO T E T O I P A R T
The Allen Consulting Group 14
Attachment A
Financial Capital Maintenance Vs Operating
Capability Maintenance
The purpose of the depreciation allowance discussed in this note is very specific – it is an input into the determination of regulated charges. Accordingly, the derivation of the depreciation allowance for regulatory purposes should be undertaken against the principles or objectives discussed above.
However, a number of Australian regulators have referred to a debate from the financial accounting field when considering the role of regulatory depreciation,10 which is the debate about the most appropriate measure of income for financial accounting purposes: whether income should be measured on the basis of the “financial capital maintenance” concept, or on the basis of the “operating (or physical) capital maintenance” concept. This debate has been discussed by a number of Australian regulators, including in papers released by the Tribunal. The differences between the options for the measurement of income are as follows:
• Financial capital maintenance – in which income is defined as the surplus after a sufficient amount has been reserved to maintain the financial value of the business or asset; and
• Operating (physical) capability maintenance – in which income is defined as the surplus after a sufficient amount has been reserved to maintain the
physical capability of the asset.
The key differences between the options, therefore, are the meaning of depreciation and the basis of asset valuation. Under financial capital maintenance, depreciation is just the return of the original cost of the investment and the book value represents the financial value. In contrast, under operating capital ma intenance, depreciation is a provision sufficient to fund replacement of the existing assets when they expire, and the book value reflects the depreciated replacement cost of the current assets.
Either of these approaches could be used to guide the setting of regulated charges. The financial capital maintenance approach most closely resembles the accounting convention that regulators have used when setting regulated charges – and no modification to current practice would be required. To set regulated charges based upon the operating capital maintenance approach, a number of modifications would be required, which include:
• to base depreciation charges on the full replacement cost of the asset;
• to revalue the regulatory asset base at the depreciated replacement cost of the asset at price reviews;
10
The Tribunal has referred to this debate in a previous publication: Independent Pricing and Regulatory Tribunal, Rolling Forward and Regulatory Asset Bases of the Electricity and Gas Industries, Discussion Paper, January 1999. The Victorian ESC and the South Australian ESC have also noted this FCM vs OCM debate.
PR I N C I P L E S F O R R E G U L A T O R Y D E P R E C I A T I O N: NO T E T O I P A R T
The Allen Consulting Group 15
• to escalate prices (and the regulatory asset base) by a price index measuring the change in electricity distribution capital costs rather than the general CPI; and
• to either adjust the regulatory WACC (or to achieve the same effect by adjusting the revenue benchmark) to account for the projected holding gains or losses if capital costs are expected to move at a different rate to prices generally.
The main implication of a move to an operating capability maintenance approach would be that investors would be exposed to the risk associated with the unpredicted changes in capital costs relative to prices generally over time. A second implication is that the operating capability standard method would only be expected to deliver a stream of cash flow with a present value equal to the opening regulatory asset base if the opening regulatory asset base was set at the depreciated replacement cost of the assets.
• To the extent that the regulatory asset base commenced at a value that was below the depreciated replacement cost of the assets, then the regulated entity would receive a windfall gain from subsequent depreciation allowances.
• Indeed, the prospect of deriving depreciation consistent with the operating capability maintenance standard noted by the then Monopolies and Mergers Commission as a reason the change from the (partly)11 operational capability approach that was used to set Transco’s regulated charges for the regulatory period prior to 1997/98 to one consistent with the financial capital maintenance standard:12
Depreciation can be regarded either as a means of financing replacement of assets or as a return of capital. By allowing for a full depreciation charge, the 1993 MMC report effectively allowed in charges for customers for the full cost of replacing the assets owned by BG in December 1991. The Director General is, however, in our view correct in arguing that, by allowing full depreciation on these assets, the full replacement value of the assets would be returned to the company over time, providing shareholders with a significant gain over the investment they made in relation to these assets. We believe that the 1993 MMC approach would therefore have the effect of producing prices higher than is necessary to enable BG to finance its activities over the period under review.
11
In the regulatory period than ended in 1996/97, Transco’s regulatory depreciation was calculated with reference to the full replacement cost of the assets ( i.e. OCM) but the return on assets component was (effectively) provided on the regulatory asset base, which was only about 60 per cent of the depreciated replacement cost of the assets (i.e. like FCM). The Monopolies and Mergers Commission commented at the subsequent review that ‘[t]he allowance for full depreciation in revenue can be regarded as consistent with the ‘operating capability maintenance’ (OCM) approach of CCA’: Monopolies and Mergers Commission, BG Plc: A Report under the Gas Act 1986 on the Restrictions of Prices for Gas Transportation and Storage Services, 1997, p.36.
12
Monopolies and Mergers Commission, BG Plc: A Report under the Gas Act 1986 on the Restrictions of Prices for Gas Transportation and Storage Services, 1997, p.42.
PR I N C I P L E S F O R R E G U L A T O R Y D E P R E C I A T I O N: NO T E T O I P A R T
The Allen Consulting Group 16
The financial capital maintenance concept clearly is more closely aligned with the conditions required for future investment, as discussed above. This is because a condition for efficient investment is that funds efficiently invested be returned over time (and earn a risk-adjusted return in the meantime) – the protection of a notional measure of operational capability is irrelevant. In addition, exposing investors to the technology risk and market risk that would flow from the operating capability maintenance standard is not considered to provide incentives for more efficient investment that would offset the additional risk generated. This is because many of these events that would affect the future regulatory asset base of the businesses under the operating capability approach would be outside of the control of the businesses.13 Lastly, there would be little merit in creating a windfall gain for companies that currently have a regulatory asset base that is below its depreciated replacement cost.
Accordingly, to the extent that the issue is relevant to the determination of regulated charges, the financial maintenance concept is the more relevant accounting standard. The universal regulatory approach for energy distribution in Australia is to set regulated charges using an accounting convention that mimics financial capital maintenance.
Subject to the caveat noted in the paragraph below, a number of parallels for the setting of regulated charges can be drawn from the accounting concept of financial capital maintenance.
• One important parallel comes from the observation that – under financial capital maintenance – the value of the investment is independent of the individual physical assets. For regulation, this implies that the aggregate value of the regulatory asset base and the aggregate level of regulatory depreciation are the relevant parameters, rather than amounts attributed to individual assets.
• A second important parallel follows directly from the role of depreciation – regulatory depreciation is the return of funds that the regulated entity has invested previously, and so future replacement expenditure needs are irrelevant to the determination of regulatory depreciation.
• A third – and related – parallel concerns how incentives are provided for replacement expenditure. Whereas under operating capability maintenance, the cost of replacement expenditure is effectively recovered through depreciation charges, under financial capital maintenance it is recovered through future revenue streams – that is, the return on and return of that investment after the replacement investment has been made.14
13
If it is considered that exposing the regulated entities to some longer term market risk in order to encourage events that may occur outside of the price control period to be factored into current decision making, then a more targeted regulatory tool would be more appropriate. 14
It has been suggested that regulators need to provide regulated entities with a revenue stream that is set at the greater of the revenue calculated under the financial capital maintenance and operating capability maintenance approaches (see, for example, Ergas, H, Some Economic Aspects of Asset Valuation, June 2000, pp.5-6), which is incorrect. The incentive for efficient investment can be preserved under either approach. The requirement for a regulator to have regard to both approaches would only imply that there would be a switch from one accounting convention (for the setting of regulated charges) to another when the switch implied a windfall gain to the regulated entity.
PR I N C I P L E S F O R R E G U L A T O R Y D E P R E C I A T I O N: NO T E T O I P A R T
The Allen Consulting Group 17
However, as noted at the outset, the relevance of debates from the financial accounting field should not be over-emphasised. The debate behind the relative merits of the financial capital and operating capability maintenance in the financial accounting field revolves around which approach is likely to deliver the closest approximation for economic income. For regulated assets, however, the debate over the best proxy for economic income has little relevance. Rather than seeking to measure economic income, the act of price regulation effectively determines economic income.15 As noted above, the relevant objectives for selecting the most appropriate regulatory depreciation method is not to derive a better measure of economic income, but rather to promote economic efficiency (amongst other things). Accordingly, there should be no presumption that accounting conventions developed for other purposes are appropriate for setting regulated charges – and argument based upon economic efficiency should override any of the implications drawn from accounting debates.
15
As discussed above, subject to the constraint that a regulated entity always be able to set prices that recover its revenue requirement, any regulatory depreciation schedule is also economic depreciation.
PR I N C I P L E S F O R R E G U L A T O R Y D E P R E C I A T I O N: NO T E T O I P A R T
The Allen Consulting Group 18
Attachment B
What is the Relevance of the Contestable
Market Standard and DORC?
An alternative approach for depreciation would be to seek to have prices follow the path that would be consistent with the price that would be charged by a hypothetical (efficient) new entrant. This could be achieved (approximately) by determining the regulatory depreciation allowance so that the regulatory asset bases of the electricity distributors followed the depreciated optimised replacement cost (DORC) for the relevant networks over time. This method would generate a unique answer for regulatory depreciation, which could be estimated – and could claim as being consistent with the outcomes of a perfectly contestable market. However, a reasonable question is: would such a depreciation schedule have a claim to being economically efficient?
The answer to this question is ‘no’ – and that, in some circumstances, setting depreciation so that the regulatory asset bases follow the projected DORC value over time could generate inefficiency.
The time profile of prices implied by the hypothetical (efficient) new entrant standard would be affected by some of the factors, noted above. However, many of these factors would have the opposite effect on the rate of depreciation that would be consistent with economic efficiency.
• Under the hypothetical new entrant valuation, changes in the replacement cost of assets would be assumed to flow directly into the assumed hypothetical new entrant price, and hence imply a faster rate of regulatory depreciation. In contrast, as noted above, the efficient rate of regulatory depreciation may imply a back-ending of depreciation (i.e. a slower recovery) where the replacement cost of assets is expected to fall (subject to the ability for the regulated entity to set prices that recover its revenue requirement).
• Under the hypothetical new entrant valuation, the full (average) cost of providing service in each period would be reflected in prices for that period. Thus, where demand is expected to rise – and there are strong economies of scale and scope in the provision of the service – prices would be high in the early years and fall over time. In contrast, the optimal rate of recovery of costs would imply a deferral in the recovery of the residual cost if there is expected to be a greater number of customers – over whom the residual costs can be – spread in the future.
In addition, if the hypothetical (efficient) new entrant standard were used to derive regulatory depreciation, the marginal cost associated with providing the service at a point in time (i.e. the level of congestion) would be irrelevant.
PR I N C I P L E S F O R R E G U L A T O R Y D E P R E C I A T I O N: NO T E T O I P A R T
The Allen Consulting Group 19
In the absence of actual contestability of a service, there is no compelling reason to fix the time profile of cost recovery to the outcome that would be expected to be observed in such a market if it existed. Moreover, the discussion above suggests that the time profile of charges implied by the hypothetical (efficient) new entrant standard may depart materially from the profile that would be economically efficient in some cases – for example, where replacement costs are expected to fall at a fast rate (subject to the ability to recover all cost) or demand is expected to grow over time or, most relevant to NSW electricity distribution, the network is subject to a number of constraints.
The UK Office of Telecommunications Regulation, in explaining its approach to modelling economic depreciation for regulated mobile termination calls, reached a similar conclusion:16
20 One way to specify the competitor constraint would be the contestable market approach. It could be assumed for the purposes of the analysis (even if this represents a departure from reality) that entrants never experience a type (i) difference compared to incumbents. In a contestable market entrants face no barriers to entry and so would always be able to achieve the same utilisation as the incumbent(s) in any calendar year. So, for illustration, assume that the incumbent invested three years ago and achieved 50% utilisation in its first year of operation and 75% in its second year before reaching 100% in the current year. The contestable market approach would mean that the entrant in the current year would be assumed to achieve 100% in the current year, its first year of operation (and so has greater type (ii) efficiency than the incumbent).
21 Competition from potential entrants to a contestable market would be sufficient to ensure the removal of super-normal profit (whatever the number of incumbents or the nature of competition among them). The incumbent would be unable to defer depreciation when utilisation is low. If input costs (MEA price and operating expenses) were constant, then the economic depreciation profile under contestability would be a constant annual cost recovery (in £) each year. The unit cost (or price) would be inversely proportional to utilisation. 22 Although contestability provides a feasible answer to the specification of the competitor constraint, the price/unit cost profile that it implies seems unattractive. When utilisation is very low, the price/unit cost is very high and vice versa. It also involves an assumption about new entrants that seems very unrealistic.
Accordingly, it is considered that comparisons to the contestable market standard provide no useful guidance for determining regulatory depreciation allowances, and indeed, may provide misleading guidance.17
16
Oftel, Calls to Mobiles: Economic Depreciation, undated (available at: http://www.oftel.gov.uk/publications/mobile/depr0901.htm)
17
The caveat to this comment is that prices based upon what a hypothetical (efficient) new entrant would charge may be relevant for the assessment of whether competition would be likely to constrain the pricing policies of an electricity distributor. However, as discussed above, an incumbent would probably need to charge a price that is a multiple of the hypothetical (efficient) new entrant price before widespread bypass of its network would be encouraged.
PR I N C I P L E S F O R R E G U L A T O R Y D E P R E C I A T I O N: NO T E T O I P A R T
The Allen Consulting Group 20
Attachment C
Back-Ended Depreciation, Vintages of Assets
and ‘Switching’ Methods
Impact of Vintages
The impact of different regulatory depreciation methods on average prices will reflect the combined impact across all assets.
• More back-ended depreciation does not imply lower prices forever – just lower prices earlier in an asset’s life, and vice versa for more front-ended depreciation rates.
• Accordingly, whether a different depreciation methodology would have implied lower or higher prices at this point in time depends upon the mix of assets currently installed – and, in particular, the weighted average life of the existing assets.
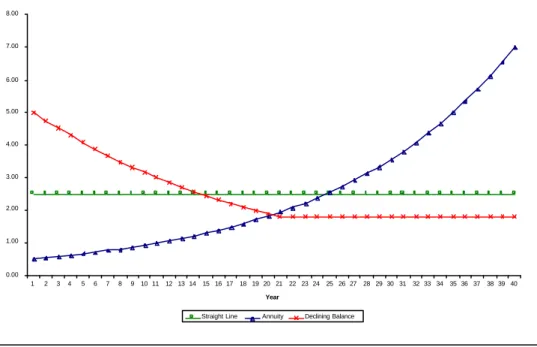
Figure 1 shows the regulatory depreciation allowance for a single asset under three common accounting depreciation methodologies, straight-line, annuity and declining balance,18 and figure 2 shows the impact on the price charged for this specific asset over its life.
Figure 1
DIFFERENT DEPRECIATION ALLOWANCES OVER TIME
18
All values are in constant prices. It is assumed that the asset cost 100 units and has a 40 year economic life. A WACC of 7 per cent (real) has been assumed to derive the annuity depreciation. For the diminishing balance, it has been assumed for simplicity that depreciation the first year is double that of straight-line (i.e. double declining balance), but that a switch is made to straight-line depreciation when the straight-line allowance is higher.
0.00 1.00 2.00 3.00 4.00 5.00 6.00 7.00 8.00 1 2 3 4 5 6 7 8 9 10 11 12 13 14 15 16 17 18 19 20 21 22 23 24 25 26 27 28 29 30 31 32 33 34 35 36 37 38 39 40 Year
PR I N C I P L E S F O R R E G U L A T O R Y D E P R E C I A T I O N: NO T E T O I P A R T
The Allen Consulting Group 21
Figure 2
PRICES UNDER DIFFERENT DEPRECIATION ALLOWANCES OVER TIME
The implications are that, if annuity depreciation – for instance – was considered to be the optimal depreciation methodology, then:
• annuity depreciation would imply higher prices than under the accelerated depreciation (declining balance) method shown above after just less than a quarter of the way through the asset’s life; and
• annuity depreciation would also imply higher prices than straight-line depreciation after just over a quarter of the way through the asset’s life. The impact of the different depreciation regimes on the aggregate depreciation allowance and on the aggregate prices is the same as that shown above – except that the asset lives shown in the figures now refer to the weighted average lives for all assets.
• Accordingly, given the age of many of the assets of the NSW electricity distributors, current prices – calculated under straight-line (inflation indexed) depreciation – are likely already to be lower than what would have been implied by annuity depreciation.
Whether prices rise or fall under each of the methodologies depends upon the projected change in the weighted average life of the overall portfolio of assets.19
• Under any depreciation method, if the weighted average asset life (as a proportion of expected useful life) remains approximately constant, then prices will also be expected to remain approximately constant over time.
19
Note that these comments assume that operating costs remain constant in real terms, replacement costs also remain constant and that demand is either constant or that the incremental cost of serving new demand is approximately the same as average cost. If operating costs rise, then this will feed into price rises, as will rising replacement costs. In contrast, the existence of substantial economies of scale, scope or density will imply falling real prices, all else constant.
0.00 2.00 4.00 6.00 8.00 10.00 12.00 14.00 1 2 3 4 5 6 7 8 9 10 11 12 13 14 15 16 17 18 19 20 21 22 23 24 25 26 27 28 29 30 31 32 33 34 35 36 37 38 39 40 Year
PR I N C I P L E S F O R R E G U L A T O R Y D E P R E C I A T I O N: NO T E T O I P A R T
The Allen Consulting Group 22
• Under straight-line or diminishing value, if assets are getting older on average, then prices will be falling whereas if assets are getting younger on average then average prices will rise.
A Change of Depreciation Methodology Mid-Term
Care must be taken when considering changes in the depreciation method applied to existing assets where there are vintages of assets in place. In particular, if it were considered that a more back-ended approach to depreciation may be preferable, then switching to this method after using a more accelerated approach would imply a far more back-ended depreciation regime than intended.
The impact of a change in depreciation methods for a single asset is shown in figures 3 and 4 below. It is assumed in these figures that straight-line depreciation had been used for the first 15 years of an asset’s life, but annuity depreciation is then used for the remainder (i.e. the written-down value of the asset is depreciated over its remaining 25 years of life using the annuity method).
Figure 3
A SWITCH FROM STRAIGHT LINE DEPRECIATION TO ANNUITY: DEPRECIATION
0.00 1.00 2.00 3.00 4.00 5.00 6.00 7.00 8.00 1 2 3 4 5 6 7 8 9 10 11 12 13 14 15 16 17 18 19 20 21 22 23 24 25 26 27 28 29 30 31 32 33 34 35 36 37 38 39 40 Year
PR I N C I P L E S F O R R E G U L A T O R Y D E P R E C I A T I O N: NO T E T O I P A R T
The Allen Consulting Group 23
Figure 4
A SWITCH FROM STRAIGHT LINE DEPRECIATION TO ANNUITY: PRICE EFFECTS
Thus, with a switch in regimes after year 15, the rate of depreciation and level of prices would be far lower than would have occurred under the preferred depreciation regime.
A further consequence of changing to a more deferred depreciation method part way through the life of the existing assets would imply that prices would be lower for a period, and then rise – possibly by a substantial amount – as the deferred depreciation is recovered. The precise impact of a deferral of depreciation depends upon the average age and composition of existing assets, but is reasonably straightforward to model for a particular utility, given knowledge about existing assets and future capital expenditure requirements.
0.00 1.00 2.00 3.00 4.00 5.00 6.00 7.00 8.00 9.00 10.00 1 2 3 4 5 6 7 8 9 10 11 12 13 14 15 16 17 18 19 20 21 22 23 24 25 26 27 28 29 30 31 32 33 34 35 36 37 38 39 40 Year