CFO Compensation Survey
Performance Targets In Bonus Plans
by
Michal Matějka
W. P. Carey School of Business
Arizona State University
2013
A Research Report Sponsored by the
2011 2 made this project possible.
2011 3
Table of Contents
Executive Summary 4
Survey Sample and Background 6 Compensation—Aggregate Analysis 7 CFO Compensation Benchmarks
General Analysis 12
CFO Compensation Benchmarks
Industry Analysis 18
Choice of Performance Measures 26
2011 4
Executive Summary
This report examines executive compensation and focuses in particular on the choice of performance targets in CFO annual bonus plans. The data comes from a survey of AICPA members conducted March–April 2013 in which 2,349 CEOs, CFOs, controllers, and other executives participated and shared detailed information about their compensation and incentive plans.
Our survey shows substantial increases in 2012 performance and compensation and also predicts a strong performance in 2013. A new CFO benchmarking tool allows users to obtain customized low-median-high compensation ranges for CFOs in companies of different size, industry, and geographical location. In addition, the survey provides detailed compensation benchmarks for CFOs in several well-represented industries.
Findings indicate that CFOs were often dissatisfied with bonuses that were awarded subjectively without any objective targets. At the same time, the proportion of CFO bonuses awarded subjectively was relatively high in private companies even though it has decreased relative to prior years. Furthermore, the proportion of subjectively awarded bonuses was lower in companies that use objective nonfinancial targets, use bonus pool arrangements, and have corporate boards more involved in decisions about CFO compensation.
Specific findings are highlighted below:
Median targeted return on sales increased considerably in 2013. The median targeted return on sales was 6% in 2011, 6.25% in 2012, and 7.5% in 2013 (see Figure 1, page 38). At the same time, the probability of achieving earnings targets increased as well— the average estimated probability of meeting an earnings target was 48% in 2009, 66% in 2011, and 69% in 2013 (see Table 13, page 40). The estimated probability of meeting nonfinancial targets included in bonus plans stayed largely unchanged—69% in 2009, and 75% both in 2011 and 2013.
2011 5
Median CFO cash compensation in 2012 increased by 6% relative to 2010 (see Table 3, page 9–10).1 However, the largest compensation increases went to CEOs, Presidents, and COOs who also experienced greatest declines in the aftermath of the recession. In 2013, CFOs of private companies had on average 58% of their bonuses contingent on meeting financial performance, 13% contingent on explicit nonfinancial targets, 27% of their bonuses was awarded subjectively, and 2–3% in some other way (see Table 5, page 26). The use of subjective bonuses was higher in smaller companies.
CFO satisfaction with the design of their compensation packages was low when subjective bonuses were used heavily. Highly dissatisfied CFOs had 40% of their bonus awarded subjectively as compared to 25% for satisfied CFOs (see Table 8, page 28). The most common type of nonfinancial targets in CFO bonus plans were operations targets (used in 15% of private companies), targets related to accounting & IT functional duties (13%), teamwork targets (12%), and finance targets (11%); see Table 9, page 30.
About 37% of corporate boards in private companies had considerable influence on CFO compensation as compared to 70% in public companies. Board influence was associated with a lower reliance on subjective bonuses and greater involvement of CFOs in major business decisions (see Table 10, page 32).
About 27% of private companies used bonus plans that get funded only if earnings meet some minimum thresholds, 7% used bonus pools with some other threshold, and 4% used bonus pools determined subjectively. CFOs in companies using bonus pools with earnings thresholds earned bonuses that were larger than those of CFOs in companies with no bonus pools (see Table 11, page 34).
Only 9% of private companies used information about performance of their industry peers when awarding bonuses to CFOs and another 9% used information about peers when setting targets. Companies using peer performance information paid lower bonuses in 2012 than companies not using relative performance evaluation even though their performance was similar or better (see Table 12, page 36).
1 The estimate has to be interpreted with caution because it could in part be driven by differences in the
2011 6
Survey Sample and Background
The survey population consisted of about 40,000 AICPA members in business and industry with job titles CEO, CFO, VP Finance, COO, President, Managing Director, or Controller. Selected members were invited to participate in an on-line survey in March 2013. By the middle of May, 2,349 members fully or partially completed the survey questionnaire.
The survey was tailored to respondents at the corporate/company level (81%) or division/business unit level (19%). In what follows, the title CEO refers to the top executive either at the business unit or corporate level. Similarly, the title CFO refers to the top executive in charge of finance, accounting, and reporting either at the business unit or corporate level. About 9% of the respondents were CEOs, COOs, or Presidents, 65% were CFOs, 18% were other top financial executives (reporting to the CFO), and 8% were lower-level executives and staff.
The survey questions covered three main areas: (i) compensation and incentives, (ii) choice of performance measures in annual bonus plans, and (iii) difficulty of performance targets. In this report, we first summarize average 2012 compensation of CFOs in public and private companies and compare it to the compensation of CEO/COOs and other financial executives. Next, we present benchmarking tools providing ranges of CFO total cash compensation in different industries and metropolitan areas. The remainder of the report examines the design of CFO annual bonus plans. We describe commonly used financial and nonfinancial performance targets and also discuss the extent to which bonuses were awarded subjectively without any explicit targets. Finally, we examine how companies calibrated the difficulty of earnings targets as well as other financial and nonfinancial targets.
Our analysis relies on information from the current survey as well as information from earlier surveys targeting a similar population of AICPA executives. In addition, one of the analyses (see Table 7) presents an international comparison using information from similar surveys conducted in European countries.
2011 7
Compensation—Aggregate Analysis
Table 1 compares median annual base salaries and incentive pay for (i) CFOs at the company (corporate) level, (ii) other top financial executives directly reporting to CFOs (e.g., corporate controllers, chief accounting officers, directors of internal auditing or risk management, etc.), and (iii) executives with the title CEO, President, or COO. Table 1 separately reports on compensation in private and public companies but aggregates across companies of different sizes and industries. Size-, industry-, and region-specific results are presented in the next section.
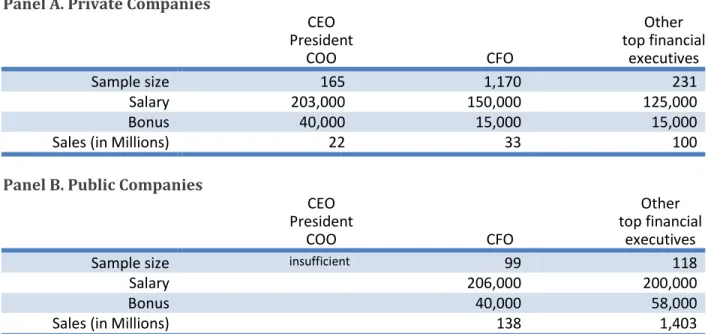
Panel A of Table 1 reports median 2012 compensation in private companies. It shows that the median CFO salary was $150,000 and the corresponding median bonus was $15,000. The median size of all other compensation components (multi-year cash bonuses, equity
Table 1. Median 2012 Compensation Panel A. Private Companies
CEO President COO CFO Other top financial executives Sample size 165 1,170 231 Salary 203,000 150,000 125,000 Bonus 40,000 15,000 15,000 Sales (in Millions) 22 33 100
Panel B. Public Companies
CEO President COO CFO Other top financial executives Sample size insufficient 99 118
Salary 206,000 200,000 Bonus 40,000 58,000 Sales (in Millions) 138 1,403
Notes: Table reports medians (obtained by ranking compensation and then selecting the value in the middle). Information on multi-year cash bonuses, equity incentives, and other compensation not reported because their medians are zero.
2011 8
incentives, and other compensation) was zero and is not reported. CFO cash compensation was only slightly higher than compensation of other top financial executives. However, this was in part because of differences in the size of participating companies. The median sales of a private company whose CFO participated in this survey was $33 million as compared to $100 million in cases where other top financial executives participated. The top executives (CEOs, Presidents, COOs) in private companies earned median salary and bonus of $203,000 and $40,000, respectively.
Panel B of Table 1 reports median 2012 compensation in public companies. Here, we can only compare CFOs with other top financial executives since the small number of participants in the CEO/President/COO category does not allow for reliable estimates. We note that the median size of a public company whose CFO participated ($138 million in sales) was much smaller than the size of a company where another financial executive responded ($1,403 million in sales). The median CFO salary of $206,000 and bonus of $40,000 were similar to the median salary and bonus of other top financial executives of $200,000 and $58,000, respectively.
Table 2 reports on CFO compensation at the business unit level. The typical business unit of a private company had sales of 90 million and paid its CFO a salary of $160,000 and bonus of $20,000. In contrast, the typical business unit of a public company had sales of $338 million and median CFO compensation consisted of $180,000 in salary, $43,000 in bonus and $4,250 in equity grants.
Table 2. 2012 Compensation of Business Unit CFOs
Private Company Business Units Public Company Business Units Sample size 71 92 Salary 160,000 180,000 Bonus 20,000 43,000 Equity Incentives 0 4,250 Sales (in Millions) 90 338
Notes: Table reports medians (obtained by ranking compensation and then selecting the value in the middle). Information on multi-year cash bonus, equity incentives, and other compensation is not reported if the median value was zero.
2011 9
Finally, Table 3 assesses trends in cash compensation (salary and annual bonus) since 2006 for a subsample of companies and business units with more than 20 employees (nonprofit entities were excluded). Given that compensation packages of moderately paid executives can vary over time differently than compensation packages of highly paid executives, we assess changes for three different compensation levels. “High” in Table 3 refers to the 75th percentile, “Median” to the 50th percentile, and “Low” to the 25th percentile of compensation levels. These percentiles were obtained by ranking compensation and then selecting the value that is higher than 75%/50%/25% of all other values. Consequently, the low–high is the typical range including compensation of 50% of executives in the sample. Panel A of Table 3 describes trends in CEO, President, and COO compensation. The sizable 2012–2010 increases at all levels suggest that cash compensation has recovered from post-recession lows. For example, the 2012 median CEO cash compensation in a company with $31 million in sales was $300,000 which represents a 35% increase over 2010. At the same time, the 2010 compensation of $223,000 was much lower than $270,000 earned in 2006, i.e., just prior to the recession. This substantial variation likely reflects that a considerable part of top executives’ compensation was variable and contingent on performance.
Panel B of Table 3 describes trends in CFO compensation. Unlike CEOs, CFOs typically did not see substantial fluctuations in their compensation during the recession. That likely explains why 2012–2010 increases were much smaller than those of CEOs. For example,
Table 3. Cash Compensation Trends Panel A. CEO, President, COO
Low Median High Sample size 129 129 129 2012 209,000 300,000 440,000 2012–2010 Change 39% 35% 52% 2010 150,000 223,000 290,000 2010–2008 Change -17% -19% -38% 2008 180,000 276,000 470,000 2008–2006 Change 1% 2% 12% 2006 177,500 270,000 421,500 Sales (in Millions) 15 31 118 Number of employees 38 120 325 Public 10% 10% 10% BU 15% 15% 15%
2011 10
the 2012 median CFO cash compensation in a company with $50 million in sales was $190,000 which represents a 6% increase over 2010. The typical “Low” compensation (representing a CFO of a company with $21 million in sales) increased 5% to $131,250 in 2012. The typical “High” compensation (representing a CFO of a company with $180 million in sales) increased 12% to $290,000 in 2012.
Table 3. Cash Compensation Trends (Cont’d) Panel B. CFO
Low Median High Sample size 1,151 1,151 1,151 2012 131,250 190,000 290,000 2012–2010 Change +5% +6% +12% 2010 125,000 180,000 260,000 2010–2008 Change +0% +9% +4% 2008 125,000 165,000 250,000 2008–2006 Change +5% +3% +4% 2006 118,500 160,000 240,000 Sales (in Millions) 21 50 180 Number of employees 75 170 500 Public 13% 13% 13% BU 14% 14% 14%
Panel C. Other Top Financial Executives
Low Median High Sample size 334 334 334 2012 130,000 192,640 285,000 2012–2010 Change +18% +22% +13% 2010 110,000 157,750 253,000 2010–2008 Change +5% +13% +25% 2008 105,000 140,000 202,000 Sales (in Millions) 79 359 1,500 Number of employees 230 992 3,900 Public 8% 8% 8% BU 40% 40% 40%
Notes: Table reports cash compensation (salary and annual bonus) and changes therein. It covers a subsample of companies and business units with 20 or more employees and excludes nonprofit entities. The participants in 2010, 2008, and 2006 have similar characteristics as the participants in 2012. Low/Median/High refer to levels obtained by ranking compensation and selecting the value that is higher than 75%/50%/25% of all other values. Information is not available for other top financial executives in 2006 because the survey did not separately collect data on financial executives that directly report to the CFO.
2011 11
Panel C of Table 3 describes trends in compensation of other top financial executives reporting directly to a CFO. It is difficult to assess the effect of the recession because we lack pre-recession data from 2006. Nevertheless, it is worth noting that compensation in this group of executives grew fastest since 2008.
Finally, we emphasize that the estimates in Table 3 have to be interpreted with caution. We cannot compare executive compensation in one year to the compensation of the same executives two years earlier because all respondents participate anonymously. Instead, we identify individual and company characteristics that affect cash compensation (size, tenure, public vs. private companies, corporate vs. BU level, etc.) and select subsamples that are similar on those characteristics so that our year-to-year comparisons minimize differences in respondent characteristics. Still, we cannot completely rule out the possibility that the differences between years are at least partly due to differences in respondents and companies participating during different years.
2011 12
CFO Compensation Benchmarks
General Analysis
The aggregate analysis in the previous section describes compensation of different top executives and highlights trends over time. The purpose of this section is to provide more specific benchmarks tailored to different industries, regions, and companies of various size. This benchmarking analysis requires a large number of executives in the same position and thus can only be carried out for CFOs who represent almost two thirds of our survey respondents. To assure comparability, we exclude companies with sales less than $10 million in sales.
Table 4 presents the results of benchmarking “Low,” “Median,” and “High” CFO compensation as defined in the previous section. The first row of Panel A shows the “unadjusted compensation,” which is the base amount that applies to CFOs who work: (i) in privately owned companies ,
(ii) at the corporate level (as opposed to division CFOs), (iii) in companies with $50–100 million in sales,
(iv) outside of major metropolitan areas,
(v) in some other industry than those listed among our categories.
The “unadjusted compensation” has to be adjusted by the amounts reported in the remaining rows of Table 4 for all other CFOs, e.g., when they work for a publicly listed company; depending on size, industry, etc. However, CFO compensation varies for reasons other than company size, location, and industry. It also depends on characteristics we do not adjust for such as tenure, experience, responsibilities, and specific industry subcategories. These differences explain why there is considerable variation within the Low–Median–High range. Also note that 25% of CFOs earn less than the “Low” amount and 25% earn more than the “High” amount.
2011 13
As illustrated in the examples at the end of this section, multiple adjustments are combined by simply adding them to the “unadjusted compensation.” Given data constraints, we do not estimate for example separate industry or size adjustments for private versus public companies.
Finally, it is important to emphasize that the adjustments in Table 4 are merely estimates and their precision varies with the number of available observations (reported in the last column of Table 4). All estimates in Panel A are based on at least 100 observations and thus are relatively precise. Many of the estimates in Panels B and C are based on a much smaller set of observations and thus have to be used with caution.
Table 4. CFO Compensation Benchmarks Panel A. Size-Adjusted Annual Cash Compensation
Low Median High (a1) Unadjusted compensation 140,000 187,425 247,650
(a2) Publicly listed company +13,412 +23,808 +55,000 (a3) Business unit -55,900 -60,192 -74,000 (a4) Sales less than $25 million -49,088 -57,425 -73,650 (a5) Sales $25-50 million -27,088 -36,850 -52,000 (a6) Sales $50-100 million 0 0 0 (a7) Sales $100-200 million +28,900 +35,725 +50,350 (a8) Sales $200-500 million +66,000 +68,958 +89,000 (a9) Sales more than $500 million +108,013 +150,113 +195,350
Notes to Panel A: The “Publicly listed company” adjustment applies also to business units of public companies (see Example 3 below). Only one of the sales adjustments in rows (a4)–(a9) applies. However, when sales volume falls close to a category boundary, it may be better to average both rows at the boundary (see Example 4 below). In case of business units, the revenue categories apply to the unit (not the company as a whole).
Panel B. Adjustments for Metropolitan Area
Low Median High N (b1) San Francisco +82,913 +120,000 +126,000 20 (b2) Los Angeles +66,988 +96,313 +151,350 34 (b3) Miami +49,088 +88,654 +82,350 12
2011 14
(b4) New York City +71,900 +79,850 +105,350 70 (b5) Philadelphia +35,525 +61,888 +23,350 33 (b6) Washington D.C. +56,175 +59,888 +65,700 48 (b7) Houston +44,088 +59,808 +62,350 27 (b8) Chicago +43,013 +47,425 +36,000 50 (b9) Detroit +49,088 +44,313 +42,350 19 (b10) Dallas +31,900 +39,888 +17,000 43 (b11) Seattle +50,000 +32,425 +36,000 28 (b12) Atlanta +29,175 +33,617 -9,300 26 (b13) Boston +30,000 +24,654 +20,700 15 (b14) Phoenix +33,900 +16,850 +7,350 26 (b15) St. Louis +7,988 +2,575 +12,000 17 (b16) Minneapolis +9,500 +9,000 +49,000 22 (b17) Denver +13,088 -575 +23,350 21 (b18) Portland -39,088 -25,425 +17,000 11
Notes to Panel B: Metropolitan areas are defined broadly to include: Atlanta, Boston-Worcester-Lawrence, Chicago-Gary-Kenosha, Dallas-Fort Worth, Denver-Boulder-Greeley, Detroit-Ann Arbor-Flint, Houston-Galveston-Brazoria, Los Angeles-Riverside-Orange County, Miami-Fort Lauderdale, Minneapolis-St. Paul, New York-Northern New Jersey-Long Island, Philadelphia-Wilmington-Atlantic City, Phoenix-Mesa, Portland-Salem, San Francisco-Oakland-San Jose, Seattle-Tacoma-Bremerton, St. Louis, Washington-Baltimore. The last column (N) refers to the number of observations used in estimation—higher N means more reliable estimates. Excluded from estimation were San Diego and Tampa because the number of available observation was too small to allow for reliable estimates.
Panel C. Adjustments for Industry
Low Median High N (c1) Information and Media +34,500 +67,113 +37,334 29 (c2) Arts, Entertain., and Recreation -12,750 +58,113 +197,950 12 (c3) Finance and Insurance +43,250 +58,780 +120,767 103 (c4) Hospitality and Food Services -10,000 +43,113 +72,500 15 (c5) Professional and Tech. Services +10,000 +30,000 +43,934 57 (c6) Real Estate +8,000 +28,113 +41,334 35 (c7) Healthcare +3,500 +13,560 +16,950 86
2011 15
(c8) Transportation and Warehousing -19,000 +12,113 +11,399 24 (c9) Manufacturing +0 +10,000 +27,500 164 (c10) Mining and Oil & Gas +3,500 +6,780 +29,318 21 (c11) Utilities -21,500 -6,887 -28,284 12 (c12) Other - Nonprofit -13,900 -10,000 -8,666 69 (c13) Construction -33,500 -20,107 -18,666 70 (c14) Wholesale Trade -37,000 -21,887 -25,050 63 (c15) Retail Trade -32,000 -31,887 -28,050 48
Notes: The table reports 2012 CFO cash compensation (salary and annual bonus) in companies and business units with at least $10 million in sales. Low/Median/High refer to levels obtained by ranking compensation and selecting the value that is higher than 75%/50%/25% of all other values. CFO compensation benchmarks are based on the unadjusted amount in the first row of Panel A after adding or subtracting adjustments for (i) public companies, business unit level, and size in Panel A; (ii) metropolitan area in Panel B; and (iii) industry in Panel C.
We illustrate the use of the benchmarking analysis with the following examples:
Example 1: Corporate CFO of a private company with $20 million in sales; industry— engineering design and architecture; location—Boston, MA:
Row Low Median High
Unadjusted (a1) 140,000 187,425 247,650
Size <$25 million (a4) -49,088 -57,425 -73,650
Region Boston (b13) +30,000 +24,654 +20,700
Industry Prof. services (c5) +10,000 +30,000 +43,934
Adjusted Range 130,912 184,654 238,634
The unadjusted amount is the same for all examples. There is a negative adjustment for size because the unadjusted amount assumes $50–100 million in sales, see Panel B of Table 4 row (a4). Note that the adjustments for Boston metropolitan area are estimated based on only 15 observations, see last column of row (b13), and thus may be imprecise. The closest listed industry is the “professional and technical services” category. Industry information from other sources should be used to determine whether “engineering design and architecture” pays higher or lower compensation than other industries that can broadly be characterized as “professional and technical services.” Note that “professional and technical
2011 16
services” is among the six industry categories analyzed separately. Tables Ind5a and Ind5b (see page 24) can be used to obtain alternative CFO compensation benchmarks.
Example 2: Corporate CFO of a private company with $75 million in sales; industry— manufacturing of automated high-precision equipment; location—Omaha, NE:
Row Low Median High
Unadjusted (a1) 140,000 187,425 247,650
Industry Manufacturing (c9) +0 +10,000 +27,500
Adjusted Range 140,000 197,425 275,150
There is no adjustment for size and region because the unadjusted amount correctly assumes $50–100 million in sales and location outside of the listed metropolitan areas. High-tech manufacturing is likely to pay higher compensation than low-tech industries so the median to high range may be more representative.
Example 3: CFO of a division with $300 million in sales owned by a publicly listed company; industry—hotels and tourist services; location—Vail, CO:
Row Low Median High
Unadjusted (a1) 140,000 187,425 247,650
Public (a2) +13,412 +23,808 +55,000
BU (a3) -55,900 -60,192 -74,000
Size $200–500 million (a8) +66,000 +68,958 +89,000
Industry Hospitality (c4) -10,000 +43,113 +72,500
Adjusted Range 153,512 263,112 390,150
Adjustments for a business unit and a publicly listed parent are included. Although Vail is not far from Denver, it is not a part of the Denver-Boulder-Greeley metro area and no adjustment for region is made. Information from other sources may suggest that compensation in the Denver metro area is generally lower/similar/higher than in Vail and line (b17) can be added to get an alternative reference point. “Hospitality and food services” is the closest listed industry category and the adjustment from (c4) is included. However, industry category “Arts, Entertainment, and Recreation” might apply as well and could be used to calculate an alternative reference point.
2011 17 Example 4: Corporate CFO of a public company with $490 million in sales; industry— design, sales, and service of telecom equipment; location—Troy Hills, NJ:
Row Low Median High
Unadjusted (a1) 140,000 187,425 247,650
Public (a2) +13,412 +23,808 +55,000
Size $200–500 million (a8)/2 +33,000 +34,479 +44,500 Size >$500 million (a9)/2 +54,007 +75,057 +97,675 Region New York City (b4) +71,900 +79,850 +105,350
Adjusted Range 312,319 400,619 550,175
$490 million in sales is right at the boundary of (a8) and (a9). Both rows divided by two are included to obtain an average of the two size adjustments. No adjustment included for industry because the company does not manufacture its products and does not seem to fall into the “manufacturing” category. “Professional and technical services” or “utilities” might be used as alternative reference points but no single listed category fits well.
2011 18
CFO Compensation Benchmarks
Industry Analysis
This section continues the CFO compensation benchmarking analysis by presenting detailed information about CFO salaries and bonuses in six of the most common industry groups: manufacturing, finance and insurance, retail and wholesale, construction, professional and technical services, and healthcare. The analysis also distinguishes between companies of different size. The downside is that the sample of observations for specific industry and size groups can be quite small in which case the results should be interpreted with caution.
To maximize the number of available observations, our industry analysis combines private and public entities, corporate and business unit entities, and all entities regardless of their location. The analysis in the previous section provides some guidance how CFO cash compensation reflects some of these characteristics. In addition, we find some differences regarding incentive compensation (bonus as a percentage of salary). Bonuses of CFOs in public companies were on average higher by about 10% of their salaries as compared to CFOs in private companies. Bonuses of corporate CFOs were higher by about 5% of their salaries as compared to those of CFOs in business units.
In what follows, we illustrate the industry analysis using manufacturing as an example— see Tables Ind1a and Ind1b (see page 20). All other tables have a similar format. Table Ind1a presents the distribution of CFO annual base salaries. The first column shows six salary ranges starting from low salaries of less than $100,000 to high salaries of more than $250,000. The next four columns are specific to companies of different sizes. For example, small manufacturing companies with sales less than $25 million typically paid a (median) salary in the $100,001–125,000 range (13 out of the 45 small companies were in this range), yet there was also substantial variation—e.g., 19 of the small companies paid salaries in the lowest range but 6 of the 45 small companies paid salaries in the $150,001– 200,000 range.
Table Ind1b is organized similarly. However, for each combination of salary and sales ranges, it presents three rows containing low, median, and high values of 2012 bonus as a
2011 19
percentage of salary. The low is measured as the 25th percentile (i.e., not the overall lowest value but the highest from the low 25%), median and high values are measured similarly as the 50th and 75th percentiles, respectively. For example, a majority of manufacturing companies with sales in the $100–499 million range and CFO salary between $200,001 and $250,000 paid a bonus ranging from 20–86% of salary for 2012 performance. From Table Ind1a, we see that this particular cell (salary-sales combination) includes 7 companies. When examining the results, it is useful to consider surrounding cells as well as column or row averages, especially if the sample size is small. In the above example, the bonus range 20–86% of salary is estimated based on just 7 observations. The bonus range for 46 companies of similar size ($100–499 million in sales) was 18–57%; the bonus range for 13 companies paying similar salaries ($200,001–250,000) was 17–40%.
Finally, the overall 2012 bonus range for all manufacturing companies (8/20/43%) is also a useful benchmark because it aggregates a larger number (179) of different manufacturing companies. For example, it can be compared across industries—finance and insurance (9/25/44%), retail and wholesale (0/14/39%), construction (0/12/29%), professional and technical services (0/11-26%), and healthcare (1/13/20%).
2011 20
Table Ind1a. Distribution of CFO 2012 Annual Base Salary
Sales (In Millions)
Salary <25 25–99 100–499 >500 Total <=100,000 19 9 2 0 30 100,001–125,000 13 13 6 0 32 125,001–150,000 7 12 6 1 26 150,001–200,000 6 20 17 10 53 200,001–250,000 0 4 7 2 13 >250,000 0 4 8 13 25 Total 45 62 46 26 179
Notes: Each cell contains the number of CFOs with 2012 annual salaries in the range indicated by the first column that work for companies with sales indicated by the first row. Bold cells highlight which range contains median CFO salary in companies of a given size. For example, the median CFO salary of companies with sales $25–99 million was in the $125,001–150,000 range; 13 companies paid salaries in the next lower range and 20 in the next higher range.
Table Ind1b. Typical CFO 2012 Bonus as Percentage of Annual Salary
Sales (In Millions)
Salary <25 25–99 100–499 >500 Average 1% 9% 4% <=100,000 6% 13% 10% 25% 26% 26% 0% 9% 0% 100,001–125,000 9% 14% 10% 10% 17% 16% 0% 12% 7% 125,001–150,000 11% 28% 24% 28% 46% 33% 18% 26% 18% 18% 150,001–200,000 26% 55% 26% 26% 45% 66% 47% 55% 20% 17% 200,001–250,000 34% 30% 86% 40% 18% 25% 18% >250,000 22% 43% 40% 50% 75% 60% 0% 11% 18% 18% 8% Average 8% 19% 28% 33% 20% 20% 38% 57% 55% 43%
Notes: The table shows for each combination of a salary range and company size (sales range): (i) low, (ii) median, and (iii) high 2012 bonus as a percentage of salary. Low/median/high means that 25/50/75% of observations in the same cell have a lower bonus. Cells with fewer than seven observations are not shown.
2011 21
Table Ind2a. Distribution of CFO 2012 Annual Base Salary
Sales (In Millions)
Salary <25 25–99 100–499 >500 Total <=100,000 13 1 1 0 15 100,001–125,000 9 4 1 0 14 125,001–150,000 17 2 0 0 19 150,001–200,000 7 16 8 2 33 200,001–250,000 4 7 9 5 25 >250,000 3 9 8 10 30 Total 53 39 27 17 136
Notes: Each cell contains the number of CFOs with 2012 annual salaries in the range indicated by the first column that work for companies with sales indicated by the first row. Bold cells highlight which range contains median CFO salary in companies of a given size. For example, the median CFO salary of companies with sales $25–99 million was in the $150,001–200,000 range; 2 companies paid salaries in the next lower range and 7 in the next higher range.
Table Ind2b. Typical CFO 2012 Bonus as Percentage of Annual Salary
Sales (In Millions)
Salary <25 25–99 100–499 >500 Average 0% 0% <=100,000 13% 13% 25% 26% 0% 0% 100,001–125,000 7% 8% 10% 14% 0% 0% 125,001–150,000 13% 13% 71% 71% 0% 15% 15% 13% 150,001–200,000 0% 21% 25% 22% 28% 48% 54% 40% 30% 24% 22% 200,001–250,000 43% 30% 33% 91% 36% 72% 22% 32% 38% 28% >250,000 29% 39% 47% 39% 41% 82% 90% 67% 0% 11% 17% 36% 9% Average 10% 25% 29% 44% 25% 25% 44% 78% 67% 44%
Notes: The table shows for each combination of a salary range and company size (sales range): (i) low, (ii) median, and (iii) high 2012 bonus as a percentage of salary. Low/median/high means that 25/50/75% of observations in the same cell have a lower bonus. Cells with fewer than seven observations are not shown.
2011 22
Table Ind3a. Distribution of CFO 2012 Annual Base Salary
Sales (In Millions)
Salary <25 25–99 100–499 >500 Total <=100,000 8 11 3 3 25 100,001–125,000 7 9 8 1 25 125,001–150,000 4 7 6 0 17 150,001–200,000 2 9 9 3 23 200,001–250,000 1 1 8 8 18 >250,000 0 3 3 3 9 Total 22 40 37 18 117
Notes: Each cell contains the number of CFOs with 2012 annual salaries in the range indicated by the first column that work for companies with sales indicated by the first row. Bold cells highlight which range contains median CFO salary in companies of a given size. For example, the median CFO salary of companies with sales $25–99 million was in the $125,001–150,000 range; 9 companies paid salaries in the next lower range and 9 in the next higher range.
Table Ind3b. Typical CFO 2012 Bonus as Percentage of Annual Salary
Sales (In Millions)
Salary <25 25–99 100–499 >500 Average 0% 0% 0% <=100,000 2% 13% 6% 15% 33% 26% 0% 2% 17% 1% 100,001–125,000 0% 14% 27% 11% 1% 17% 57% 27% 0% 0% 125,001–150,000 0% 0% 43% 42% 0% 6% 6% 150,001–200,000 9% 26% 26% 40% 41% 50% 18% 22% 20% 200,001–250,000 35% 29% 29% 62% 44% 50% 0% >250,000 5% 17% 0% 0% 6% 22% 0% Average 0% 9% 23% 34% 14% 20% 34% 41% 53% 39%
Notes: The table shows for each combination of a salary range and company size (sales range): (i) low, (ii) median, and (iii) high 2012 bonus as a percentage of salary. Low/median/high means that 25/50/75% of observations in the same cell have a lower bonus. Cells with fewer than seven observations are not shown.
2011 23
Table Ind4a. Distribution of CFO 2012 Annual Base Salary
Sales (In Millions)
Salary <25 25–99 100–499 >500 Total <=100,000 15 8 0 0 23 100,001–125,000 6 11 3 0 20 125,001–150,000 1 9 4 0 14 150,001–200,000 1 7 6 2 16 200,001–250,000 2 1 3 3 9 >250,000 0 1 0 1 2 Total 25 37 16 6 84
Notes: Each cell contains the number of CFOs with 2012 annual salaries in the range indicated by the first column that work for companies with sales indicated by the first row. Bold cells highlight which range contains median CFO salary in companies of a given size. For example, the median CFO salary of companies with sales $25–99 million was in the $100,001–125,000 range; 8 companies paid salaries in the next lower range and 9 in the next higher range.
Table Ind4b. Typical CFO 2012 Bonus as Percentage of Annual Salary
Sales (In Millions)
Salary <25 25–99 100–499 >500 Average 0% 0% 0% <=100,000 1% 7% 2% 12% 13% 12% 0% 0% 100,001–125,000 6% 11% 20% 20% 0% 0% 125,001–150,000 10% 19% 20% 43% 11% 8% 150,001–200,000 16% 19% 50% 39% 20% 200,001–250,000 31% 40% >250,000 0% 0% 19% 0% Average 6% 11% 26% 12% 13% 20% 36% 29%
Notes: The table shows for each combination of a salary range and company size (sales range): (i) low, (ii) median, and (iii) high 2012 bonus as a percentage of salary. Low/median/high means that 25/50/75% of observations in the same cell have a lower bonus. Cells with fewer than seven observations are not shown.
2011 24
Table Ind5a. Distribution of CFO 2012 Annual Base Salary
Sales (In Millions)
Salary <25 25–99 100–499 >500 Total <=100,000 8 2 0 0 10 100,001–125,000 4 5 0 0 9 125,001–150,000 6 5 2 0 13 150,001–200,000 6 11 3 0 20 200,001–250,000 3 5 2 1 11 >250,000 2 2 2 2 8 Total 29 30 9 3 71
Notes: Each cell contains the number of CFOs with 2012 annual salaries in the range indicated by the first column that work for companies with sales indicated by the first row. Bold cells highlight which range contains median CFO salary in companies of a given size. For example, the median CFO salary of companies with sales $25–99 million was in the $150,001–200,000 range; 5 companies paid salaries in the next lower range and 5 in the next higher range.
Table Ind5b. Typical CFO 2012 Bonus as Percentage of Annual Salary
Sales (In Millions)
Salary <25 25–99 100–499 >500 Average 0% 0% <=100,000 0% 0% 5% 6% 0% 100,001–125,000 4% 12% 0% 125,001–150,000 12% 32% 8% 7% 150,001–200,000 12% 12% 34% 32% 10% 200,001–250,000 21% 50% 0% >250,000 16% 37% 0% 4% 10% 0% Average 0% 12% 50% 11% 12% 24% 55% 26%
Notes: The table shows for each combination of a salary range and company size (sales range): (i) low, (ii) median, and (iii) high 2012 bonus as a percentage of salary. Low/median/high means that 25/50/75% of observations in the same cell have a lower bonus. Cells with fewer than seven observations are not shown.
2011 25
Table Ind6a. Distribution of CFO 2012 Annual Base Salary
Sales (In Millions)
Salary <25 25–99 100–499 >500 Total <=100,000 9 4 0 1 14 100,001–125,000 3 7 1 0 11 125,001–150,000 3 7 2 2 14 150,001–200,000 5 10 10 2 27 200,001–250,000 2 3 4 0 9 >250,000 1 5 7 8 21 Total 23 36 24 13 96
Notes: Each cell contains the number of CFOs with 2012 annual salaries in the range indicated by the first column that work for companies with sales indicated by the first row. Bold cells highlight which range contains median CFO salary in companies of a given size. For example, the median CFO salary of companies with sales $25–99 million was in the $125,001–150,000 range; 7 companies paid salaries in the next lower range and 10 in the next higher range.
Table Ind6b. Typical CFO 2012 Bonus as Percentage of Annual Salary
Sales (In Millions)
Salary <25 25–99 100–499 >500 Average 0% 0% <=100,000 8% 11% 15% 34% 4% 0% 100,001–125,000 11% 4% 16% 13% 8% 9% 125,001–150,000 15% 17% 20% 20% 0% 10% 0% 150,001–200,000 7% 20% 10% 13% 26% 19% 9% 200,001–250,000 14% 20% 7% 5% 7% >250,000 15% 16% 14% 27% 28% 27% 0% 5% 8% 11% 1% Average 4% 13% 15% 16% 13% 15% 20% 26% 25% 20%
Notes: The table shows for each combination of a salary range and company size (sales range): (i) low, (ii) median, and (iii) high 2012 bonus as a percentage of salary. Low/median/high means that 25/50/75% of observations in the same cell have a lower bonus. Cells with fewer than seven observations are not shown.
2011 26
Choice of Performance Measures
When awarding annual bonuses, companies can evaluate performance relative to (i) financial targets (e.g., earnings or sales), (ii) objective nonfinancial targets (e.g., customer satisfaction, quality, safety), or (iii) rely on subjective evaluations without pre-set targets (discretionary bonuses). Using this distinction, this section examines how companies award bonuses to their CFOs. To assure comparability, the sample is limited to CFOs in private companies with 20 or more employees and excludes business unit and nonprofit entities (small sample sizes do not allow for a detailed analysis specific to CFOs in these entities).
Table 5 shows that, on average, CFOs expect to earn 58% of their 2013 bonus for meeting financial performance targets, about 13% for meeting objective nonfinancial targets, and 27% as a discretionary bonus without preset targets (the remainder can be earned in some other way). It is worth noting that the proportion of CFO bonus determined subjectively was around 30% in small companies but less than 20% in companies with sales greater than $200 million. In other words, CFO bonuses in larger companies were more likely to be contingent on explicit financial or even nonfinancial targets rather than determined in a subjective manner.
Table 5. 2013 Performance Targets in CFO Bonus Plans in Private Companies
Note: Tabulated is the percentage breakdown of total bonus CFOs expect to earn in 2013 if performance is on target along all dimensions. For example, the second row represents the percentage of 2013 bonus CFOs expect to receive for meeting financial targets if 2013 performance exactly meets all targets. The subsample includes CFOs in private companies with 20 or more employees and excludes business unit and nonprofit entities.
2011 27
Table 6 shows that most companies have significantly reduced the extent to which CFO bonuses are awarded in a subjective manner. In 2007, on average, 34% of CFO bonuses were subjective and this average gradually decreased to 27% in 2013. The decrease was more pronounced in larger companies. For example, the largest companies reduced the average from 26% to 19% whereas the average remained relatively unchanged around 30– 33% in the smallest companies.
Despite the recent decrease in the use of subjective bonuses, the proportion of CFO bonuses determined subjectively remained relatively high. Table 7 shows that the average proportion of 27% in private companies was higher than 21% in public companies. It also shows that private companies in Germany and the Netherlands relied on subjective bonuses to a much lower extent, on average, 7% and 12%, respectively. Only Italian private companies used more subjectivity, 32% on average.
Table 6. Subjectivity in CFO Bonus Plans—Changes between 2007 and 2013
Note: Tabulated is the percentage of CFO bonus determined subjectively using the same subsample as in Table 5. 2013 percentages in the first row are the same as in the last row of Table 6. The remaining rows provide a comparison with prior years.
Table 7. Subjectivity in CFO Bonus Plans—An International Comparison
Note: Tabulated is the percentage of CFO bonus determined subjectively using the same subsample as in Table 5. 2013 percentage in the first column is the same as in Table 6. The remaining columns provide a comparison with U.S. public companies and companies in three European countries participating in a similar survey between 2009 and 2011.
2011 28
Table 8 provides evidence that the relatively high reliance on subjective bonuses is an important issue for many CFOs. In particular, when companies relied on subjective bonuses to a large extent, CFOs were usually very dissatisfied with their compensation package. In fact, subjective bonuses were one of the best predictors of CFO dissatisfaction in our survey. For example, Panel A shows that CFOs who indicated “Very high”, “High”, or “Medium” satisfaction with their compensation had on average 23–25% of their bonus determined subjectively. In contrast, the average was 40% for CFOs indicating “Very low” satisfaction.
Satisfaction with compensation is also highly correlated with company performance as measured by the return on sales (see last row of Panel A of Table 8). To isolate away this effect, Panel B holds performance largely constant and presents the results only for the subsample of companies with return on sales of 5–15%. The results are even stronger here—only 15 of the 224 CFOs in these relatively well-performing companies were very dissatisfied with their compensation but most of them had a very large part of their bonus determined subjectively, the average of 56% is more than the double of the overall average.
Table 8. Subjective Bonuses and CFO Satisfaction with Compensation
Note: Tabulated is the percentage of CFO bonus determined subjectively using the same subsample as in Table 5. Columns represent the extent of agreement with the statement that “Overall, my compensation package is well-designed.”
2011 29
Given the high CFO dissatisfaction with subjective bonuses, this sections also provides some guidance on how to limit subjectivity in CFO bonus plans. In particular, we discuss bonus design choices that seem to lower the proportion of bonuses awarded subjectively without any objective targets—the use of nonfinancial targets, greater involvement of corporate boards in CFO compensation, and the use of bonus pools. We also discuss alternative ways to implement relative performance evaluation which is often associated with discretionary adjustments to bonuses based on industry peer performance.
The Use of Objective Nonfinancial Targets
Subjective bonuses are commonly used because financial performance targets do not appropriately reflect CFO actions or are too short-term oriented, motivating myopic actions rather than a long-term focus. However, the shortcomings of financial targets can often be offset by relying on explicit nonfinancial targets instead of resorting to subjectivity.
Table 9 provides more details about the type of nonfinancial performance targets used in CFO bonus plans. It tabulates the percentage of private companies that used various nonfinancial targets in their CFO bonus plans. The first part of Table 9 considers nonfinancial targets regardless of their relative importance in CFO bonus plans (i.e., regardless of the bonus formula weight), the middle part only considers targets that accounted for at least 10% of the bonus opportunity and the last part considers targets that accounted for 20% or more of the bonus opportunity.
The most common and most important nonfinancial performance targets in CFO bonus plans were operations targets as reflected for example in metrics of efficiency, quality, safety, process improvement, or cost control. Of the 719 private companies where data on CFO bonus plans is available, on average, 15% used at least one of these metrics, 10% of the companies awarded at least 10% of CFO bonuses based on one of these metrics, and 6% of the companies awarded at least 20% of bonuses based on one of these metrics.
Another major group are nonfinancial targets related to market & strategy, which includes targets such as for example market share, customer satisfaction, or business development milestones. On average, 9% of the companies used one of these targets, 7% awarded at least 10% of CFO bonuses, and 5% awarded at least 20% of CFO bonuses based on one of these targets.
2011 30
Table 9. Frequency of Various Nonfinancial Targets in CFO Bonus Plans
Sales (In Millions)
Targets used <25 25–49 50–99 100–199 200–499 >500 Average Sample size 197 150 124 104 79 65 719
Operations 12% 12% 13% 12% 23% 28% 15%
Market & Strategy 8% 5% 7% 8% 13% 20% 9%
Accounting & IT 11% 13% 16% 13% 11% 20% 13%
Finance 8% 10% 16% 10% 11% 17% 11%
Teamwork 13% 11% 10% 12% 9% 20% 12%
Sustainability 1% 3% 1% 3% 1% 2% 2%
Targets 10+% of bonus <25 25–49 50–99 100–199 200–499 >500 Average Sample size 193 150 119 102 79 65 708
Operations 9% 7% 7% 8% 11% 22% 10%
Market & Strategy 4% 4% 4% 7% 13% 18% 7%
Accounting & IT 8% 7% 8% 6% 8% 17% 8%
Finance 5% 6% 10% 4% 6% 11% 7%
Teamwork 9% 7% 3% 6% 3% 11% 6%
Sustainability 1% 1% 0% 1% 0% 0% 0%
Targets 20+% of bonus <25 25–49 50–99 100–199 200–499 >500 Average Sample size 193 150 119 102 79 65 708
Operations 6% 7% 5% 3% 8% 14% 6%
Market & Strategy 3% 3% 3% 4% 10% 15% 5%
Accounting & IT 5% 3% 3% 2% 5% 11% 4%
Finance 3% 5% 8% 1% 3% 6% 4%
Teamwork 4% 3% 1% 1% 3% 11% 3%
Sustainability 0% 1% 0% 0% 0% 0% 0%
Note: Same subsample as in Table 5 (i.e., CFO bonus plans in private companies with 20 or more employees). Tabulated are percentages of companies that used at least one nonfinancial performance target from the listed categories in their 2013 CFO bonus plans. The first part of the table covers usage of nonfinancial targets that accounted for less than 10% of the bonus opportunity, the middle part of the table covers targets accounting for 10–19% of the bonus opportunity, and the last part tabulates percentages of companies where listed nonfinancial targets accounted for 20% or more of CFO bonuses. “Operations” includes targets pertaining to, for example, efficiency, quality, safety, process improvement, or cost control. “Market & Strategy” includes targets such as market share, customer satisfaction, business development milestones. “Accounting & IT” refers to timeliness and efficiency of internal and external reporting, ERP system implementation, software upgrades, or management satisfaction. “Finance” refers to working capital management, capex planning, M&A deals, divestitures, or investor relations. “Teamwork” refers to employee turnover, leadership, or collaboration & communication. “Sustainability” refers to energy use, emissions, social reporting, or stakeholder satisfaction.
2011 31
The use of explicit nonfinancial targets relating to CFO functional responsibilities in the area of accounting & IT (e.g., timeliness and efficiency of internal and external reporting, ERP system implementation) and finance (e.g., working capital management, capex planning, M&A deals) as well as explicit nonfinancial performance targets related to teamwork & human resource management (e.g., employee turnover, leadership, collaboration & communication) was also common—used on average by 11–13% of companies. However, these targets were less likely to account for a significant part of the bonus opportunity—only 3–5% of the companies awarded at least 20% of bonuses based on these targets.
In general, larger companies (especially those with sales greater than $500 million) were more likely to use all types of nonfinancial targets except for sustainability targets which were hardly ever used regardless of company size. The difference between smaller and larger companies was particularly pronounced for market & strategy measures and to some extent also for operations measures. In other words, among the large companies it was quite common for CFO bonus plans to include some market & strategy or operations targets, whereas such targets were less common among smaller companies.
Panel A of Table 10 extends the insights from Table 9. Companies that did not use any explicit nonfinancial targets awarded on average 34% of their CFO bonus subjectively. In contrast, the average was 9% in companies using explicit nonfinancial targets. The use of nonfinancial targets was also associated with greater CFO involvement in major business decisions. Panel A of Table 10 shows that in companies using explicit nonfinancial targets 42% of their CFO reported that they were “highly involved” in decisions concerning the range of products/services offered, customer segments targeted, capital expenditures, operating costs, inventory, and accounts receivable. This percentage was lower, 33%, in companies that did not use nonfinancial targets. Finally, note the difference in size between both type of companies. The median company using nonfinancial targets had $74 million in sales and paid CFO cash compensation of $240,000. The median company that did not use nonfinancial targets had $40 million in sales and paid CFO cash compensation of $171,000.
2011 32
Board Influence on CFO Compensation
Another explanation for a common reliance on subjective bonuses is simply the lack of formal performance evaluation procedures. CFOs report to CEOs who typically have good insight into their performance and can award bonuses even in the absence of any explicit goals. However, as discussed earlier, CFOs are commonly dissatisfied with the lack of transparency associated with subjective bonuses. An alternative approach is to set up formal procedures to evaluate CFO performance. This is important in particular when the decision on CFO compensation is made jointly by the CEO and the board.
Panel B of Table 10 shows that about 37% of corporate boards in private companies (257 out of 700 with available data) had a considerable influence on CFO compensation. For comparison (untabulated), the percentage was 70% in public companies. Board influence was associated with a lower reliance on subjective bonuses—19% as compared to 31% in private companies where the CEO made CFO compensation decisions without much board
Table 10. Subjective Bonuses and Other CFO Bonus Plan Choices
Note: Same subsample as in Table 5 (i.e., CFO bonus plans in private companies with 20 or more employees). Panel A contrasts contrast companies that used at least some nonfinancial targets (the sample of companies from the first panel of Table 9) to all other companies. Panel B contrasts companies where corporate boards were involved in CFO compensation decisions (the decisions were made jointly by the CEO and the board or largely by the board) to companies where the decisions were largely made by the CEO with little or no board involvement.
2011 33
involvement. Interestingly, board influence does not seem to be driven primarily by size. Median sales of a company with high board influence were $50 as compared to $40 in companies with low board influence. Median CFO cash compensation was also similar in magnitude, $200,000 as compared to $175,000. Thus, involving boards in CFO compensation decisions seems feasible in companies of all sizes.
Panel B of Table 10 also shows that another benefit of greater board influence on CFO compensation is CFOs’ greater involvement in major business decisions. In companies where board had a high influence on CFO compensation, 40% of CFO reported that they were highly involved in major business decisions as compared to 31% in companies where the board had low influence.
In summary, the results suggest that active influence of the board of directors on CFO compensation may have some benefits. Greater influence may possibly result in a greater interaction between the board and the CFO which may in turn elevate the CFO position and allow for a greater involvement of the CFO in major business decisions. The formal CFO performance evaluation procedures involving both the board and the CEO may also increase the transparency of incentive compensation, e.g., increase the use of explicit financial and nonfinancial targets and reduce the need for subjective bonuses. Finally (and outside the scope of our study), it is worth noting that greater interaction between the board and the CFO may also be important from a governance perspective. Such interaction may strengthen the importance of CFO fiduciary duties in safeguarding the integrity of financial reporting and assuring that the board has timely access to unbiased financial information.
The Use of Bonus Pools
Some companies may prefer the use of subjective bonuses rather than explicit nonfinancial targets because it makes it easier not to pay any bonuses when some nonfinancial targets are met but overall financial performance is weak. For example, when shareholders suffer losses some companies may not want to pay any bonuses regardless of performance on nonfinancial and other targets. This feature can also be incorporated into bonus plans of CFOs (and other executives) through the use of bonus pools.
2011 34
Bonus pools are incentive arrangements that get funded only if some pre-specified typically financial targets are met. Better financial performance often increases the size of the bonus pool up to some maximum. Once the pool is funded, bonuses from the pool are distributed among eligible executives based on their individual performance as measured by various targets. However, even great performance on some individual targets yields no bonuses if the initial funding target based on overall company performance is not met. Bonus pool arrangements can still leave open the possibility of a subjective override—e.g., funding the bonus pool despite poor financial performance, not funding the pool even if the initial funding target was met, or awarding bonuses even if individual targets were not met. Table 11 compares companies (i) using bonus pools funded by meeting an earnings threshold, (ii) using bonus pools funded by meeting some other threshold, (iii) using bonus pools the size of which is determined subjectively, (iv) not using bonus pools and awarding bonuses without any funding conditions either subjectively or based on performance relative to explicit financial targets or nonfinancial targets. We find that 27% of private companies (177 out of 647 with available data) used bonus plans with earnings thresholds, 7% bonus pools with some other threshold, and 4% bonus pools determined subjectively. The remaining 62% did not use bonus pool arrangements.
The use of bonus pools commonly reduces the need for subjective bonuses. The average proportion of CFO bonus determined subjectively was 20% in companies using bonus pools with earnings thresholds as compared to 28% in companies using no bonus pools. Companies with subjectively determined bonus pools often reported sizable losses which
Table 11. Subjective Bonuses and Bonus Pools
Note: Same subsample as in Table 5 (i.e., CFO bonus plans in private companies with 20 or more employees). See above for a definition of bonus pools.
2011 35
likely reflects subjective overrides when initial funding conditions were not met. In such situations the use of subjective bonuses was highest, 40% on average.
Also note that companies using bonus pools with earnings thresholds were similar in size and profitability to companies using no bonus pools. The major difference was in the magnitude of CFO incentive compensation. Specifically, CFOs in companies using bonus pools with earnings thresholds earned bonuses that were on average 64% of their salaries. In contrast, CFOs in companies with no bonus pools earned bonuses that were 36% of their salaries. Seemingly, the built-in feature of paying no bonuses for losses or poor earnings also allows companies to pay higher bonuses when earnings targets are met.
The Use of Relative Performance Evaluation
Another drawback of objective targets is that they are set at the beginning of the year when there is great uncertainty about the next evaluation period, which can make targets outdated by the end of the year. The advantage of subjective bonuses is that they can be awarded at the end of the year after adjusting expectations for any good or bad luck during the year. This is also the reason why some companies evaluate performance relative to a group of industry peers whose performance is affected by business volatility in a similar way.
Table 12 compares companies that use information about peer performance when awarding bonuses to their CFOs: (i) companies using information about past peer performance to set targets for next year, (ii) companies awarding subjective bonuses at the end of the period after taking into account peer performance, and (iii) companies that do not rely on relative performance evaluation.
We find that the use of subjective bonuses to incorporate information about industry peers is not very common. Only about 9% of the private companies in our sample (60 out of 656) did so, another 9% used information about peers when setting targets, and 82% of the companies did not use any type of relative evaluation. Companies that used information about peer performance were larger with median sales of $62–69 million as compared to $49 million in companies that did not use information about peers. Not surprisingly, the use of subjective bonuses was highest among companies that evaluated performance at the
2011 36
end of the year relative to a group of industry peers; the average proportion of CFO bonus awarded subjectively (i.e., without pre-set targets) was 50%.
There are at least two options for companies that want to evaluate performance relative to peers but at the same time want to reduce the perception among CFOs that bonuses are awarded subjectively with little transparency. First, at the beginning of the year, companies can provide more details about how performance relative to peers will be evaluated and specify how much of potential bonus opportunity will depend on fixed beginning-of-the-year targets and how much will be contingent on performance relative to peers to be determined at the end of the year. Second, companies may evaluate end-of-the-year performance strictly relative to fixed, beginning-of-the-year targets but use information about peers’ end-of-the-year performance when setting targets for the next year.
Table 12 shows that the second approach reduced the perception among CFOs that bonuses were awarded subjectively. The average proportion of subjective bonus in companies where relative evaluation was built into targets was 25%, essentially the same as among the companies that did not use relative performance evaluation and much lower than the 50% in companies where relative evaluation was built in subjectively. However, it is an open question whether relative evaluation built into targets is as effective as relative evaluation based on end-of-the-period subjective assessment.
Our survey can provide only limited insights about the effectiveness of relative performance evaluation but it is interesting to note that companies that did not use
Table 12. Subjective Bonuses and Relative Performance Evaluation (RPE)
Note: Same subsample as in Table 5 (i.e., CFO bonus plans in private companies with 20 or more employees). RPE built into targets refers to companies using information about past peer performance to set targets for next year. RPE built in subjectively refers to companies awarding subjective bonuses at the end of the period after taking into account peer performance. No RPE used refers to companies that do not rely on relative performance evaluation.
2011 37
information about peers paid the highest bonuses. Specifically, the average CFO bonus as a percentage of salary was 48% and the average return on sales was 6.7% in companies that did not use any relative performance evaluation. In contrast, companies that made subjective end-of-the-period adjustments based on peer performance had a much higher average return on sales of 14.9%, but their bonuses were only 34% of salary on average. Similarly, companies where peer performance was built into targets had a return on sales of 6.4% and bonuses were 33% of salary on average.
This evidence may suggest that both types of relative performance evaluation help adjust expectations for performance at the end of the year. In particular, as the overall economy continued to improve during 2012, companies using relative performance evaluations seem to have justifiably increased their performance expectations and consequently paid lower bonuses than companies relying primarily on targets set at the beginning of 2012. In summary, relative performance evaluation allows companies to adjust performance expectations for uncontrollable factors such as overall economic growth. One way to do so is to make subjective end-of-the-year adjustments to bonuses based on peer performance. We find that an equally common way, which may also be effective in adjusting performance expectations, is to use information about current peer performance when setting targets for the next period. The advantage of the latter approach is that throughout the year executives know exactly what the performance expectations are, which increases transparency and reduces the perception that bonuses are awarded subjectively.
2011 38
Target Setting
This section examines how companies set earnings targets as well as other financial and nonfinancial targets. The sample includes all companies and business units (private and public) where performance target data is available, except for nonprofit entities. Thus, the findings are not specific just to CFO bonus plans as in the previous section. We start out by examining earnings targets.
Figure 1 shows the trend in earnings targets between 2008 and 2013. Following the 2008– 2009 recession, there was a steady trend upwards from the low of 4.57% targeted return on sales in 2009 to 6.25% in 2012. Average actual return on sales of 6.33% in 2012 slightly
Figure 1. 2008–2013 Earnings Targets
5.45% 4.57% 5.00% 6.00% 6.25% 7.50% 4.00% 5.00% 6.33% 3% 4% 5% 6% 7% 8% 2008 2009 2010 2011 2012 2013 Earnings Targets Actual Earnings
Note: Median earnings targets (return on sales) are marked in blue and median actual earnings are marked in red. 2012– 2013 earnings targets and 2012 actual earnings are from the current 2013 survey (about 1,485 entities included), 2010– 2011 earnings targets and 2010 actual earnings are from the 2011 survey (about 570 entities included), and 2008–2009 earnings targets and 2008 actual earnings are from the 2009 survey (about 830 entities included).