OpenShift Container Platform 4.3
Logging
Configuring cluster logging in OpenShift Container Platform
OpenShift Container Platform 4.3 Logging
Configuring cluster logging in OpenShift Container Platform
Copyright © 2020 Red Hat, Inc.
The text of and illustrations in this document are licensed by Red Hat under a Creative Commons
Attribution–Share Alike 3.0 Unported license ("CC-BY-SA"). An explanation of CC-BY-SA is
available at
http://creativecommons.org/licenses/by-sa/3.0/
. In accordance with CC-BY-SA, if you distribute this document or an adaptation of it, you must
provide the URL for the original version.
Red Hat, as the licensor of this document, waives the right to enforce, and agrees not to assert,
Section 4d of CC-BY-SA to the fullest extent permitted by applicable law.
Red Hat, Red Hat Enterprise Linux, the Shadowman logo, the Red Hat logo, JBoss, OpenShift,
Fedora, the Infinity logo, and RHCE are trademarks of Red Hat, Inc., registered in the United States
and other countries.
Linux ® is the registered trademark of Linus Torvalds in the United States and other countries.
Java ® is a registered trademark of Oracle and/or its affiliates.
XFS ® is a trademark of Silicon Graphics International Corp. or its subsidiaries in the United States
and/or other countries.
MySQL ® is a registered trademark of MySQL AB in the United States, the European Union and
other countries.
Node.js ® is an official trademark of Joyent. Red Hat is not formally related to or endorsed by the
official Joyent Node.js open source or commercial project.
The OpenStack ® Word Mark and OpenStack logo are either registered trademarks/service marks
or trademarks/service marks of the OpenStack Foundation, in the United States and other
countries and are used with the OpenStack Foundation's permission. We are not affiliated with,
endorsed or sponsored by the OpenStack Foundation, or the OpenStack community.
All other trademarks are the property of their respective owners.
Abstract
This document provides instructions for installing, configuring, and using cluster logging, which
aggregates logs for a range of OpenShift Container Platform services.
. . . . . . . . . . . . . . . . . . . . . . . . . . . .
Table of Contents
CHAPTER 1. UNDERSTANDING CLUSTER LOGGING AND OPENSHIFT CONTAINER PLATFORM 1.1. CLUSTER LOGGING
1.1.1. Cluster logging components 1.1.2. About the log store
1.1.3. About the logging collector 1.1.4. About logging visualization 1.1.5. About logging curation 1.1.6. About event routing
1.1.7. About the Cluster Logging Custom Resource CHAPTER 2. ABOUT DEPLOYING CLUSTER LOGGING
2.1. ABOUT DEPLOYING AND CONFIGURING CLUSTER LOGGING 2.1.1. Configuring and Tuning Cluster Logging
2.1.2. Sample modified Cluster Logging Custom Resource
2.2. STORAGE CONSIDERATIONS FOR CLUSTER LOGGING AND OPENSHIFT CONTAINER PLATFORM 2.3. ADDITIONAL RESOURCES
CHAPTER 3. DEPLOYING CLUSTER LOGGING
3.1. INSTALL THE ELASTICSEARCH OPERATOR USING THE CLI
3.2. INSTALL THE CLUSTER LOGGING OPERATOR USING THE WEB CONSOLE 3.3. INSTALL THE CLUSTER LOGGING OPERATOR USING THE CLI
3.4. ADDITIONAL RESOURCES
CHAPTER 4. UPDATING CLUSTER LOGGING 4.1. UPDATING CLUSTER LOGGING
CHAPTER 5. VIEWING CLUSTER LOGS 5.1. VIEWING CLUSTER LOGS
5.2. VIEWING CLUSTER LOGS IN THE OPENSHIFT CONTAINER PLATFORM WEB CONSOLE CHAPTER 6. VIEWING CLUSTER LOGS USING KIBANA
6.1. LAUNCHING KIBANA
CHAPTER 7. CONFIGURING YOUR CLUSTER LOGGING DEPLOYMENT 7.1. ABOUT CONFIGURING CLUSTER LOGGING
7.1.1. About deploying and configuring cluster logging 7.1.1.1. Configuring and Tuning Cluster Logging
7.1.1.2. Sample modified Cluster Logging Custom Resource 7.2. CHANGING CLUSTER LOGGING MANAGEMENT STATE
7.2.1. Changing the cluster logging management state 7.2.2. Changing the Elasticsearch management state 7.3. CONFIGURING CLUSTER LOGGING
7.3.1. Understanding the cluster logging component images
7.4. CONFIGURING ELASTICSEARCH TO STORE AND ORGANIZE LOG DATA 7.4.1. Configuring Elasticsearch CPU and memory limits
7.4.2. Configuring Elasticsearch replication policy 7.4.3. Configuring Elasticsearch storage
7.4.4. Configuring Elasticsearch for emptyDir storage 7.4.5. Exposing Elasticsearch as a route
7.4.6. About Elasticsearch alerting rules 7.5. CONFIGURING KIBANA
7.5.1. Configure Kibana CPU and memory limits 7.5.2. Scaling Kibana for redundancy
6 6 6 6 7 7 8 8 8 10 10 10 12 13 13 14 14 17 21 26 27 27 30 30 30 32 32 34 34 34 34 36 37 38 39 39 41 41 42 43 44 45 45 48 49 49 50 Table of Contents
. . . .
. . . .
. . . . . . . . . . . .
7.5.3. Using tolerations to control the Kibana Pod placement 7.5.4. Installing the Kibana Visualize tool
7.6. CURATION OF ELASTICSEARCH DATA 7.6.1. Configuring the Curator schedule 7.6.2. Configuring Curator index deletion 7.6.3. Troubleshooting Curator
7.6.4. Configuring Curator in scripted deployments 7.6.5. Using the Curator Action file
7.7. CONFIGURING THE LOGGING COLLECTOR 7.7.1. Viewing logging collector pods
7.7.2. Configure log collector CPU and memory limits 7.7.3. Configuring Buffer Chunk Limiting for Fluentd
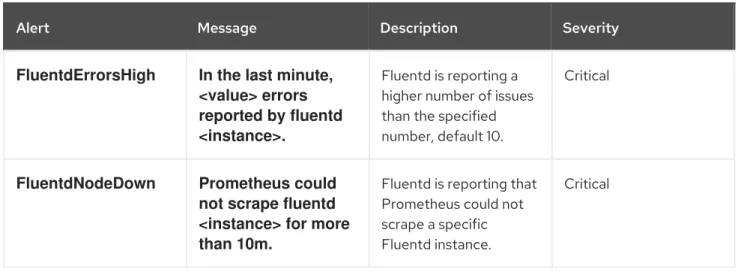
7.7.4. Configuring the logging collector using environment variables 7.7.5. About logging collector alerts
7.8. COLLECTING AND STORING KUBERNETES EVENTS 7.8.1. Deploying and configuring the Event Router
7.9. USING TOLERATIONS TO CONTROL CLUSTER LOGGING POD PLACEMENT 7.9.1. Using tolerations to control the Elasticsearch Pod placement
7.9.2. Using tolerations to control the Kibana Pod placement 7.9.3. Using tolerations to control the Curator Pod placement 7.9.4. Using tolerations to control the log collector Pod placement 7.9.5. Additional resources
7.10. FORWARD LOGS TO THIRD PARTY SYSTEMS 7.10.1. Forwarding logs using the Fluentd forward protocol 7.10.2. Forwarding logs using the syslog protocol
7.10.3. Forwarding logs using the Log Forwarding API 7.10.3.1. Understanding the Log Forwarding API 7.10.3.2. Enabling the Log Forwarding API
7.10.3.3. Configuring log forwarding using the Log Forwarding API 7.10.3.3.1. Example log forwarding custom resources
7.10.3.4. Disabling the Log Forwarding API
7.11. CONFIGURING SYSTEMD-JOURNALD AND FLUENTD 7.11.1. Configuring systemd-journald for cluster logging CHAPTER 8. VIEWING ELASTICSEARCH STATUS
8.1. VIEWING ELASTICSEARCH STATUS 8.1.1. Example condition messages
8.2. VIEWING ELASTICSEARCH COMPONENT STATUS CHAPTER 9. VIEWING CLUSTER LOGGING STATUS
9.1. VIEWING THE STATUS OF THE CLUSTER LOGGING OPERATOR 9.1.1. Example condition messages
9.2. VIEWING THE STATUS OF CLUSTER LOGGING COMPONENTS
CHAPTER 10. MOVING THE CLUSTER LOGGING RESOURCES WITH NODE SELECTORS 10.1. MOVING THE CLUSTER LOGGING RESOURCES
CHAPTER 11. MANUALLY ROLLING OUT ELASTICSEARCH
11.1. PERFORMING AN ELASTICSEARCH ROLLING CLUSTER RESTART CHAPTER 12. TROUBLESHOOTING KIBANA
12.1. TROUBLESHOOTING A KUBERNETES LOGIN LOOP
12.2. TROUBLESHOOTING A KUBERNETES CRYPTIC ERROR WHEN VIEWING THE KIBANA CONSOLE 12.3. TROUBLESHOOTING A KUBERNETES 503 ERROR WHEN VIEWING THE KIBANA CONSOLE
51 52 53 53 54 56 57 58 59 60 60 61 63 63 64 64 68 69 70 71 72 74 74 74 78 81 82 84 85 87 88 89 89 92 92 94 95 99 99 101 103 105 105 109 109 113 113 113 113
. . . . CHAPTER 13. EXPORTED FIELDS
13.1. DEFAULT EXPORTED FIELDS Top Level Fields
collectd Fields collectd.processes Fields collectd.processes.ps_disk_ops Fields collectd.processes.ps_cputime Fields collectd.processes.ps_count Fields collectd.processes.ps_pagefaults Fields collectd.processes.ps_disk_octets Fields collectd.disk Fields collectd.disk.disk_merged Fields collectd.disk.disk_octets Fields collectd.disk.disk_time Fields collectd.disk.disk_ops Fields collectd.disk.disk_io_time Fields collectd.interface Fields collectd.interface.if_octets Fields collectd.interface.if_packets Fields collectd.interface.if_errors Fields collectd.interface.if_dropped Fields collectd.virt Fields collectd.virt.if_octets Fields collectd.virt.if_packets Fields collectd.virt.if_errors Fields collectd.virt.if_dropped Fields collectd.virt.disk_ops Fields collectd.virt.disk_octets Fields collectd.CPU Fields collectd.df Fields collectd.entropy Fields collectd.memory Fields collectd.swap Fields collectd.load Fields collectd.load.load Fields collectd.aggregation Fields collectd.statsd Fields collectd.postgresql Fields
13.2. SYSTEMD EXPORTED FIELDS systemd.k Fields
systemd.t Fields systemd.u Fields
13.3. KUBERNETES EXPORTED FIELDS kubernetes.labels Fields
kubernetes.annotations Fields 13.4. CONTAINER EXPORTED FIELDS
pipeline_metadata.collector Fields pipeline_metadata.normalizer Fields 13.5. OVIRT EXPORTED FIELDS
ovirt.engine Fields
13.6. AUSHAPE EXPORTED FIELDS aushape.data Fields
13.7. TLOG EXPORTED FIELDS
115 115 115 117 117 117 118 118 118 119 119 119 119 120 120 120 121 121 121 121 122 122 122 122 122 123 123 123 124 124 124 124 125 125 125 125 126 129 130 130 130 132 132 132 133 133 133 134 134 135 135 135 136 Table of Contents
. . . . CHAPTER 14. UNINSTALLING CLUSTER LOGGING
14.1. UNINSTALLING CLUSTER LOGGING FROM OPENSHIFT CONTAINER PLATFORM
137 137
CHAPTER 1. UNDERSTANDING CLUSTER LOGGING AND
OPENSHIFT CONTAINER PLATFORM
As a cluster administrator, you can deploy cluster logging to aggregate all the logs from your OpenShift Container Platform cluster, such as node system logs, application container logs, and so forth.
1.1. CLUSTER LOGGING
OpenShift Container Platform cluster administrators can deploy cluster logging using a few CLI
commands and the OpenShift Container Platform web console to install the Elasticsearch Operator and Cluster Logging Operator. When the operators are installed, create a Cluster Logging Custom Resource (CR) to schedule cluster logging pods and other resources necessary to support cluster logging. The operators are responsible for deploying, upgrading, and maintaining cluster logging.
You can configure cluster logging by modifying the Cluster Logging Custom Resource (CR), named instance. The CR defines a complete cluster logging deployment that includes all the components of the logging stack to collect, store and visualize logs. The Cluster Logging Operator watches the ClusterLogging Custom Resource and adjusts the logging deployment accordingly.
Administrators and application developers can view the logs of the projects for which they have view access.
1.1.1. Cluster logging components
The cluster logging components are based upon Elasticsearch, Fluentd, and Kibana (EFK). The collector,
Fluentd, is deployed to each node in the OpenShift Container Platform cluster. It collects all node and container logs and writes them to Elasticsearch (ES). Kibana is the centralized, web UI where users and administrators can create rich visualizations and dashboards with the aggregated data.
There are currently 5 different types of cluster logging components:
logStore - This is where the logs will be stored. The current implementation is Elasticsearch. collection - This is the component that collects logs from the node, formats them, and stores them in the logStore. The current implementation is Fluentd.
visualization - This is the UI component used to view logs, graphs, charts, and so forth. The current implementation is Kibana.
curation - This is the component that trims logs by age. The current implementation is Curator. In this document, we may refer to logStore or Elasticsearch, visualization or Kibana, curation or Curator, collection or Fluentd, interchangeably, except where noted.
1.1.2. About the log store
OpenShift Container Platform uses Elasticsearch (ES) to organize the log data from Fluentd into datastores, or indices.
Elasticsearch subdivides each index into multiple pieces called shards, which it spreads across a set of Elasticsearch nodes in an Elasticsearch cluster. You can configure Elasticsearch to make copies of the shards, called replicas. Elasticsearch also spreads these replicas across the Elasticsearch nodes. The ClusterLogging Custom Resource allows you to specify the replication policy in the Custom Resource Definition (CRD) to provide data redundancy and resilience to failure.
The cluster logging Elasticsearch instance is optimized and tested for short term storage of
approximately seven days. If you want to retain your logs over a longer term, it is recommended that you move the data to a third-party storage system.
NOTE
The number of primary shards for the index templates is equal to the number of Elasticsearch data nodes.
The Cluster Logging Operator and companion Elasticsearch Operator ensure that each Elasticsearch node is deployed using a unique Deployment that includes its own storage volume. You can use a Cluster Logging Custom Resource (CR) to increase the number of Elasticsearch nodes. Refer to
Elastic’s documentation for considerations involved in choosing storage and network location as directed below.
NOTE
A highly-available Elasticsearch environment requires at least three Elasticsearch nodes, each on a different host.
Role-based access control (RBAC) applied on the Elasticsearch indices enables the controlled access of the logs to the developers. Access to the indexes with the project.{project_name}.{project_uuid}.* format is restricted based on the permissions of the user in the specific project.
For more information, see Elasticsearch (ES).
1.1.3. About the logging collector
OpenShift Container Platform uses Fluentd to collect data about your cluster.
The logging collector is deployed as a DaemonSet in OpenShift Container Platform that deploys pods to each OpenShift Container Platform node. journald is the system log source supplying log messages from the operating system, the container runtime, and OpenShift Container Platform.
The container runtimes provide minimal information to identify the source of log messages: project, pod name, and container id. This is not sufficient to uniquely identify the source of the logs. If a pod with a given name and project is deleted before the log collector begins processing its logs, information from the API server, such as labels and annotations, might not be available. There might not be a way to distinguish the log messages from a similarly named pod and project or trace the logs to their source. This limitation means log collection and normalization is considered best effort.
IMPORTANT
The available container runtimes provide minimal information to identify the source of log messages and do not guarantee unique individual log messages or that these messages can be traced to their source.
For more information, see Fluentd.
1.1.4. About logging visualization
OpenShift Container Platform uses Kibana to display the log data collected by Fluentd and indexed by Elasticsearch.
1
Kibana is a browser-based console interface to query, discover, and visualize your Elasticsearch data through histograms, line graphs, pie charts, heat maps, built-in geospatial support, and other
visualizations.
For more information, see Kibana.
1.1.5. About logging curation
The Elasticsearch Curator tool performs scheduled maintenance operations on a global and/or on a per-project basis. Curator performs actions based on its configuration. Only one Curator Pod is
recommended per Elasticsearch cluster.
Specify the Curator schedule in the cron format. For more information, see Curator.
1.1.6. About event routing
The Event Router is a Pod that watches OpenShift Container Platform events so they can be collected by cluster logging. The Event Router collects events from all projects and writes them to STDOUT. Fluentd collects those events and forwards them into the OpenShift Container Platform Elasticsearch instance. Elasticsearch indexes the events to the infra index.
You must manually deploy the Event Router.
1.1.7. About the Cluster Logging Custom Resource
To make changes to your cluster logging deployment, create and modify the Cluster Logging Custom Resource (CR). Instructions for creating or modifying a CR are provided in this documentation as appropriate.
The following is an example of a typical Custom Resource for cluster logging.
Sample Cluster Logging CR
spec: curation: type: "curator" resources: curator: schedule: "30 3 * * *" 1 apiVersion: "logging.openshift.io/v1" kind: "ClusterLogging" metadata: name: "instance" namespace: openshift-logging spec: managementState: "Managed" logStore: type: "elasticsearch" elasticsearch: nodeCount: 3 resources:
limits: memory: 16Gi requests: cpu: 500m memory: 16Gi storage: storageClassName: "gp2" size: "200G" redundancyPolicy: "SingleRedundancy" visualization: type: "kibana" kibana: resources: limits: memory: 1Gi requests: cpu: 500m memory: 1Gi proxy: resources: limits: memory: 100Mi requests: cpu: 100m memory: 100Mi replicas: 2 curation: type: "curator" curator: resources: limits: memory: 200Mi requests: cpu: 200m memory: 200Mi schedule: "*/10 * * * *" collection: logs: type: "fluentd" fluentd: resources: limits: memory: 1Gi requests: cpu: 200m memory: 1Gi
CHAPTER 2. ABOUT DEPLOYING CLUSTER LOGGING
Before installing cluster logging into your OpenShift Container Platform cluster, review the following sections.
2.1. ABOUT DEPLOYING AND CONFIGURING CLUSTER LOGGING
OpenShift Container Platform cluster logging is designed to be used with the default configuration, which is tuned for small to medium sized OpenShift Container Platform clusters.
The installation instructions that follow include a sample Cluster Logging Custom Resource (CR), which you can use to create a cluster logging instance and configure your cluster logging deployment.
If you want to use the default cluster logging install, you can use the sample CR directly.
If you want to customize your deployment, make changes to the sample CR as needed. The following describes the configurations you can make when installing your cluster logging instance or modify after installation. See the Configuring sections for more information on working with each component, including modifications you can make outside of the Cluster Logging Custom Resource.
2.1.1. Configuring and Tuning Cluster Logging
You can configure your cluster logging environment by modifying the Cluster Logging Custom Resource deployed in the openshift-logging project.
You can modify any of the following components upon install or after install: Memory and CPU
You can adjust both the CPU and memory limits for each component by modifying the resources block with valid memory and CPU values:
spec: logStore: elasticsearch: resources: limits: cpu: memory: 16Gi requests: cpu: 500m memory: 16Gi type: "elasticsearch" collection: logs: fluentd: resources: limits: cpu: memory: requests: cpu: memory: type: "fluentd" visualization: kibana:
resources: limits: cpu: memory: requests: cpu: memory: type: kibana curation: curator: resources: limits: memory: 200Mi requests: cpu: 200m memory: 200Mi type: "curator" Elasticsearch storage
You can configure a persistent storage class and size for the Elasticsearch cluster using the storageClassname and size parameters. The Cluster Logging Operator creates a
PersistentVolumeClaim for each data node in the Elasticsearch cluster based on these parameters. spec: logStore: type: "elasticsearch" elasticsearch: nodeCount: 3 storage: storageClassName: "gp2" size: "200G"
This example specifies each data node in the cluster will be bound to a PersistentVolumeClaim that requests "200G" of "gp2" storage. Each primary shard will be backed by a single replica.
NOTE
Omitting the storage block results in a deployment that includes ephemeral storage only. spec: logStore: type: "elasticsearch" elasticsearch: nodeCount: 3 storage: {}
Elasticsearch replication policy
You can set the policy that defines how Elasticsearch shards are replicated across data nodes in the cluster:
FullRedundancy. The shards for each index are fully replicated to every data node. MultipleRedundancy. The shards for each index are spread over half of the data nodes. SingleRedundancy. A single copy of each shard. Logs are always available and recoverable
SingleRedundancy. A single copy of each shard. Logs are always available and recoverable as long as at least two data nodes exist.
ZeroRedundancy. No copies of any shards. Logs may be unavailable (or lost) in the event a node is down or fails.
Curator schedule
You specify the schedule for Curator in the cron format. spec: curation: type: "curator" resources: curator: schedule: "30 3 * * *"
2.1.2. Sample modified Cluster Logging Custom Resource
The following is an example of a Cluster Logging Custom Resource modified using the options previously described.
Sample modified Cluster Logging Custom Resource
apiVersion: "logging.openshift.io/v1" kind: "ClusterLogging" metadata: name: "instance" namespace: "openshift-logging" spec: managementState: "Managed" logStore: type: "elasticsearch" elasticsearch: nodeCount: 3 resources: limits: memory: 32Gi requests: cpu: 3 memory: 32Gi storage: {} redundancyPolicy: "SingleRedundancy" visualization: type: "kibana" kibana: resources: limits: memory: 1Gi requests: cpu: 500m memory: 1Gi replicas: 1 curation: type: "curator"curator: resources: limits: memory: 200Mi requests: cpu: 200m memory: 200Mi schedule: "*/5 * * * *" collection: logs: type: "fluentd" fluentd: resources: limits: memory: 1Gi requests: cpu: 200m memory: 1Gi
2.2. STORAGE CONSIDERATIONS FOR CLUSTER LOGGING AND
OPENSHIFT CONTAINER PLATFORM
A persistent volume is required for each Elasticsearch deployment to have one data volume per data node. On OpenShift Container Platform this is achieved using Persistent Volume Claims.
The Elasticsearch Operator names the PVCs using the Elasticsearch resource name. Refer to Persistent Elasticsearch Storage for more details.
Fluentd ships any logs from systemd journal and /var/log/containers/ to Elasticsearch.
Therefore, consider how much data you need in advance and that you are aggregating application log data. Some Elasticsearch users have found that it is necessary to keep absolute storage consumption around 50% and below 70% at all times. This helps to avoid Elasticsearch becoming unresponsive during large merge operations.
By default, at 85% Elasticsearch stops allocating new data to the node, at 90% Elasticsearch attempts to relocate existing shards from that node to other nodes if possible. But if no nodes have free capacity below 85%, Elasticsearch effectively rejects creating new indices and becomes RED.
NOTE
These low and high watermark values are Elasticsearch defaults in the current release. You can modify these values, but you also must apply any modifications to the alerts also. The alerts are based on these defaults.
2.3. ADDITIONAL RESOURCES
For more information on installing operators,see Installing Operators from the OperatorHub.
1
2
CHAPTER 3. DEPLOYING CLUSTER LOGGING
You can install cluster logging by deploying the Elasticsearch and Cluster Logging Operators. The Elasticsearch Operator creates and manages the Elasticsearch cluster used by cluster logging. The Cluster Logging Operator creates and manages the components of the logging stack.
The process for deploying cluster logging to OpenShift Container Platform involves: Reviewing the installation options in About deploying cluster logging. Reviewing the cluster logging storage considerations.
Installing the Elasticsearch Operator and Cluster Logging Operator.
3.1. INSTALL THE ELASTICSEARCH OPERATOR USING THE CLI
You must install the Elasticsearch Operator using the CLI following the directions below.
Prerequisites
Ensure that you have the necessary persistent storage for Elasticsearch. Note that each Elasticsearch node requires its own storage volume.
Elasticsearch is a memory-intensive application. By default, OpenShift Container Platform installs three Elasticsearch nodes with memory requests and limits of 16 GB. This initial set of three OpenShift
Container Platform nodes might not have enough memory to run Elasticsearch within your cluster. If you experience memory issues that are related to Elasticsearch, you should add more Elasticsearch nodes to your cluster rather than increasing the memory on exiting nodes.
Procedure
To install the Elasticsearch Operator using the CLI:
1. Create a Namespace for the Elasticsearch Operator.
a. Create a Namespace object YAML file (for example, eo-namespace.yaml) for the Elasticsearch Operator:
You must specify the openshift-operators-redhat Namespace. To prevent possible conflicts with metrics, you should configure the Prometheus Cluster Monitoring stack to scrape metrics from the openshift-operators-redhat Namespace and not the openshift-operators Namespace. The openshift-operators Namespace might contain Community Operators, which are untrusted and could publish a metric with the same name as an OpenShift Container Platform metric, which would cause conflicts. You must specify this label as shown to ensure that cluster monitoring scrapes the openshift-operators-redhat Namespace. apiVersion: v1 kind: Namespace metadata: name: openshift-operators-redhat 1 annotations: openshift.io/node-selector: "" labels: openshift.io/cluster-monitoring: "true" 2
1
1 2 3
b. Create the Namespace:
$ oc create -f <file-name>.yaml For example:
$ oc create -f eo-namespace.yaml
2. Install the Elasticsearch Operator by creating the following objects:
a. Create an Operator Group object YAML file (for example, eo-og.yaml) for the Elasticsearch operator:
You must specify the openshift-operators-redhat Namespace. b. Create an Operator Group object:
$ oc create -f <file-name>.yaml For example:
$ oc create -f eo-og.yaml
c. Create a Subscription object YAML file (for example, eo-sub.yaml) to subscribe a Namespace to an Operator.
Example Subscription
You must specify the openshift-operators-redhat Namespace. Specify 4.3 as the channel.
Specify redhat-operators. If your OpenShift Container Platform cluster is installed on a restricted network, also known as a disconnected cluster, specify the name of the apiVersion: operators.coreos.com/v1 kind: OperatorGroup metadata: name: openshift-operators-redhat namespace: openshift-operators-redhat 1 spec: {} apiVersion: operators.coreos.com/v1alpha1 kind: Subscription metadata: name: "elasticsearch-operator" namespace: "openshift-operators-redhat" 1 spec: channel: "4.3" 2 installPlanApproval: "Automatic" source: "redhat-operators" 3 sourceNamespace: "openshift-marketplace" name: "elasticsearch-operator"
CatalogSource object created when you configured the Operator Lifecycle Manager (OLM).
d. Create the Subscription object: $ oc create -f <file-name>.yaml For example:
$ oc create -f eo-sub.yaml
e. Change to the openshift-operators-redhat project: $ oc project openshift-operators-redhat
Now using project "openshift-operators-redhat"
f. Create a Role-based Access Control (RBAC) object file (for example, eo-rbac.yaml) to grant Prometheus permission to access the openshift-operators-redhat Namespace:
g. Create the RBAC object:
apiVersion: rbac.authorization.k8s.io/v1 kind: Role metadata: name: prometheus-k8s namespace: openshift-operators-redhat rules: - apiGroups: - "" resources: - services - endpoints - pods verbs: - get - list - watch ---apiVersion: rbac.authorization.k8s.io/v1 kind: RoleBinding metadata: name: prometheus-k8s namespace: openshift-operators-redhat roleRef: apiGroup: rbac.authorization.k8s.io kind: Role name: prometheus-k8s subjects: - kind: ServiceAccount name: prometheus-k8s namespace: openshift-operators-redhat
$ oc create -f <file-name>.yaml For example:
$ oc create -f eo-rbac.yaml
The Elasticsearch Operator is installed to the openshift-operators-redhat Namespace and copied to each project in the cluster.
3. Verify the Operator installation: oc get csv --all-namespaces
NAMESPACE NAME DISPLAY VERSION REPLACES PHASE
default elasticsearch-operator.4.3.1-202002032140 Elasticsearch Operator 4.3.1-202002032140 Succeeded
kube-node-lease elasticsearch-operator.4.3.1-202002032140 Elasticsearch Operator 4.3.1-202002032140 Succeeded
kube-public elasticsearch-operator.4.3.1-202002032140 Elasticsearch Operator 4.3.1-202002032140 Succeeded
kube-system elasticsearch-operator.4.3.1-202002032140 Elasticsearch Operator 4.3.1-202002032140 Succeeded
openshift-apiserver-operator elasticsearch-operator.4.3.1-202002032140 Elasticsearch Operator 4.3.1-202002032140 Succeeded
openshift-apiserver elasticsearch-operator.4.3.1-202002032140 Elasticsearch Operator 4.3.1-202002032140 Succeeded
openshift-authentication-operator elasticsearch-operator.4.3.1-202002032140 Elasticsearch Operator 4.3.1-202002032140 Succeeded
openshift-authentication elasticsearch-operator.4.3.1-202002032140 Elasticsearch Operator 4.3.1-202002032140 Succeeded
...
There should be an Elasticsearch Operator in each Namespace. The version number might be different than shown.
Next step
Install the Cluster Logging Operator using the Console or the CLI using the steps in the following sections.
3.2. INSTALL THE CLUSTER LOGGING OPERATOR USING THE WEB
CONSOLE
You can use the OpenShift Container Platform web console to install the Cluster Logging Operator.
NOTE
You cannot create a Project starting with openshift- using the web console or by using the oc new-project command. You must create a Namespace using a YAML object file and run the oc create -f <file-name>.yaml command, as shown.
Procedure
1 2 3
To install the Cluster Logging Operator using the OpenShift Container Platform web console: 1. Create a Namespace for the Cluster Logging Operator. You must use the CLI to create the
Namespace.
a. Create a Namespace object YAML file (for example, clo-namespace.yaml) for the Cluster Logging Operator:
Specify these values as shown. b. Create the Namespace:
$ oc create -f <file-name>.yaml For example:
$ oc create -f clo-namespace.yaml 2. Install the Cluster Logging Operator:
a. In the OpenShift Container Platform web console, click Operators→OperatorHub. b. Choose Cluster Logging from the list of available Operators, and click Install.
c. On the Create Operator Subscription page, under A specific Namespace on the cluster select openshift-logging. Then, click Subscribe.
3. Verify that the Cluster Logging Operator installed:
a. Switch to the Operators→Installed Operators page.
b. Ensure that Cluster Logging is listed in the openshift-logging project with a Status of InstallSucceeded.
NOTE
During installation an Operator might display a Failed status. If the Operator then installs with an InstallSucceeded message, you can safely ignore the Failed message.
If the Operator does not appear as installed, to troubleshoot further:
Switch to the Operators→Installed Operators page and inspect the Status column for any errors or failures.
apiVersion: v1 kind: Namespace metadata: name: openshift-logging 1 annotations: openshift.io/node-selector: "" 2 labels: openshift.io/cluster-monitoring: "true" 3
1
Switch to the Workloads→Pods page and check the logs in any Pods in the openshift-logging and openshift-operators-redhat projects that are reporting issues.
4. Create a cluster logging instance:
a. Switch to the Administration→Custom Resource Definitions page. b. On the Custom Resource Definitions page, click ClusterLogging.
c. On the Custom Resource Definition Overview page, select View Instances from the Actions menu.
d. On the Cluster Loggings page, click Create Cluster Logging. You might have to refresh the page to load the data.
e. In the YAML field, replace the code with the following:
NOTE
This default cluster logging configuration should support a wide array of environments. Review the topics on tuning and configuring the cluster logging components for information on modifications you can make to your cluster logging cluster.
The name must be instance. apiVersion: "logging.openshift.io/v1" kind: "ClusterLogging" metadata: name: "instance" 1 namespace: "openshift-logging" spec: managementState: "Managed" 2 logStore: type: "elasticsearch" 3 elasticsearch: nodeCount: 3 4 storage: storageClassName: "<storage-class-name>" 5 size: 200G redundancyPolicy: "SingleRedundancy" visualization: type: "kibana" 6 kibana: replicas: 1 curation: type: "curator" 7 curator: schedule: "30 3 * * *" collection: logs: type: "fluentd" 8 fluentd: {}
2 3 4 5 6 7 8
The cluster logging management state. In most cases, if you change the cluster logging defaults, you must set this to Unmanaged. However, an unmanaged deployment does Settings for configuring Elasticsearch. Using the CR, you can configure shard
replication policy and persistent storage. For more information, see Configuring Elasticsearch.
Specify the number of Elasticsearch nodes. See the note that follows this list. Enter the name of an existing StorageClass for Elasticsearch storage. For best performance, specify a StorageClass that allocates block storage.
Settings for configuring Kibana. Using the CR, you can scale Kibana for redundancy and configure the CPU and memory for your Kibana nodes. For more information, see Configuring Kibana.
Settings for configuring Curator. Using the CR, you can set the Curator schedule. For more information, see Configuring Curator.
Settings for configuring Fluentd. Using the CR, you can configure Fluentd CPU and memory limits. For more information, see Configuring Fluentd.
NOTE
The maximum number of Elasticsearch master nodes is three. If you specify a nodeCount greater than 3, OpenShift Container Platform creates three Elasticsearch nodes that are Master-eligible nodes, with the master, client, and data roles. The additional Elasticsearch nodes are created as Data-only nodes, using client and data roles. Master nodes perform cluster-wide actions such as creating or deleting an index, shard allocation, and tracking nodes. Data nodes hold the shards and perform data-related operations such as CRUD, search, and aggregations. Data-related operations are I/O-, memory-, and CPU-intensive. It is important to monitor these resources and to add more Data nodes if the current nodes are overloaded.
For example, if nodeCount=4, the following nodes are created: $ oc get deployment cluster-logging-operator 1/1 1 1 18h elasticsearch-cd-x6kdekli-1 0/1 1 0 6m54s elasticsearch-cdm-x6kdekli-1 1/1 1 1 18h elasticsearch-cdm-x6kdekli-2 0/1 1 0 6m49s elasticsearch-cdm-x6kdekli-3 0/1 1 0 6m44s
The number of primary shards for the index templates is equal to the number of Elasticsearch data nodes.
f. Click Create. This creates the Cluster Logging Custom Resource and Elasticsearch Custom Resource, which you can edit to make changes to your cluster logging cluster.
5. Verify the install:
b. Select the openshift-logging project.
You should see several Pods for cluster logging, Elasticsearch, Fluentd, and Kibana similar to the following list:
cluster-logging-operator-cb795f8dc-xkckc elasticsearch-cdm-b3nqzchd-1-5c6797-67kfz elasticsearch-cdm-b3nqzchd-2-6657f4-wtprv elasticsearch-cdm-b3nqzchd-3-588c65-clg7g fluentd-2c7dg fluentd-9z7kk fluentd-br7r2 fluentd-fn2sb fluentd-pb2f8 fluentd-zqgqx kibana-7fb4fd4cc9-bvt4p
3.3. INSTALL THE CLUSTER LOGGING OPERATOR USING THE CLI
You can use the OpenShift Container Platform CLI to install the Cluster Logging Operator. The Cluster Logging Operator creates and manages the components of the logging stack.
Procedure
To install the Cluster Logging Operator using the CLI:
1. Create a Namespace for the Cluster Logging Operator:
a. Create a Namespace object YAML file (for example, clo-namespace.yaml) for the Cluster Logging Operator:
b. Create the Namespace:
$ oc create -f <file-name>.yaml For example: $ oc create -f clo-namespace.yaml apiVersion: v1 kind: Namespace metadata: name: openshift-logging annotations: openshift.io/node-selector: "" labels: openshift.io/cluster-monitoring: "true"
1 2
1 2 3
2. Install the Cluster Logging Operator by creating the following objects:
a. Create an OperatorGroup object YAML file (for example, clo-og.yaml) for the Cluster Logging Operator:
You must specify the openshift-logging namespace. b. Create the OperatorGroup object:
$ oc create -f <file-name>.yaml For example:
$ oc create -f clo-og.yaml
c. Create a Subscription object YAML file (for example, clo-sub.yaml) to subscribe a Namespace to an Operator.
Example Subscription
You must specify the openshift-logging Namespace. Specify 4.3 as the channel.
Specify redhat-operators. If your OpenShift Container Platform cluster is installed on a restricted network, also known as a disconnected cluster, specify the name of the CatalogSource object you created when you configured the Operator Lifecycle Manager (OLM).
d. Create the Subscription object: $ oc create -f <file-name>.yaml apiVersion: operators.coreos.com/v1 kind: OperatorGroup metadata: name: cluster-logging namespace: openshift-logging 1 spec: targetNamespaces: - openshift-logging 2 apiVersion: operators.coreos.com/v1alpha1 kind: Subscription metadata: name: cluster-logging namespace: openshift-logging 1 spec: channel: "4.3" 2 name: cluster-logging source: redhat-operators 3 sourceNamespace: openshift-marketplace
For example:
$ oc create -f clo-sub.yaml
The Cluster Logging Operator is installed to the openshift-logging Namespace. 3. Verify the Operator installation.
There should be a Cluster Logging Operator in the openshift-logging Namespace. The Version number might be different than shown.
oc get csv --all-namespaces
NAMESPACE NAME DISPLAY VERSION REPLACES PHASE
...
openshift-logging clusterlogging.4.3.1-202002032140 Cluster Logging 4.3.1-202002032140 Succeeded
...
4. Create a Cluster Logging instance:
a. Create an instance object YAML file (for example, clo-instance.yaml) for the Cluster Logging Operator:
NOTE
This default Cluster Logging configuration should support a wide array of environments. Review the topics on tuning and configuring the Cluster Logging components for information on modifications you can make to your Cluster Logging cluster.
apiVersion: "logging.openshift.io/v1" kind: "ClusterLogging" metadata: name: "instance" 1 namespace: "openshift-logging" spec: managementState: "Managed" 2 logStore: type: "elasticsearch" 3 elasticsearch: nodeCount: 3 4 storage: storageClassName: "<storage-class-name>" 5 size: 200G redundancyPolicy: "SingleRedundancy" visualization: type: "kibana" 6 kibana: replicas: 1 curation: type: "curator" 7 curator:
1 2 3 4 5 6 7 8
The name must be instance.
The Cluster Logging management state. In most cases, if you change the Cluster Logging defaults, you must set this to Unmanaged. However, an unmanaged deployment does not receive updates until Cluster Logging is placed back into the Managed state. For more information, see Changing cluster logging management state.
Settings for configuring Elasticsearch. Using the Custom Resource (CR), you can configure shard replication policy and persistent storage. For more information, see Configuring Elasticsearch.
Specify the number of Elasticsearch nodes. See the note that follows this list. Enter the name of an existing StorageClass for Elasticsearch storage. For best performance, specify a StorageClass that allocates block storage.
Settings for configuring Kibana. Using the CR, you can scale Kibana for redundancy and configure the CPU and memory for your Kibana nodes. For more information, see Configuring Kibana.
Settings for configuring Curator. Using the CR, you can set the Curator schedule. For more information, see Configuring Curator.
Settings for configuring Fluentd. Using the CR, you can configure Fluentd CPU and memory limits. For more information, see Configuring Fluentd.
NOTE
schedule: "30 3 * * *" collection: logs: type: "fluentd" 8 fluentd: {}NOTE
The maximum number of Elasticsearch master nodes is three. If you specify a nodeCount greater than 3, OpenShift Container Platform creates three Elasticsearch nodes that are Master-eligible nodes, with the master, client, and data roles. The additional Elasticsearch nodes are created as Data-only nodes, using client and data roles. Master nodes perform cluster-wide actions such as creating or deleting an index, shard allocation, and tracking nodes. Data nodes hold the shards and perform data-related operations such as CRUD, search, and aggregations. Data-related operations are I/O-, memory-, and CPU-intensive. It is important to monitor these resources and to add more Data nodes if the current nodes are overloaded.
For example, if nodeCount=4, the following nodes are created: $ oc get deployment cluster-logging-operator 1/1 1 1 18h elasticsearch-cd-x6kdekli-1 1/1 1 0 6m54s elasticsearch-cdm-x6kdekli-1 1/1 1 1 18h elasticsearch-cdm-x6kdekli-2 1/1 1 0 6m49s elasticsearch-cdm-x6kdekli-3 1/1 1 0 6m44s
The number of primary shards for the index templates is equal to the number of Elasticsearch data nodes.
b. Create the instance:
$ oc create -f <file-name>.yaml For example:
$ oc create -f clo-instance.yaml
5. Verify the install by listing the Pods in the openshift-logging project.
You should see several Pods for Cluster Logging, Elasticsearch, Fluentd, and Kibana similar to the following list:
oc get pods -n openshift-logging
NAME READY STATUS RESTARTS AGE cluster-logging-operator-66f77ffccb-ppzbg 1/1 Running 0 7m elasticsearch-cdm-ftuhduuw-1-ffc4b9566-q6bhp 2/2 Running 0 2m40s elasticsearch-cdm-ftuhduuw-2-7b4994dbfc-rd2gc 2/2 Running 0 2m36s elasticsearch-cdm-ftuhduuw-3-84b5ff7ff8-gqnm2 2/2 Running 0 2m4s fluentd-587vb 1/1 Running 0 2m26s fluentd-7mpb9 1/1 Running 0 2m30s fluentd-flm6j 1/1 Running 0 2m33s fluentd-gn4rn 1/1 Running 0 2m26s fluentd-nlgb6 1/1 Running 0 2m30s fluentd-snpkt 1/1 Running 0 2m28s kibana-d6d5668c5-rppqm 2/2 Running 0 2m39s
3.4. ADDITIONAL RESOURCES
CHAPTER 4. UPDATING CLUSTER LOGGING
After updating the OpenShift Container Platform cluster from 4.2 to 4.3, you must then upgrade cluster logging from 4.2 to 4.3.
4.1. UPDATING CLUSTER LOGGING
After updating the OpenShift Container Platform cluster, you can update cluster logging from 4.2 to 4.3 by updating the subscription for the Elasticsearch Operator and the Cluster Logging Operator.
IMPORTANT
Changes introduced by the new log forward feature modified the support for
out_forward starting with the OpenShift Container Platform 4.3 release. In OpenShift Container Platform 4.3, you create a ConfigMap to configure out_forward. Any updates to the secure-forward.conf section of the Fluentd ConfigMap are removed.
If you use the out_forward plug-in, before updating, you can copy your current secure-forward.conf section from the Fluentd ConfigMap and use the copied data when you create the secure-forward ConfigMap.
Prerequisites
Update the cluster from 4.2 to 4.3.
Make sure the cluster logging status is healthy: All Pods are ready.
Elasticsearch cluster is healthy.
Optionally, copy your current secure-forward.conf section from the Fluentd ConfigMap for use if you want to create the secure-forward ConfigMap. See the note above.
Procedure
1. Update the Elasticsearch Operator:
a. From the web console, click Operators→Installed Operators. b. Select the openshift-logging project.
c. Click the Elasticsearch Operator. d. Click Subscription→Channel.
e. In the Change Subscription Update Channel window, select 4.3 and click Save. f. Wait for a few seconds, then click Operators→Installed Operators.
The Elasticsearch Operator is shown as 4.3. For example: Elasticsearch Operator
4.3.0-201909201915 provided by Red Hat, Inc
2. Update the Cluster Logging Operator:
a. From the web console, click Operators→Installed Operators. b. Select the openshift-logging Project.
c. Click the Cluster Logging Operator. d. Click Subscription→Channel.
e. In the Change Subscription Update Channel window, select 4.3 and click Save. f. Wait for a few seconds, then click Operators→Installed Operators.
The Cluster Logging Operator is shown as 4.3. For example: Cluster Logging
4.3.0-201909201915 provided by Red Hat, Inc
3. Check the logging components:
a. Ensure that the Elasticsearch Pods are using a 4.3 image:
$ oc get pod -o yaml -n openshift-logging --selector component=elasticsearch |grep 'image:' image: registry.redhat.io/openshift4/ose-logging-elasticsearch5:v4.3.0-202001081344 image: registry.redhat.io/openshift4/ose-oauth-proxy:v4.3.0-202001081344 image: registry.redhat.io/openshift4/ose-logging-elasticsearch5:v4.3.0-202001081344 image: registry.redhat.io/openshift4/ose-oauth-proxy:v4.3.0-202001081344 image: registry.redhat.io/openshift4/ose-logging-elasticsearch5:v4.3.0-202001081344 image: registry.redhat.io/openshift4/ose-oauth-proxy:v4.3.0-202001081344 image: registry.redhat.io/openshift4/ose-logging-elasticsearch5:v4.3.0-202001081344 image: registry.redhat.io/openshift4/ose-oauth-proxy:v4.3.0-202001081344 image: registry.redhat.io/openshift4/ose-logging-elasticsearch5:v4.3.0-202001081344 image: registry.redhat.io/openshift4/ose-oauth-proxy:v4.3.0-202001081344 image: registry.redhat.io/openshift4/ose-logging-elasticsearch5:v4.3.0-202001081344 image: registry.redhat.io/openshift4/ose-oauth-proxy:v4.3.0-202001081344
b. Ensure that all Elasticsearch Pods are in the Ready status:
$ oc get pod -n openshift-logging --selector component=elasticsearch NAME READY STATUS RESTARTS AGE elasticsearch-cdm-1pbrl44l-1-55b7546f4c-mshhk 2/2 Running 0 31m elasticsearch-cdm-1pbrl44l-2-5c6d87589f-gx5hk 2/2 Running 0 30m elasticsearch-cdm-1pbrl44l-3-88df5d47-m45jc 2/2 Running 0 29m c. Ensure that the Elasticsearch cluster is healthy:
oc exec -n openshift-logging -c elasticsearch elasticsearch-cdm-1pbrl44l-1-55b7546f4c-mshhk -- es_cluster_health
{
"status" : "green", ....
d. Ensure that the logging collector Pods are using a 4.3 image:
$ oc get pod -n openshift-logging --selector logging-infra=fluentd -o yaml |grep 'image:' image: registry.redhat.io/openshift4/ose-logging-fluentd:v4.3.0-202001081344 image: registry.redhat.io/openshift4/ose-logging-fluentd:v4.3.0-202001081344 image: registry.redhat.io/openshift4/ose-logging-fluentd:v4.3.0-202001081344 image: registry.redhat.io/openshift4/ose-logging-fluentd:v4.3.0-202001081344 image: registry.redhat.io/openshift4/ose-logging-fluentd:v4.3.0-202001081344 image: registry.redhat.io/openshift4/ose-logging-fluentd:v4.3.0-202001081344 image: registry.redhat.io/openshift4/ose-logging-fluentd:v4.3.0-202001081344 image: registry.redhat.io/openshift4/ose-logging-fluentd:v4.3.0-202001081344 image: registry.redhat.io/openshift4/ose-logging-fluentd:v4.3.0-202001081344 image: registry.redhat.io/openshift4/ose-logging-fluentd:v4.3.0-202001081344 image: registry.redhat.io/openshift4/ose-logging-fluentd:v4.3.0-202001081344 image: registry.redhat.io/openshift4/ose-logging-fluentd:v4.3.0-202001081344 e. Ensure that the Kibana Pods are using a 4.3 image:
$ oc get pod -n openshift-logging --selector logging-infra=kibana -o yaml |grep 'image:' image: registry.redhat.io/openshift4/ose-logging-kibana5:v4.3.0-202001081344 image: registry.redhat.io/openshift4/ose-oauth-proxy:v4.3.0-202001081344 image: registry.redhat.io/openshift4/ose-logging-kibana5:v4.3.0-202001081344 image: registry.redhat.io/openshift4/ose-oauth-proxy:v4.3.0-202001081344 f. Ensure that the Curator CronJob is using a 4.3 image:
$ $ oc get CronJob curator -n openshift-logging -o yaml |grep 'image:'
image: registry.redhat.io/openshift4/ose-logging-curator5:v4.3.0-202001081344
1
CHAPTER 5. VIEWING CLUSTER LOGS
You can view OpenShift Container Platform cluster logs in the CLI or OpenShift Container Platform web console.
5.1. VIEWING CLUSTER LOGS
You can view cluster logs in the CLI. Prerequisites
Cluster logging and Elasticsearch must be installed.
Procedure
To view cluster logs:
Use the oc logs [-f] <pod_name> command, where the -f is optional. $ oc logs -f <any-fluentd-pod> -n openshift-logging 1
Specify the name of a log collector pod. Use the -f option to follow what is being written into the logs.
For example
$ oc logs -f fluentd-ht42r -n openshift-logging The contents of log files are printed out.
By default, Fluentd reads logs from the tail, or end, of the log.
5.2. VIEWING CLUSTER LOGS IN THE OPENSHIFT CONTAINER
PLATFORM WEB CONSOLE
You can view cluster logs in the OpenShift Container Platform web console . Prerequisites
Cluster logging and Elasticsearch must be installed.
Procedure
To view cluster logs:
1. In the OpenShift Container Platform console, navigate to Workloads→Pods. 2. Select the openshift-logging project from the drop-down menu.
3. Click one of the logging collector pods with the fluentd prefix. 4. Click Logs.
By default, Fluentd reads logs from the tail, or end, of the log.
1
CHAPTER 6. VIEWING CLUSTER LOGS USING KIBANA
The cluster logging installation deploys the Kibana web console.
6.1. LAUNCHING KIBANA
Kibana is a browser-based console to query, discover, and visualize your logs through histograms, line graphs, pie charts, heat maps, built-in geospatial support, and other visualizations.
Prerequisites
If you installed OpenShift Container Platform with a proxy, you need to add .apps.<cluster_name>. <base_domain> to the noProxy list in your cluster-wide Proxy object.
For example: $ oc edit proxy/cluster apiVersion: config.openshift.io/v1 kind: Proxy metadata: creationTimestamp: "2020-03-30T00:45:44Z" generation: 3 name: cluster resourceVersion: "26654" selfLink: /apis/config.openshift.io/v1/proxies/cluster uid: 2213b41b-0721-4c9f-9586-0678c0058f85 spec: httpProxy: http://proxy.com httpsProxy: https://proxy.com noProxy: .apps.mycluster.example.com 1 trustedCA: name: user-ca-bundle
Add .apps.<cluster_name>.<base_domain> to the noProxy list. This is a comma-separated list of destination domain names, domains, IP addresses, or other network CIDRs to exclude proxying.
Procedure
To launch Kibana:
1. In the OpenShift Container Platform console, click Monitoring→Logging.
2. Log in using the same credentials you use to log in to the OpenShift Container Platform console.
The Kibana interface launches. You can now:
Search and browse your data using the Discover page. Chart and map your data using the Visualize page.
Create and view custom dashboards using the Dashboard page.
Use and configuration of the Kibana interface is beyond the scope of this documentation. For more information, on using the interface, see the Kibana documentation.
NOTE
If you get a security_exception error in the Kibana console and cannot access your Kibana indices, you might have an expired OAuth token. If you see this error, log out of the Kibana console, and then log back in. This refreshes your OAuth tokens and you should be able to access your indices.
CHAPTER 7. CONFIGURING YOUR CLUSTER LOGGING
DEPLOYMENT
7.1. ABOUT CONFIGURING CLUSTER LOGGING
After installing cluster logging into your OpenShift Container Platform cluster, you can make the following configurations.
NOTE
You must set cluster logging to Unmanaged state before performing these
configurations, unless otherwise noted. For more information, see Changing the cluster logging management state.
Operators in an unmanaged state are unsupported and the cluster administrator assumes full control of the individual component configurations and upgrades.
For more information, see Support policy for unmanaged Operators.
7.1.1. About deploying and configuring cluster logging
OpenShift Container Platform cluster logging is designed to be used with the default configuration, which is tuned for small to medium sized OpenShift Container Platform clusters.
The installation instructions that follow include a sample Cluster Logging Custom Resource (CR), which you can use to create a cluster logging instance and configure your cluster logging deployment.
If you want to use the default cluster logging install, you can use the sample CR directly.
If you want to customize your deployment, make changes to the sample CR as needed. The following describes the configurations you can make when installing your cluster logging instance or modify after installation. See the Configuring sections for more information on working with each component, including modifications you can make outside of the Cluster Logging Custom Resource.
7.1.1.1. Configuring and Tuning Cluster Logging
You can configure your cluster logging environment by modifying the Cluster Logging Custom Resource deployed in the openshift-logging project.
You can modify any of the following components upon install or after install: Memory and CPU
You can adjust both the CPU and memory limits for each component by modifying the resources block with valid memory and CPU values:
spec: logStore: elasticsearch: resources: limits: cpu: memory: 16Gi requests:
cpu: 500m memory: 16Gi type: "elasticsearch" collection: logs: fluentd: resources: limits: cpu: memory: requests: cpu: memory: type: "fluentd" visualization: kibana: resources: limits: cpu: memory: requests: cpu: memory: type: kibana curation: curator: resources: limits: memory: 200Mi requests: cpu: 200m memory: 200Mi type: "curator" Elasticsearch storage
You can configure a persistent storage class and size for the Elasticsearch cluster using the storageClassname and size parameters. The Cluster Logging Operator creates a
PersistentVolumeClaim for each data node in the Elasticsearch cluster based on these parameters. spec: logStore: type: "elasticsearch" elasticsearch: nodeCount: 3 storage: storageClassName: "gp2" size: "200G"
This example specifies each data node in the cluster will be bound to a PersistentVolumeClaim that requests "200G" of "gp2" storage. Each primary shard will be backed by a single replica.
NOTE
NOTE
Omitting the storage block results in a deployment that includes ephemeral storage only. spec: logStore: type: "elasticsearch" elasticsearch: nodeCount: 3 storage: {}
Elasticsearch replication policy
You can set the policy that defines how Elasticsearch shards are replicated across data nodes in the cluster:
FullRedundancy. The shards for each index are fully replicated to every data node. MultipleRedundancy. The shards for each index are spread over half of the data nodes. SingleRedundancy. A single copy of each shard. Logs are always available and recoverable as long as at least two data nodes exist.
ZeroRedundancy. No copies of any shards. Logs may be unavailable (or lost) in the event a node is down or fails.
Curator schedule
You specify the schedule for Curator in the cron format. spec: curation: type: "curator" resources: curator: schedule: "30 3 * * *"
7.1.1.2. Sample modified Cluster Logging Custom Resource
The following is an example of a Cluster Logging Custom Resource modified using the options previously described.
Sample modified Cluster Logging Custom Resource
apiVersion: "logging.openshift.io/v1" kind: "ClusterLogging" metadata: name: "instance" namespace: "openshift-logging" spec: managementState: "Managed" logStore: type: "elasticsearch" elasticsearch: nodeCount: 3resources: limits: memory: 32Gi requests: cpu: 3 memory: 32Gi storage: {} redundancyPolicy: "SingleRedundancy" visualization: type: "kibana" kibana: resources: limits: memory: 1Gi requests: cpu: 500m memory: 1Gi replicas: 1 curation: type: "curator" curator: resources: limits: memory: 200Mi requests: cpu: 200m memory: 200Mi schedule: "*/5 * * * *" collection: logs: type: "fluentd" fluentd: resources: limits: memory: 1Gi requests: cpu: 200m memory: 1Gi
7.2. CHANGING CLUSTER LOGGING MANAGEMENT STATE
In order to modify certain components managed by the Cluster Logging Operator or the Elasticsearch Operator, you must set the operator to the unmanaged state.
In unmanaged state, the operators do not respond to changes in the CRs. The administrator assumes full control of individual component configurations and upgrades when in unmanaged state.
IMPORTANT
Operators in an unmanaged state are unsupported and the cluster administrator assumes full control of the individual component configurations and upgrades.
For more information, see Support policy for unmanaged Operators.
In managed state, the Cluster Logging Operator (CLO) responds to changes in the Cluster Logging CHAPTER 7. CONFIGURING YOUR CLUSTER LOGGING DEPLOYMENT
In managed state, the Cluster Logging Operator (CLO) responds to changes in the Cluster Logging Custom Resource (CR) and adjusts the logging deployment accordingly.
The OpenShift Container Platform documentation indicates in a prerequisite step when you must set the OpenShift Container Platform cluster to Unmanaged.
NOTE
If you set the Elasticsearch Operator (EO) to unmanaged and leave the Cluster Logging Operator (CLO) as managed, the CLO will revert changes you make to the EO, as the EO is managed by the CLO.
7.2.1. Changing the cluster logging management state
You must set the operator to the unmanaged state in order to modify the components managed by the Cluster Logging Operator:
the Curator CronJob, the Elasticsearch CR, the Kibana Deployment, the log collector DaemonSet.
If you make changes to these components in managed state, the Cluster Logging Operator reverts those changes.
NOTE
An unmanaged cluster logging environment does not receive updates until you return the Cluster Logging Operator to Managed state.
Prerequisites
The Cluster Logging Operator must be installed. Procedure
1. Edit the Cluster Logging Custom Resource (CR) in the openshift-logging project: $ oc edit ClusterLogging instance
$ oc edit ClusterLogging instance apiVersion: "logging.openshift.io/v1" kind: "ClusterLogging" metadata: name: "instance" .... spec: managementState: "Managed" 1
1
1
Specify the management state as Managed or Unmanaged.
7.2.2. Changing the Elasticsearch management state
You must set the operator to the unmanaged state in order to modify the Elasticsearch deployment files, which are managed by the Elasticsearch Operator.
If you make changes to these components in managed state, the Elasticsearch Operator reverts those changes.
NOTE
An unmanaged Elasticsearch cluster does not receive updates until you return the Elasticsearch Operator to Managed state.
Prerequisite
The Elasticsearch Operator must be installed.
Have the name of the Elasticsearch CR, in the openshift-logging project: $ oc get -n openshift-logging Elasticsearch
NAME AGE elasticsearch 28h
Procedure
Edit the Elasticsearch Custom Resource (CR) in the openshift-logging project:
Specify the management state as Managed or Unmanaged.
NOTE
If you set the Elasticsearch Operator (EO) to unmanaged and leave the Cluster Logging Operator (CLO) as managed, the CLO will revert changes you make to the EO, as the EO is managed by the CLO.
7.3. CONFIGURING CLUSTER LOGGING
$ oc edit Elasticsearch elasticsearchapiVersion: logging.openshift.io/v1 kind: Elasticsearch metadata: name: elasticsearch .... spec: managementState: "Managed" 1
Cluster logging is configurable using a Cluster Logging Custom Resource (CR) deployed in the openshift-logging project.
The Cluster Logging Operator watches for changes to Cluster Logging CRs, creates any missing logging components, and adjusts the logging deployment accordingly.
The Cluster Logging CR is based on the Cluster Logging Custom Resource Definition (CRD), which defines a complete cluster logging deployment and includes all the components of the logging stack to collect, store and visualize logs.
Sample Cluster Logging Custom Resource (CR)
You can configure the following for cluster logging:
You can place cluster logging into an unmanaged state that allows an administrator to assume full control of individual component configurations and upgrades.
apiVersion: logging.openshift.io/v1 kind: ClusterLogging metadata: creationTimestamp: '2019-03-20T18:07:02Z' generation: 1 name: instance namespace: openshift-logging spec: collection: logs: fluentd: resources: null type: fluentd curation: curator: resources: null schedule: 30 3 * * * type: curator logStore: elasticsearch: nodeCount: 3 redundancyPolicy: SingleRedundancy resources: limits: cpu: memory: requests: cpu: memory: storage: {} type: elasticsearch managementState: Managed visualization: kibana: proxy: resources: null replicas: 1 resources: null type: kibana
1 2 3 4 5
You can overwrite the image for each cluster logging component by modifying the appropriate environment variable in the cluster-logging-operator Deployment.
You can specify specific nodes for the logging components using node selectors.
7.3.1. Understanding the cluster logging component images
There are several components in cluster logging, each one implemented with one or more images. Each image is specified by an environment variable defined in the cluster-logging-operator deployment in the openshift-logging project and should not be changed.
You can view the images by running the following command:
$ oc -n openshift-logging set env deployment/cluster-logging-operator --list | grep _IMAGE
ELASTICSEARCH_IMAGE=registry.redhat.io/openshift4/ose-logging-elasticsearch5:v4.3 1 FLUENTD_IMAGE=registry.redhat.io/openshift4/ose-logging-fluentd:v4.3 2
KIBANA_IMAGE=registry.redhat.io/openshift4/ose-logging-kibana5:v4.3 3 CURATOR_IMAGE=registry.redhat.io/openshift4/ose-logging-curator5:v4.3 4 OAUTH_PROXY_IMAGE=registry.redhat.io/openshift4/ose-oauth-proxy:v4.3 5
ELASTICSEARCH_IMAGE deploys Elasticsearch. FLUENTD_IMAGE deploys Fluentd.
KIBANA_IMAGE deploys Kibana. CURATOR_IMAGE deploys Curator.
OAUTH_PROXY_IMAGE defines OAUTH for OpenShift Container Platform. The values might be different depending on your environment.
IMPORTANT
The logging routes are managed by the Cluster Logging Operator and cannot be modified by the user.
7.4. CONFIGURING ELASTICSEARCH TO STORE AND ORGANIZE LOG
DATA
OpenShift Container Platform uses Elasticsearch (ES) to store and organize the log data. Some of the modifications you can make to your log store include:
storage for your Elasticsearch cluster;
how shards are replicated across data nodes in the cluster, from full replication to no replication; allowing external access to Elasticsearch data.
NOTE
NOTE
Scaling down Elasticsearch nodes is not supported. When scaling down, Elasticsearch pods can be accidentally deleted, possibly resulting in shards not being allocated and replica shards being lost.
Elasticsearch is a memory-intensive application. Each Elasticsearch node needs 16G of memory for both memory requests and limits, unless you specify otherwise in the Cluster Logging Custom Resource. The initial set of OpenShift Container Platform nodes might not be large enough to support the
Elasticsearch cluster. You must add additional nodes to the OpenShift Container Platform cluster to run with the recommended or higher memory.
Each Elasticsearch node can operate with a lower memory setting though this is not recommended for production deployments.
NOTE
If you set the Elasticsearch Operator (EO) to unmanaged and leave the Cluster Logging Operator (CLO) as managed, the CLO will revert changes you make to the EO, as the EO is managed by the CLO.
7.4.1. Configuring Elasticsearch CPU and memory limits
Each component specification allows for adjustments to both the CPU and memory limits. You should not have to manually adjust these values as the Elasticsearch Operator sets values sufficient for your environment.
Each Elasticsearch node can operate with a lower memory setting though this is not recommended for production deployments. For production use, you should have no less than the default 16Gi allocated to each Pod. Preferably you should allocate as much as possible, up to 64Gi per Pod.
Prerequisites
Cluster logging and Elasticsearch must be installed. Procedure
1. Edit the Cluster Logging Custom Resource (CR) in the openshift-logging project: $ oc edit ClusterLogging instance
apiVersion: "logging.openshift.io/v1" kind: "ClusterLogging" metadata: name: "instance" .... spec: logStore: type: "elasticsearch" elasticsearch: resources: 1 limits: memory: 16Gi
1 Specify the CPU and memory limits as needed. If you leave these values blank, the
Elasticsearch Operator sets default values that should be sufficient for most deployments. If you adjust the amount of Elasticsearch CPU and memory, you must change both the request value and the limit value.
For example:
Kubernetes generally adheres the node CPU configuration and DOES not allow Elasticsearch to use the specified limits. Setting the same value for the requests and limits ensures that
Elasticseach can use the CPU and memory you want, assuming the node has the CPU and memory available.
7.4.2. Configuring Elasticsearch replication policy
You can define how Elasticsearch shards are replicated across data nodes in the cluster. Prerequisites
Cluster logging and Elasticsearch must be installed. Procedure
1. Edit the Cluster Logging Custom Resource (CR) in the openshift-logging project: oc edit clusterlogging instance
Specify a redundancy policy for the shards. The change is applied upon saving the requests: cpu: 500m memory: 16Gi resources: limits: cpu: "8" memory: "32Gi" requests: cpu: "8" memory: "32Gi" apiVersion: "logging.openshift.io/v1" kind: "ClusterLogging" metadata: name: "instance" .... spec: logStore: type: "elasticsearch" elasticsearch: redundancyPolicy: "SingleRedundancy" 1