150
COMPLEMENTARY OBJECTIVE AND SUBJECTIVE MEASURES OF
HOSPITAL SERVICES QUALITY
CYPRIAN KOZYRA, BEATA ZMYŚLONA
Wroclaw University of Economics, Faculty of Management, Information Systems and Finance, Department of Statistics,
Komandorska Str. 118/120, 53-345 Wroclaw, Poland email: [email protected], [email protected]
KATARZYNA MADZIARSKA
Wroclaw Medical University, Faculty of Postgraduate Medical Training, Department of Nephrology and Transplantation Medicine,
Borowska Str. 213, 50-556 Wroclaw, Poland email: [email protected]
Abstract
The paper presents the results of a survey carried out among a representative sample of hospital patients in Lower Silesia voivodeship. The sample size was 800 people who described the subjective quality of hospital services in a special questionnaire. The questionnaire was developed in a two-stage process. First, chronically ill diabetes patients answered a greater number of questions and psychometric properties were examined. Next, a modified, shorter version of the questionnaire was used in the final survey. Psychometric properties were mostly confirmed in the analysis. The aim of this paper is to present the results of hospital evaluation by patients compared to objective measures of hospital quality based on patient’s hospital visit records.
Key words: hospital services, quality measures, objective quality, subjective quality.
DOI: 10.15611/amse.2014.17.16
1. Introduction
Quality of hospital services can be measured by means of different tools. A questionnaire is the most popular tool to measure the subjective quality evaluated by patients. Data were collected during the survey on a representative sample of Lower Silesia voivodeship (the main unit in Polish administrative division system). The questionnaire was earlier developed using data from a smaller sample of diabetes patients. Because they are chronically ill, they are more often hospital inpatients than the rest of the population. Objective measures were developed using the average stay of chronically ill diabetic patients in hospitals. Data concerning the stay in hospitals were taken from Lower Silesia Branch of National Health Fund (Polish public health insurer) databases. The statistical analysis was made by means of Statistica, Excel and Access software.
The aim of this paper is to compare subjective and objective measures of hospital services quality. A strong correlation between them confirms existence of common component in subjective and objective measurement of quality, the lack of correlation would mean a discrepancy between them.
151
2. Subjective quality measures development
The quality of health care services is a multidimensional construct. Therefore different methods of measurement should be used. Øvretveit (1988, pp. 229-257) identified three main aspects of health service quality: patients’ subjective quality, which should be measured using questionnaires, technical quality (effectiveness of treatment), which should be measured by means of objective, clinical data, and managerial quality (economic efficiency), which should be measured by financial indicators. Donabedian (1988) divided quality delivered by health care institutions into three parts: quality of structure, quality of process, and quality of outcome, but each of these parts could be assessed both objectively and subjectively. A comparison between different measurements of health care quality was not widely conducted, but many similar studies of subjective and objective measurements of quality of life (e.g. Ruggeri, 2001) show the lack of a strong correlation and the discrepancy between them.
The growth of subjective quality measurement was based on perceiving patients as consumers of health services (Davies, Ware, 1988), therefore marketing measures were employed in health care industry. Some researchers applied universal service quality measurement scales, e.g. SERVQUAL developed by Parasuraman, Zeithaml and Berry (1988) to health care (Babakus, Mangold, 1992), others developed measures specific for health services (Sower et al., 2001). Attempts to construct standard scales of subjective quality (e.g. Patient Satisfaction Questionnaire from RAND Health, n.d.) are not yet well established, because of many versions used in different countries. Global health surveys deal with patients’ satisfaction in a rather macro-scale, i.e. satisfaction of country-wide health care system, not a selected hospital. In this study, questions concerning subjective quality of different aspects of hospital services were mostly taken from previous surveys, especially conducted in Poland (Miller et al., 2008, Szyszkowska, n.d.). Then classic methods (DeVellis, 2011), i.e. factor analysis and reliability analysis with Cronbach alfa coefficient, were applied to achieve good psychometric properties of the developed measurement scale.
The first step in the questionnaire development was a survey of chronically ill diabetes patients treated as pilot study. The sample size was 73 people of different age. They answered a greater number of prepared questions and psychometric properties were examined. Factor analysis and reliability analysis gave seven distinctive dimensions of subjective quality, which could be reliably measured. Next, a questionnaire modified in this way was used in the final survey for a representative sample for Lower Silesia households of size equal to 800 respondents, which were randomly selected in two-stage sampling. The first-stage sampling units were census districts stratified by classes of localities and the second stage sampling units were dwellings. Only one person from the dwelling could be included to the sample. Respondents were patients in hospital because of illness between years 2006 and 2013. Most of respondents were chronically ill patients (59%) and also for most of them (78%) a chronic disease was the main reason for a visit in hospital. The average age of respondents was 56.6, and the female sex was dominating in the sample (67%).
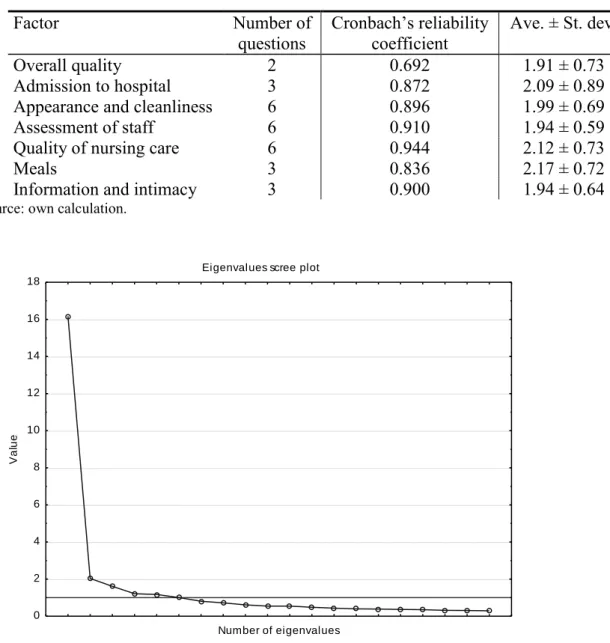
Results of the survey were quite different than in pilot study. Average answers were lower (which means better subjective quality), variability among responses was also lower, and correlation between items greater. Initial number of dimensions was not confirmed (Figure 1), but conducting factor analysis with the same fixed number of factors gives a very similar structure of factor loadings. Goodness of fit indices in a confirmatory factor analysis were relatively high (Joreskog GFI equal to 0.8, AGFI equal to 0.7), but too low for confirming factor structure. Finally, initial dimensions were taken, because of high reliability of
152
measurement (Table 1), but bearing in mind that some of them should be joined into one factor. Lower value of an average means better response categories of subjective quality and the higher value of an average means – worse quality. Therefore, the best evaluated was overall quality, and the worst – meals.
Table 1. Reliability and descriptive analysis of quality dimension
Factor Number of questions Cronbach’s reliability coefficient Ave. ± St. dev. Overall quality 2 0.692 1.91 ± 0.73 Admission to hospital 3 0.872 2.09 ± 0.89
Appearance and cleanliness 6 0.896 1.99 ± 0.69
Assessment of staff 6 0.910 1.94 ± 0.59
Quality of nursing care 6 0.944 2.12 ± 0.73
Meals 3 0.836 2.17 ± 0.72
Information and intimacy 3 0.900 1.94 ± 0.64
Source: own calculation.
Eigenvalues scree plot
Number of eigenvalues 0 2 4 6 8 10 12 14 16 18 V a lu e
Figure 1. Eigenvalues scree plot of subjective quality measurement data
Source: own calculations.
3. Objective quality measures development
Objective data taken from National Health Fund database are not clinical, but administrative. Data concern visits in all public (in the sense of financing by agreement with
153
National Health Fund) hospitals in Lower Silesia region between January 2006 and June 2011. An average stay in hospital was taken as a measure of quality, because improvement of health care services in time is leading to a decrease in the average stay in hospital (Figure 2), although there are differences between countries.
Figure 2. Average length of stay in acute care hospitals – trend 1998-2008
Source: Hospitals in Europe: Healthcare Data (2011, p. 21).
Table 2. Statistical parameters of diabetic patients hospital stay time for public hospitals in Lower Silesia region
Half year 2006 I-VI 2011 I-VI
Average 7.58 6.45
Standard deviation 5.21 5.01
Minimum 4.21 2.63
Maximum 11.75 9.47
Source: own calculation.
In our study, an average stay in hospital was calculated not from all available data because hospitals are very different. The group of diabetes patients was selected by means of ICD-10 disease codes in two half-years: 2006 January-June (9130 patients), and 2011 January-June (9589 patients), but with the very different main diseases during the hospital visit. Diabetic patients are a relatively large part of population (estimated for Poland as ca. 9%), but are not a very homogenous group. They can have different complications of their chronic disease, but most of them are common for this group. Therefore, an average stay in hospital for this group could be the base to hospitals’ comparison. The average time was calculated for each hospital
154
except for the long-term care beds in hospitals – for our study long-term care was defined as above 30 days. Parameters of diabetic patients average hospital stay for all public hospitals in Lower Silesia are given in Table 2.
4. Objective and subjective quality comparison
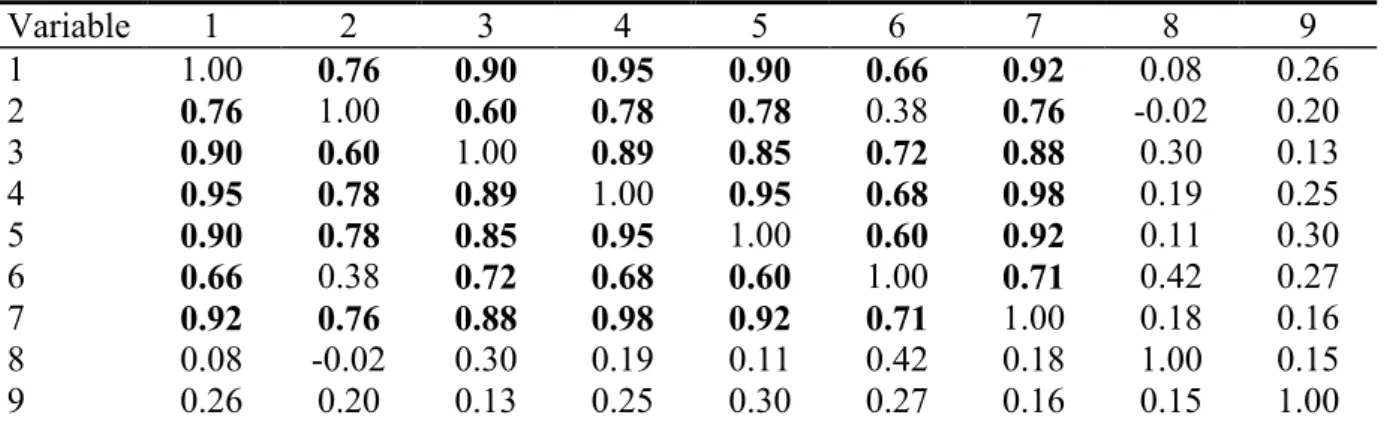
To avoid including hospitals with a small number of surveyed patients only hospitals with at least ca. 20 observations were included in the analysis. Only 14 hospitals were evaluated by 19 or more patients, so in this sample objective and subjective measures were compared. Spearman rank correlations coefficients (Table 3) were calculated to analyze the relationship between objective and subjective measures of quality. One can observe in Table 3 that there is no significant correlation between any subjective (first seven columns) and any objective (two last columns) measures of hospital services quality. An average stay in hospital as characteristics of hospital quality was not significantly correlated with perceptions of patients in the sample. It could be the effect of the small sample size, because almost all coefficients are positive, which means that a shorter average stay is related to better evaluation of quality, but this dependency is not very strong. Contrary to that, we observe a very strong positive correlation between almost all aspects of subjective quality, so it could be the evidence of meta-factor indicating the general attitude of patients towards an evaluated hospital.
Table 3. Spearman rank correlation matrix between subjective and objective measures of hospital services quality
Variable 1 2 3 4 5 6 7 8 9 1 1.00 0.76 0.90 0.95 0.90 0.66 0.92 0.08 0.26 2 0.76 1.00 0.60 0.78 0.78 0.38 0.76 -0.02 0.20 3 0.90 0.60 1.00 0.89 0.85 0.72 0.88 0.30 0.13 4 0.95 0.78 0.89 1.00 0.95 0.68 0.98 0.19 0.25 5 0.90 0.78 0.85 0.95 1.00 0.60 0.92 0.11 0.30 6 0.66 0.38 0.72 0.68 0.60 1.00 0.71 0.42 0.27 7 0.92 0.76 0.88 0.98 0.92 0.71 1.00 0.18 0.16 8 0.08 -0.02 0.30 0.19 0.11 0.42 0.18 1.00 0.15 9 0.26 0.20 0.13 0.25 0.30 0.27 0.16 0.15 1.00
Variables: 1 – Overall quality, 2 – Admission to hospital, 3 – Appearance and cleanliness, 4 – Assessment of staff, 5 – Quality of nursing care, 6 – Meals, 7 – Information and intimacy, 8 – ave. stay in 2006 I-VI, 9 – ave. stay in 2011 I-VI. Bold font means significant rank correlation on significance level equal to 0.05.
Source: own calculation.
5. Conclusion
The above analysis showed the lack of a strong correlation between objective and subjective measures. One interpretation of this result is that patients do not perceive directly, which is an issue of objective measurement. Another conclusion could be that objective and subjective aspects are very different, but both should be improved to minimize social costs of the lack of quality. Findings of this study are similar to studies of subjective and objective measurements of the quality of life (e.g. Ruggeri, 2001). This study has some limitations and some additional detailed analysis is necessary. Other kinds of diseases (not necessarily
155
chronic, but with high prevalence) could be taken for average stay measurement. Another objective measure of the effectiveness of treatment could be repeatability of hospital visits of patients with similar diseases. Some additional variables (e.g. geographic and socio-demographic) could be taken into consideration of different aspects of quality of services delivered by hospitals.
Acknowledgements
The research project “THE METHODOLOGY OF DEVELOPING SYSTEM OF QUALITY MEASURES OF MEDICAL SERVICES DELIVERED BY HOSPITALS” was financially supported by National Science Centre, Poland, on the basis of the decision number DEC-2011/01/B/HS4/05924.
References
1. BABAKUS, E., MANGOLD, W.G. 1992. Adapting the SERVQUAL Scale to Hospital Services: An Empirical Investigation. In Health Services Research, February 1992, vol. 26, iss. 6, pp. 767-785.
2. DAVIES, A.R., WARE, J.E. Jr. 1988. Involving Consumers in Quality of Care Assessment. In Health Affairs, 1988, vol. 7, iss. 1, pp. 33-48.
3. DEVELLIS, R.F. 2011. Scale Development. Theory and Application. Newbury Park: SAGE. 2011. ISBN 978-1412980449.
4. DONABEDIAN A. 1988. The Quality of Care: How Can It Be Assessed?. In Journal of American Medical Association, September 1988, Vol. 260, No. 12, pp. 1743-1748. 5. Hospitals in Europe: Healthcare Data. 2011. HOPE Publications, June 2011. [access.
29-08-2013] http://www.hope.be/03activities/quality_eu-hospitals/eu_country_profiles/00-hospitals_in_europe-synthesis_vs2011-06.pdf
6. MILLER, M. et al. 2008. Ocena jakości usług medycznych przez pacjentów szpitali [transl. from Polish: Medical services quality evaluation by hospital patients], Przegląd Epidemiologiczny, 2008, vol. 62, pp. 643 – 650.
7. ØVRETVEIT J., 1998. Evaluating Health Interventions. Buckingham: Open University Press. 1998. ISBN 978-0335199648.
8. PARASURAMAN, A., ZEITHAML, V.A., BERRY, L.L. 1988. SERVQUAL: a
Multiple-item Scale for Measuring Consumer Perceptions of Service Quality. In Journal of Retailing, 1988, vol. 64, iss. 1, pp. 12-40.
9. Patient Satisfaction Questionnaire from RAND Health. no date. [access. 02-04-2013] http://www.rand.org/health/surveys_tools/psq.html
10.RUGGERI, M. et al. 2001. Subjective and objective dimensions of quality of life of psychiatric patients: a factor analytical approach. In British Journal of Psychiatry, 2001, vol. 178, pp. 268-275.
11.SOWER, V. et al. 2001. The Dimensions of Service Quality for Hospitals: Development and Use of KQCAH Scale, In Health Care Management Review, Spring 2001, vol. 26, iss. 2, pp. 47-59.
12.SZYSZKOWSKA, J. no date. Ocena jakości usług medycznych - badanie satysfakcji pacjentów z pobytu w szpitalu [transl. from Polish: Medical services quality evaluation – investigation of patient satisfaction of stay in the hospital], [access. 14-07-2012]