Is Cross-Listing a Commitment Mechanism?
Evidence from Cross-Listings around the World
Preliminary and incomplete. Please do not cite without permission
Jaiho Chung
Korea University Business School Seoul KOREA 136-701
Tel: +82-2-3290-2826 Fax: +82-2-3290-1307 Email: jhochung@korea.ac.kr
Hyejin Cho
Korea University Business School Seoul KOREA 136-701
Tel: +82-2-3290-2826 Fax: +82-2-3290-1307 Email: hyejinstory@korea.ac.kr
Woojin Kim
Korea University Business School Seoul KOREA 136-701
Tel: +82-2-3290-2834 Fax: +82-2-3290-1307 Email: woojinkim@korea.ac.kr
Is Cross-Listing a Commitment Mechanism?
Evidence from Cross-Listings around the World
Abstract
This paper examines the firms’ foreign listing location decision, using cross-listings data from 28 origin countries to 9 destinations during 1994-2008, Our main finding is that firms are more likely to choose cross-listing destinations that are less strict on regulating self-dealing or exhibit higher block premiums relative to the origin country, and this tendency is more pronounced after Sarbanes-Oxley in 2002. Moreover, firm characteristics that are positively correlated with likelihood of a US cross-listing, such as high tech or high Tobin’s q, are also positively correlated with likelihood of cross-listings in Germany or Switzerland both of which exhibit low investor protection. These findings are in contrast to the widely accepted “bonding” hypothesis that firms choose to cross-list to voluntarily commit themselves to higher disclosure standards.
Keywords: cross-listing; private benefits; commitment; investor protection; bonding hypothesis; alternative-specific logit model
INTRODUCTION
Cross-listing is one of the most extensively studied areas in international finance. It is a subject of interest not only for academics but also for practitioners in the midst of a heated controversy over tightened regulatory environment in New York following Sarbanes-Oxley in 2002 that allegedly have made London more attractive as a cross-listing destination. While lowering cost of capital is often cited in the traditional literature as the primary motivation for a firm to cross-list and take advantage of the increasingly integrated and globalized world financial market, subsequent literature has identified many other important factors influencing a firm’s cross-listing decision (for example Pagano, Roell, and Zechner, 2002),1.
A widely accepted view among corporate finance scholars is that firms cross-list to voluntarily subject themselves to more stringent disclosure or regulatory standards to credibly commit that they would not engage in (or at least reduce the current level of) extraction of various forms of private benefits of control using corporate resources. This view is often referred to as the ‘bonding’ hypothesis. (Coffee (1999), Stulz (1999), Reese and Weisbach (2002), Doidge (2004), Doidge, Karolyi, and Stulz (2004) among many others.). A recent study by Doidge, Karolyi, Lins, Miller, and Stulz (2009) find that when controlling shareholders enjoy high levels of control, their firms are less likely to be listed on a US exchange for fear of exposing themselves to a tighter monitoring by regulatory authorities or outside investors, consistent with the ‘bonding’ hypothesis. A common
1 Factors that could potentially affect cross-listings noted by Pagano et al. (2002) are; raising capital for investment, stock sales by existing shareholders, broadening shareholder base, foreign expertise, commitment to disclosure and governance standards, liquidity, relative mispricing, capitalizing on product market
characteristic of the aforementioned studies is that US market is implicitly assumed as the only available cross-listing destination that firms are able to choose from.
However, US is clearly not the only possible destination when firms decide to cross-list for one reason or another. First, as mentioned earlier, practitioners often argue that London, which has served as the world’s financial center before the rise of New York, may have regained its attractiveness ever since Sarbanes-Oxley in 2002.2 Second, according to World Federation of Exchanges, foreign firms listed in US as of 2008 only account for 27% of all foreign listings in 9 major markets.3 Third, many stock exchanges other than those in US also attract substantial amount of foreign firms’ listings. In fact, US ranks only 5th place among 9 major destination countries in terms of percentage of foreign firms listed in a given market. For example, the average percentage of foreign firms listed on Luxembourg stock exchange, which is known for its relatively weak disclosure and regulatory standards amounts up to 82% between 1995 and 2008.4 The fact that there are many cross-listings destinations other than US clearly suggests that studies focusing on US only may provide an incomplete picture and a more comprehensive analysis that incorporates a full list of possible destinations is warranted.
There have been a few studies that consider multiple cross-listings destinations. These studies focus on the destination-specific characteristics such as disclosure requirement or cultural, geographic, and industrial proximities as important cross-listings
2 Doidge, Karolyi, and Stulz (2009) argue that New York did not become less attractive compared to London following Sarbanes-Oxley once relevant firm characteristics are controlled for.
3 9 major markets are US, UK, Germany, Switzerland, Canada, Australia, Norway, Singapore, and Luxembourg. Japan is excluded since foreign listings in Japanese market are quite trivial.
4 Luxembourg is favored by family controlled business groups in Korea, or chaebols, such as Hyundai/Kia Motors and LG Electronics as a cross-listing destination.
determinants. For example, Saudagaran and Biddle (1995) argue that firms choose destinations where they export more to gain visibility and facilitate marketing. An interesting result reported in this study that is contrary to the bonding hypothesis is that firms prefer destinations with lower disclosure standards. However, their empirical results are based on destination by destination analysis and thus do not fully incorporate the possibility of choosing one destination out of multiple available choices.
Our paper builds on Saudagaran and Biddle (1995) and asks whether ‘bonding’ hypothesis is still valid when we allow for multiple destinations. Specifically, we test whether firms choose destinations with stronger investor protection than those provided in their respective home markets after controlling for firm-specific characteristics that might affect the choice of destinations. By allowing multiple destinations in our empirical context, our approach attempts to overcome the limitations of previous literature that examines cross-listings targeted towards US only. Moreover, we employ alternative-specific conditional logit model (McFadden, 1974) that simultaneously considers both firm-specific and destination-specific characteristics.5 This econometric specification provides an additional advantage: we can ask more genuine where question (i.e., where do companies cross-list?) while most of previous studies investigated why question (i.e., why do companies cross-list?) or which question. (i.e. which companies cross-list?)
Using data on cross-listing decision of firms from 28 origin countries targeted towards 9 destinations during 1994-2008, we first document that destination markets generally exhibit better investor protection than home markets in univariate comparison.
That is, destination countries show higher anti-self dealing and anti-director rights and lower block premiums relative to home countries. These results seem to be consistent with the ‘bonding’ hypothesis.
However, when we account for other destination characteristics and firm-specific factors that could potentially affect cross-listings decision, we find that firms are more likely to choose destinations that are less strict in regulating self-dealings or exhibit higher block premiums relative to their respective home markets. This result is in striking contrast to those that support “bonding” hypothesis emphasized in the recent literature that focuses on cross-listings targeted at US only. That is, once we allow firms to choose destinations other than US, they seem to prefer destinations which have relatively poor quality of investor protection. We also find that the negative relationship between relative investor protection and cross-listings decision is more pronounced after Sarbanes-Oxley in 2002, consistent with the view that tougher regulatory standards might have drove off potential foreign clientele. The results are also robust to using an alternative destination-origin pair-wise specification.
Moreover, firm characteristics that induce listings in US also induce cross-listings in Germany and Switzerland, both of which exhibit low investor protection. For example, high tech firms and firms with high Tobin’s q are likely to cross-list not only in US but also in Germany and Switzerland. These results suggest that although ‘bonding’ may be a valid perspective in explaining cross-listings directed towards US, we may need additional theories for motivations behind cross-listings in other destinations.
The rest of the paper is organized as follows. The next section reviews the relevant literature and develops our main hypotheses. This is followed by description of data, and setup of the econometric specification for testing our hypotheses. The subsequent section reports the empirical results and discusses our key findings. The final section concludes.
LITERATURE REVIEW
Cross-listings have been subject of interest among both international business and corporate finance scholars. Traditional perspective in international business focuses more on the role of destination-specific characteristics that attracts foreign listings rather than firm-specific characteristics that leads firms to cross-list. In a seminal research based on a sample of 459 internationally traded multinational enterprises in 1992, Saudagaran and Biddle (1995) find that foreign listing locations are significantly influenced by financial disclosure levels and the level of exports to a given foreign country. They hypothesize that firms are reluctant to cross-list in destinations with strict accounting and regulatory disclosure requirement which could affect the management’s pursuit of private benefits. Moreover, as destination is more valuable as a product market, marketing motive will render such destination more attractive for cross-listing.
Similarly, Sarkissian and Schill (2004) find that geographic, economic, and cultural proximities between home and destination markets are important determinants of cross-listing decision. They argue that this market preference resembles those reflected in “home bias” when making international investment portfolio decisions. That is, firms choose more proximate markets in spite of high return correlation and beta risk with one’s home
market instead of maximizing the diversification gain by listing in markets with little economic correlation. Our study is related to this literature in that we explicitly incorporate designation-characteristics allowing for multiple destinations. We extend this literature by examining the effect of relative investor protection on cross-listings decision after controlling for the proximity variables identified this stream of research.
Another stream of research focuses on cross-listings directed towards US and tries to understand the factors that lead to such listings. A widely accepted perspective among corporate finance scholars suggested by Coffee (1999) and Stulz (1999) is that firms operating in poor investor protection environment can effectively utilize or borrow better investor protection mechanism by cross-listing in such exchanges, for example those in US. This voluntary commitment serves as a ‘bonding’ mechanism through which firms can persuade outside investors to provide capital by protecting minority shareholders from management’s extraction of private benefits. .
Doidge, Karolyi, and Stulz (2004) show that firms cross-listed in US exhibit a higher Tobin’s q than non-cross-listed firms, and interpret this as evidence that supports bonding hypothesis. Reese and Weisbach (2002) document that firms from French civil law origin are more likely to cross-list in US than firms from other common law countries. They also show that cross-listing are followed by increases in equity issues more so for firms originating from poor investor protection environment. Doidge (2004) shows that firms cross-listed in US exhibit substantially lower level of private benefits than
non-cross-listed firms.6 In a recent paper, Doidge et al. (2009) find that controlling shareholders who consume more private benefits of control are more reluctant to give them up and hence less likely to cross-list their firms on a US exchange, despite the many benefits that may accrue to their firm from such a listing. This stream of research that focuses on US cross-listings suggests that firms choose to cross-list to voluntarily commit themselves to higher disclosure standards. Out study directly challenges this view by considering multiple cross-listings decision simultaneously.
Perhaps the most related paper to ours is Pagano et al. (2002) who examine both destination specific and firm specific characteristics in explaining cross-listing decision. They first document that many European firms cross-listed in US during 90’s but not the other way around. They also show that US exchanges attracted high-tech and export-oriented companies that expand rapidly without significant leveraging. The fact that US was able to attract European firms are interpreted as being supportive of the bonding hypothesis. However, their analysis on choice of cross-listing destination considers only two broad possible alternatives, US or Europe, and hence does not fully exploit cross country variations in investor protection or private benefits.
In the following section, we attempt to reexamine the role of destination’s investor protection by allowing multiple destinations in the companies’ foreign listing location choice. Moreover, to control for both firm- and destination-specific variables which explain the cross-listing location choice, we employ the alternative-specific conditional logit model (McFadden, 1974).
6 Benos and Weisbach (2004) provide a survey of cross-listings literature that is consistent with the bonding hypothesis.
DATA AND SAMPLE
The cross-listing transaction data are obtained from Global New Issues database offered by SDC Platinum. We identify all common stock issuances where a firm is listing its shares in certain foreign nation for the first time. The sample period is from 1994 to 2008 as internationally comprehensive data are available since 1994 from SDC. As we exclude all private placements of stocks, preferred stocks, and OTC issuances, the cross-listing transactions sample only includes ordinary common stock issuance. Firms in financial industry were deleted to maintain similar attributes among sample firms. Investigating origin nations, we drop origins such as Bermuda, Cayman Island, and etc, as there is high chance that firms don’t represent the origin purely. For example, Bermuda is well-known for its tax haven status. Many “originally” Taiwanese companies establish their operations there. For stock exchanges in destination countries, we exclude cross-listing on Euronext which is the converged exchange of several European nations as well as cross-listing on those European nations’ exchanges before the foundation of Euronext. Again, we eliminate transactions on Hong Kong exchange as the most of the cross-listing is from China. After that, for tractability, we exclude those origin and destination pairs if they exhibit less than 10 transactions during the sample period. The number of destination countries with more than 10 foreign listings turns out to be nine (Australia, Canada, Luxembourg, Germany, Norway, Singapore, Switzerland, UK, US). The number of origin countries is 28. The final sample contains 1,201 cross-listing transactions.
Table 1 reports the number of listed foreign firms as well as the proportion of listed foreign firms within each destination stock markets. We obtain these numbers from World
Federation of Exchanges. The results indicate that most of these markets attract a non-trivial number of foreign listings ranging from 2.5% in Canada to 92.1% in Luxembourg. Although the total number of foreign listings is the largest in US, the relative proportion of inbound foreign listings falls below Luxembourg, Switzerland, Germany, Singapore, and UK. As of end of 2008, foreign firms listed in US only account for 27% of all foreign listings in our 9 destination markets. These findings suggest that exluding non-US markets as potential cross-listing destinations may produce biased results.
Our empirical approcah incorporates country-level origin-destination pair variables as alternative-specific variables, which take into account the differences between destination countries in econometric model. As a measure of the closeness between origin and destination markets, we resort to geographic, cultural, and economic distance between the two countries as in the previous studies. Geographic distance variable is the physical distance between capital cities of two countries. Cultural distance index is obtained using Geer Hofstede’s national culture index which is well-established measure in international business field (Hofstede, 1991). This index is formed based on deviations between countries in four cultural dimensions (i.e. power distance, uncertainty avoidance, masculinity/femininity, and individualism). We adopt methodology used in Kogut and Singh (1988) which corrects the index for differences in the variances of each dimension and then obtain arithmetical averages. Economic distance is measured as origin country’s exports to cross-listing destination country scaled by origin country’s total exports as in Sarkissian and Schill (2004). We obtain this information from Direction of Trade database offered by International Monetary Fund (IMF).
We also identify three country level indices to proxy for the level of private benefits or investor protection; anti-self dealing index, anti-director index, and block premium index. Anti-self dealing index is obtained from Djankov et al. (2008), where they provide an index of the strength of minority shareholder protection against a hypothetical self-dealing by the controlling shareholder. When a conduct of someone consists of taking advantage of one’s position in a transaction and acting for his own interests rather than from interests of other beneficiaries, it is referred to as self-dealing transaction. Those who control a corporation can use their advantages arising from controlling positions to divert corporate wealth to themselves. Various forms of such self-dealing include transfer pricing, appropriation of corporate opportunities, self-serving financial transactions such as directed equity issuance or personal loans to insiders, and outright theft of corporate assets (Shleifer and Vishny, 1997). Hence, the anti-self dealing index used in the analysis shows how well the regulation limits controlling shareholders’ extraction of private benefits. If the index of A country has higher number than B country, it indicates that the minority shareholders are protected better in A relative to B. More specifically, the index focuses on private enforcement and measures the extent of disclosure, the extent of director liability, and the ease of shareholder lawsuits. Djankov et al. (2008) argue that it generally works better than the previously introduced index of anti-director rights in predicting various financial market outcomes.
The anti-director index which measures how well minority shareholders are protected is also obtained from Djankov et al. (2008). They revised the original anti-director index reported in La Porta, Lopez-de-Silanes, Shleifer, and Vishny (1997, 1998).
Similar to anti-self dealing index, the higher anti-director rights index indicate better investor protection.. The financial disclosure level index which is used in Saudagaran and Biddle (1995) is based on survey which asks the relative “rank” of each country in terms of strictness of financial disclosure requrements. Anti-self dealing index and anti-director index broadly covers Saudagaran and Biddle’s index as these measure the legal requirements in force for each component in the index for each country (???).
As an alternative measure of (lack of ) investor protection, we also use the block premium index from Dyck and Zingales (2004) which is widely accepted as a measure of private benefits,. This focuses on the control premium which the acquirers pay in privately negotiated transfers of controlling blocks in publicly traded companies. Higher block premium index indicates higher private benefits and thus lower investor protection, as there’s more room for block holders to benefit from the transaction.
Beside the country level variables defined for each origin-destination pair, we also incorporate firm-specific financial data. Dataset is complied using both SDC platinum and Worldscope to complement one another if there are missing data. Three firm-specific financial variables are included in the empirical models; Firm size, as proxied by the natural logarithm of total assets before cross-listing, operating income scaled by total assets, and Tobin’s Q We calculate Tobin’s Q as the market value of equity plus book value of total liabilities scaled by the book value of total assets.
To control the effect of stock exchange characteristics, we incorporate three control variables; turnover velocity, market capitalization, and number of foreign firms listed. Data is obtained from World Federation of Exchanges (WFE) and IMF database. Turnover
velocity is turnover scaled by market capitalization of stock exchange. It shows how liquid the stock market is. Market capitalization is stock market capitalization scaled by GDP to show stock market’s significance in economy. Number of foreign firms listed on stock exchange is included to control the effect of openness to foreign firms.
In addition, we included two control variables designed to capture the effect of firm level ownership structure. Ownership dummy is set to 1 when the largest shareholder owns more than 20% of shares. Following Pagano et al.(2002), high-tech dummy is included as high-tech firms turn to foreign equity markets as foreign investors and analysts know more about the business and evaluate better. Especially, the US market is attractive by having the presence of expertise as well as the big product market of high-tech firms’ respective industries. SIC 4-digit high-high-tech sector codes identified in Pagano et al.(2002) are used.
EMPIRICAL ANALYSIS
Distribution of Cross-Listings around the WorldTable 2 reports the distribution of cross-listing events in our sample by origin and target countries. As explained in the sample construction process, we require at least 10 foreign listings at the target country to be included in the sample for tractability. This filter yields a total of 9 destination countries. The number of origin countries is 28. Panel A presents the number of listings and Panel B presents the total proceeds raised for each origin-target country pair during the sample period. The last row in each panel presents the relative proportion of each target country within the sample. In panel C, we report the
geographic and cultural distance as well as the amount of exports for selected origin-destination pairs in our sample. The results are reported for all 9 origin-destinations and 11 selected origins whose largest destination is not US in terms of either number of cross-listings or total proceeds raised. .
The results from Panels A and B indicate that there is a clear concentration in terms of the destination countries. For example, 44.4% (56.3%) of all new cross-listings made during the sample period in terms of numbers (total proceeds) are directed towards US. On the flip side, the results also suggest that cross-listings at non-US destinations are by no means trivial. Roughly half of all cross-listings in terms of both numbers and proceeds are directed toward non-US exchanges. Moreover, in 11 out of 27 origin markets excluding US, the largest destination is not US in terms of either number of listings or proceeds raised.
These results suggest that recent literature in corporate finance that focuses on cross-listings targeted at US only may not be able to fully explain the motivations behind cross-listings at non-US targets. Moreover, studies focusing on cross-listings directed towards a single market implicitly ignore the other alternative destinations and therefore cannot estimate the effect of choice (i.e. destination) specific variables on the cross-listings location decision. By considering multiple destinations, our approach allows us to overcome this drawback.
The results from panel C indicate that geographic and cultural distance as well as economic ties proxied by amount of exports matters in many cases. (For example, Austrian listings in Germany, Chinese and Hong Kong listings in Singapore, and Irish listings in
UK). This suggests that proximity variables need to be controlled for when we estimate the effect of relative investor protection on cross-listings decision.
Univariate Analysis
Table 3 reports the summary of market level measures of investor protection private benefits. We consider three measures/ Anti-self dealing index and anti-director rights from Djankoc et al. (2008), and block premium from Dyck and Zingales (2004). For detonations, we report the averages of all destinations as well as the numbers for each individual markets. For origins, we report the averages of all origins and non-destination origins for brevity.
The relative rankings among destinations are broadly consistent with the disclosure level rankings reported in Saudagaran and Biddle (1995). For example, US, UK, and Canada generally score high in terms of investor protection or disclosure standards, while Germany and Switzerland score low.
Comparison across destinations and origins indicate that destination markets exhibit somewhat better investor protection or lower levels of private benefits relative to origin markets. Specifically, averages of anti-self dealing index and anti-director rights are higher and average block premium is lower in destination countries than in origin countries.
To implement a statistical test, we weight each market level index by the number of cross-listings for each origin-destination pair and obtain the difference between origin index and destination index (i.e. origin index minus destination index). We report the distribution of these weighted differences in indices in table 4. The results indicate that
destination markets exhibit statistically significant better investor protection or lower private benefits than origin markets in line with the result in table 3. Taken together, these results seem to be consistent with the predictions in ‘bonding’ hypothesis that firms voluntarily commit to tougher regulatory standards. However, as we have observed in panel C of talbe 2, there are other socio-economic factors that could affect the cross-listings decision, which should be controlled for simultaneously in a multivariate framework.
Distribution of Explanatory Variables
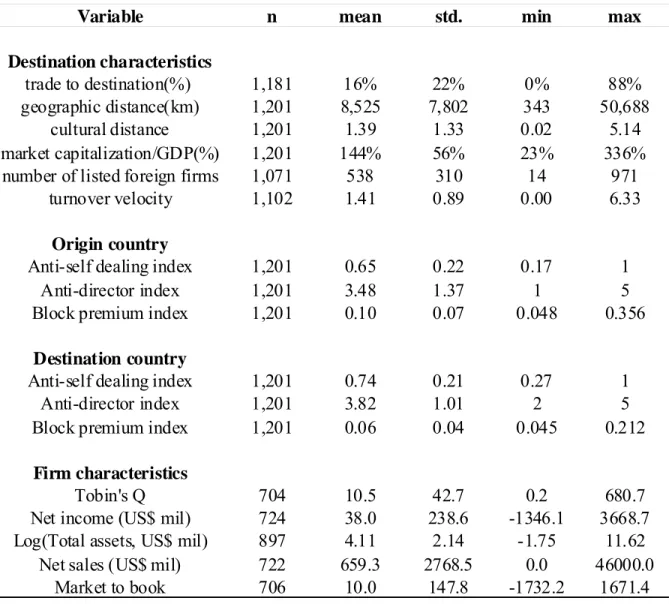
Table 5 reports the distribution of the variables that are hypothesized to influence the cross-listing location decision. The first three variables – trade to destination, geographic distance and cultural distance - are designed to capture socio-economic closeness or proximity between the origin and the target. These variables are choice-specific variables defined for each origin-target country pair. All of these variables exhibit a quite dispersed distribution which would enhance the power of the regressions. Following three variables – market capitalization/GDP, listing number of foreign firms, and turnover velocity - show the stock exchange characteristics. These variables are included to capture the influence of attractiveness of stock exchange on cross-listing location decision. The next set of variables measure the level of investor protection at both the origin and destination countries. We employ three measures defined at country level; anti-self dealing index and anti-director index from Djankov et al. (2008) and block premium index from Dyck and Zingales (2004). Block premium is a typical measure of private benefits of control originally developed by Barclay and Holderness (1989) which is highly correlated
with investor protection. Higher levels of anti-self dealing index and anti-director index imply good investor protection, while higher levels of block premium index imply a poor investor protection.
The numbers suggest that destination countries exhibit higher scores of anti-self dealing index and anti-director index and lower levels of block premium in line with tables 3 and 4. However, this simple univariate comparison does not control for firm specific characteristics as well as other alternative-specific characteristics. Our multivariate results in the next sub-section provide a quite contrasting result.
The final set of variables is firm-specific characteristics. The numbers indicate that firms that decide to cross-list overseas are generally profitable firms with high Tobin’s Q and market–to-book equity.
Multivariate Analysis: Choice-Specific Conditional Logit
Our main research question is how the characteristics of the destination countries influence the location decision of the cross-listing firms, controlling for various firm specific characteristics. The appropriate econometric specification for this situation is the choice-specific or alternative-specific conditional logit model originally developed by McFadden (1974). Specifically, we estimate the following random utility model;
ij i j ij ij X Z U = β ′ + α ′ + ε
where j indexes destination countries (from 0 to 8, Singapore is the baseline alternative), i indexes each firm, Xij is the vector of values of the attributes of the jth destination in relation with the ith firm, Zi are firm-specific variables that do not vary across
alternative, β is a vector of coefficients common to all destinations, αj’s are vectors of coefficients that differs across destinations, and εij are independently and identically distributed with Weibull distribution. McFadden (1974) shows that the probability that a certain alternative will be chosen can be expressed as follows.
∑
= ′ + ′ ′ + ′ = = = 8 0 ) 1 Pr( k Z X Z X ij ij i k ik i j ij e e U P α β α βTo create Xij ’s - choice specific variables which vary across each firm1 - , we take the destination country’s attributes relative to the attributes of the origin country. Table 3 reports the results of this analysis. In table 6, proxies for investor protection at the destination country are scaled by the corresponding values of the origin country.2
The results from table 6 indicate that firms are more likely to choose as cross-listing destination when there are stronger trade relationships and less geographic, cultural difference between the two countries as expected, consistent with the previous literature.
The next three variables which report the effect of relative investor protection yields interesting results. The results suggest that firms are more likely to choose cross-listing destinations that are less strict in regulating self-dealing or exhibits higher block premiums relative to the origin country, broadly consistent with the implications provided in
Saudagaran and Biddle (1995). On the other hand, this result is quite different from the implications drawn mostly from the previous studies focusing on cross-listings in US that foreign firms choose to cross-list in US to voluntarily commit themselves to higher disclosure standards (‘bonding’ hypothesis). Once we allow firms to choose other
destinations, firms seem to prefer destinations that have relatively poor quality of investor protection.
The lower part of table 6 reports the effect of firm-specific attributes on choosing destination countries. The results indicate that firms in high-tech sector are more likely to choose US as the cross-listings destination, consistent with our prior conjectures. But, high-tech firms are also more likely to choose Germany and Switzerland, both of which do not score high in terms of investor protection. Similar results hold for Tobin’s q as well. That is, firms with higher growth opportunities are more likely to choose US, but they also choose Germany and Switzerland. In other words, firms-characteristics that leads to US cross-listings are also likely to lead to cross listings in other markets with less investor protection. Overall, tThese findings suggest that “bonding” does not seem to be the key motivation behind cross-listings once we incorporate other non-US destinations.
Sub-period Analysis: Before and After Sarbanes-Oxley
Sarbanes-Oxley Act was enacted in 2002 in the aftermath of Enron and WorldCom scandals to tighten disclosure requirements and regulatory standards. There is still a bebate on whether this legislation has reduced New York’s attractiveness as a cross-listing destination. If ‘bonding’ is the main reason that firms cross-list, then their preference towards tougher stock exchanges may be stronger following Sarbanes-Oxley. On the other hand, if firms prefer less strict markets at the cross-listings destination after Sarbanes-Oxley, then it would be supportive of the idea of the practitioners that too much regulations might scare away potential foreign listing clientele.
We report the results of this sub-period analysis in table 7. The results indicate the negative relationship between relative investor protection and cross-listings choice is more pronounced after Sarbanes-Oxley. This result also provides evidence against the ‘bonding’ hypothesis.
Alternative Specification
In this sub-section, we estimate an alternative specification which treats each destination-origin pair as unit of observation as a robustness check. This is similar to the approach taken by Erel et al. (2009) where they analyze the cross-country merger decisions. In this analysis, the dependent variable is the number of cross-listings for the destination-origin pair scaled by total number of cross-listings in the destination country. Since the unit of observation is at the country level, firm-specific variables are all omitted. The results are reported in table 8. In the first column unit of observation is strictly origin-destination pair so that each pair is treated with equal weight. In the second column we weight each pair by the number of cross-listings for that pair. Industry specification (SIC 4-digit) and year effects are controlled for in this model.
For relative anti-self dealing index and block premium, the results are consistent with those obtained in table 6. That is, firms are more likely to cross-list in countries that are less strict in regulating self-dealing or exhibits higher levels of block premium. However, the coefficient on the anti-director rights has opposite sign compared to table 6. Hence, we remain cautious in interpreting the effect of anti-director rights on cross-listings decision.
DISCUSSION AND CONCLUSION
This paper examined the firms’ foreign listing location choice. We found that firms are more likely to choose cross-listing destinations that have less restriction on self-dealing or higher block premiums relative to the origin country. This finding is in strict contrast to “bonding” hypothesis which argues that firms choose to cross-list to voluntarily commit themselves to higher disclosure standards.
Our study contributes to the previous literature on cross-listing in two important dimensions. First, we argue that findings from studies focusing on US - where investor protection is strong - as the only available destination have to be interpreted with caution. While some foreign firms might elect to cross-list in US for bonding purpose, other firms still try to keep their private benefits in tact by cross-listing in countries with weak investor protection. Second, this paper employs alternative-specific conditional logit model that incorporates both firm-specific and choice specific attributes, which allows us to examine more genuine location choice question compared to previous studies on cross-listing.
This paper is not without limits. First, we were not able to consider firm-level private benefit variables such as the deviation of cash flow rights from control rights since these data are not readily available. Future research may attempt to use such data to enhance our understanding on the role of private benefits in cross-listing decision. Second, as recently suggested by Siegel (2009), there exist other bonding mechanisms such as formation of strategic alliance with foreign multinational enterprise. Since such mechanisms may have a substitutive relationship with cross-listing,, we may be able to
evaluate bonding hypothesis in a more comprehensive way if we can control for such firm-level characteristics (e.g., number of strategic alliance with foreign partners).
NOTES
1. If choice-specific variables do not vary across observations, the maximum likelihood estimator is not-unique and hence estimation procedure fails. See Ronning (2002) for details.
2. We also tried the difference between destination and origin, but the maximum likelihood estimation would not converge.
REFERENCES
Benos, E. and M. Weisbach, 2004, Private benefits and cross-listings in the United States,
Emerging Markets Review 5, 217-240.
Biddle, Gary C., and Shahrokh M. Saudagaran, 1989, The effects of financial disclosure levels on firms' choices among alternative foreign stock exchange listings, Journal of Inter- national Financial Management and Accounting 1, 55-87.
Coffee, J., 1999, The future as history: the prospects for global convergence in corporate governance and its implications, Northwestern Law Review, 93, 641-708.
Djankov, S., La Porta, R., Lopez-de-Silanes, F., & Shleifer, A. 2008. The law and economics of self-dealing. Journal of Financial Economics, 88(3): 430–465.
Dyck, A., Zingale, L. 2004. Private Benefits of Control: An International Comparison.
Journal of Finance, 59: 537-600
Doidge, C. 2004. U.S. cross-listings and the private benefits of control: Evidence from dual-class firms. Journal of Financial Economics, 72: 519-553.
Doidge, Craig, G. Andrew Karolyi, and Ren´e M. Stulz. 2004. Why are foreign firms listed in the U.S. worth more? Journal of Financial Economics. 71: 205–238.
Doidge, C., Karolyi, A., Lins, K., Miller, D., and Stulz, R. 2009. Private bebefits of control, ownership, and the cross-listings decision. Journal of Finance 64: 425-466.
Doidge, C., Karolyi, A., Stulz, R. 2009. Has New York become less competitive than London in global markets? Evaluating foreign listing choices over time. Journal of Financial Economics, 91: 253-277.
Dyck, A., Zingales, L. 2004. Private benefits of control: an international comparison.
Journal of Finance, 59: 537–600.
Erel, Isil, Liao, Rose C. and Weisbach, Michael S., World Markets for Mergers and Acquisitions (June 29, 2009). Charles A. Dice Center Working Paper No. 2009-03-011; Fisher College of Business Working Paper No. 2009-03-11. Available at SSRN: http://ssrn.com/abstract=1427408
Hofstede, G..1991. Cultures and Organizations: Software of the Mind. McGraw-Hill, London, UK.
Kogut, B. and Singh, H. 1988. The Effect of National Culture on the Choice of Entry Mode,
Journal of International Business Studies, 19: 411-432
La Porta, R., Lopez-de-Silanes, F., Shleifer, A., Vishny, R. 1997. Legal determinants of external finance. Journal of Finance, 52: 1131–1150.
La Porta, R., Lopez-de-Silanes, F., Shleifer, A., & Vishny, R. 1998. Law and finance.
Journal of Political Economy, 106(6): 1113–1155.
McFadden, D. 1974. Conditional Logit Analysis of Qualitative Choice Behavior. In P. Zarembka (Ed.), Frontiers in Econometrics, 105-142. New York, Academic Press. Pagano, M., Röell, A. A., Zechner, J. 2002. The geography of equity listing: Why do
companies list abroad? Journal of Finance, 57: 2651-2694.
Reese, W.A., and M. Weisbach, 2002, Protection of minority shareholder interests, crosslistings in the United States, and subsequent equity offerings, Journal of Financial Economics, 66, 65-104
Ronning, G. 2002. Estimation of discrete choice models with minimal variation of alternative-specific variables. Econometric Reviews, 21(1): 135-146.
Sarkissian, S., Schill, M. 2004. The overseas listing decision: New evidence of proximity preference. Review of Financial Studies, 17: 769-809.
Saudagaran, S. and Biddle, G. 1995. Foreign Listing Location: A Study of MNCs and Stock Exchanges in Eight Countries. Journal of International Business Studies, 26: 319-341.
Shleifer, A. and Vishny, RW. 1997. A survey of corporate governance, Journal of Finance, 52(2): 737-783.
Siegel, J. 2009. Is there a better commitment mechanism than cross-listings for emerging-economy firms? Evidence from Mexico, Journal of International Business Studies, 40: 1171–1191.
Stulz, R., 1999, Globalization of equity markets and the cost of capital, Journal of Applied Corporate Finance 12, 8-25
World Economic Forum. 2003. The Global Competitiveness Report 2002–2003.New York, Oxford University Press
Table 1 Number and Proportion of Foreign Listings in Destination Markets 1995 1996 1997 1998 1999 2000 2001 2002 2003 2004 2005 2006 2007 2008 Average UK 531 453 467 466 448 448 382 382 381 351 334 343 719 681 456.14 21.2% 17.3% 18.6% 19.2% 19.7% 18.9% 16.4% 13.5% 14.2% 12.4% 10.8% 10.5% 21.7% 22.0% 16.9% US 673 756 872 894 895 971 901 901 864 872 884 872 832 846 859.5 8.2% 8.6% 9.9% 10.6% 10.5% 12.4% 12.7% 13.7% 14.0% 14.3% 14.7% 14.5% 13.9% 13.1% 12.2% Singapore 22 30 40 37 54 63 67 67 76 25 122 247 290 312 103.71 8.1% 10.1% 12.0% 10.3% 13.2% 13.1% 13.6% 13.4% 13.6% 3.9% 17.8% 34.9% 38.1% 40.7% 17.3% Luxembourg 228 224 228 223 226 216 197 197 198 192 206 224 227 228 215.29 80.6% 80.6% 80.3% 80.8% 81.6% 80.0% 76.7% 80.4% 81.8% 82.1% 84.1% 86.2% 87.0% 87.0% 82.1% Germany n/a n/a n/a 210 234 245 219 219 182 159 116 104 105 90 171.18 n/a n/a n/a 31.7% 27.5% 24.9% 22.3% 23.4% 21.0% 19.4% 15.2% 13.7% 12.1% 10.8% 20.2%
Canada 62 58 58 49 47 42 35 35 38 32 39 52 70 86 50.214 4.9% 4.4% 4.1% 3.4% 3.2% 3.0% 2.7% 0.9% 1.1% 0.9% 1.0% 1.4% 1.8% 2.2% 2.5% Norway 14 14 21 22 20 24 24 24 22 22 28 34 40 50 25.643 8.5% 8.1% 9.7% 9.4% 9.3% 11.2% 11.3% 11.8% 12.4% 11.7% 12.8% 14.8% 16.1% 19.3% 11.9% Switzerland 233 223 212 193 173 164 140 140 130 127 116 92 84 70 149.79 51.9% 51.1% 49.5% 45.5% 42.0% 39.4% 34.0% 35.2% 31.0% 31.1% 29.0% 26.4% 24.6% 21.7% 36.6% Australia 49 55 60 60 70 76 66 66 66 66 68 78 85 85 67.857 4.2% 4.6% 4.9% 4.9% 5.4% 5.4% 4.7% 4.6% 4.5% 4.2% 4.0% 4.3% 4.3% 4.2% 4.6%
Note: The first row in each market represents the number of foreign firms listed in each market while the second row presents the proportion of foreign firms out of all listed firms in each market. Table 1 Number and Proportion of Foreign Listings in Destination Markets
Table 2 Summary of Cross-listings
Panel A: Number of Cross-lisgints
Origin A ustralia C anada Germany Luxembourg N orway Singapore Sw itzerland U K US total
Argentina 1 1 10 12 Australia 8 34 7 49 Austria 12 3 3 18 B razil 2 14 16 C anada 4 4 2 38 76 124 Chile 11 11 China 4 1 98 14 80 197 France 1 21 22 G ermany 4 9 13 Greece 1 3 19 23 HK 4 1 1 37 12 27 82 India 1 41 8 18 10 78 Indonesia 4 2 6 12 Ireland 2 32 13 47 Israel 6 1 3 24 86 120 Italy 3 5 6 14 Mexico 1 2 17 20 Netherlands 7 1 11 22 41 N Zealand 12 4 16 R ussia 1 26 6 33 Singapore 6 1 1 1 8 17 S. Africa 1 1 1 11 1 15 S. Korea 1 3 2 7 12 25 Sw eden 4 8 9 21 Switzerland 7 3 7 17 Taiwan 6 3 3 7 19 UK 4 2 1 1 45 53 US 6 13 6 2 3 56 86 total 42 26 49 55 11 154 13 318 533 1201 percentage 3.5% 2.2% 4.1% 4.6% 0.9% 12.8% 1.1% 26.5% 44.4% 100.0% Destina tio n
Panel B: Total Proceeds raised in Cross-listings (US$ bil)
Origin Australia Canada Germany Luxembourg Norway Singapore Switzerland UK US total
Argentina 0.00 0.36 1.39 1.75 Australia 0.25 0.83 0.74 1.82 Austria 0.64 0.34 0.54 1.52 Brazil 0.11 1.17 1.28 Canada 0.04 0.16 0.04 1.30 7.86 9.40 Chile 0.77 0.77 China 0.12 0.01 4.12 0.59 11.47 16.30 France 0.16 8.08 8.25 Germany 0.16 3.30 3.47 Greece 0.06 0.21 2.93 3.20 HK 0.06 0.06 0.05 1.23 0.32 3.66 5.38 India 0.00 2.60 0.13 1.96 2.53 7.23 Indonesia 0.36 0.18 1.00 1.55 Ireland 0.08 2.75 1.63 4.46 Israel 0.18 0.01 0.19 0.51 5.01 5.91 Italy 0.16 0.06 1.47 1.69 Mexico 0.04 1.80 2.35 4.19 Netherlands 0.19 0.00 1.92 4.51 6.63 NZealand 0.91 0.00 0.23 1.14 Russia 0.05 14.33 0.66 15.04 Singapore 0.05 0.04 0.45 0.04 0.00 0.97 1.55 S. Africa 0.00 0.05 0.02 1.58 0.12 1.77 S. Korea 0.00 0.46 0.32 4.43 2.97 8.18 Sweden 0.06 0.43 0.87 1.36 Switzerland 0.18 0.57 1.84 2.59 Taiwan 2.01 0.06 0.53 1.78 4.38 UK 0.06 0.01 0.01 0.00 3.75 3.83 US 1.98 0.55 0.26 0.12 0.27 2.07 5.26 total 3.28 0.92 1.77 5.68 0.31 6.29 0.96 37.60 73.06 129.88 percentage 2.5% 0.7% 1.4% 4.4% 0.2% 4.8% 0.7% 29.0% 56.3% 100.0% Destination
Destination T
Origin Australia Canada Germany Luxembourg Norway Singapore Switzerland UK US
Australia Geo 15.9 16.1 16.7 16.0 6.3 16.7 17.0 12.5 Cultural 0.12 0.32 0.63 2.71 3.67 0.29 0.13 0.02 Trade 1.0 0.9 0.0 0.1 2.7 0.3 3.1 5.6 Austria Geo 11.8 6.6 0.5 0.8 1.4 9.7 0.7 1.2 8.7 Cultural 1.27 1.53 0.53 1.21 4.99 5.12 0.48 1.45 1.47 Trade 0.4 0.6 27.3 0.1 0.3 0.2 4.4 3.4 4.0 China Geo 8.9 10.5 7.4 8.0 7.0 4.5 8.1 8.2 8.7 Cultural 3.20 2.65 2.49 2.41 5.43 0.52 2.40 2.99 2.99 Trade 5.5 5.6 15.7 0.5 0.7 9.0 1.1 9.7 79.8 HK Geo 7.4 12.4 8.8 9.5 8.6 2.6 9.4 9.7 10.4 Cultural 2.45 1.83 1.91 1.67 3.85 0.29 1.87 2.30 2.30 Trade 2.7 2.9 7.7 0.0 0.4 4.8 1.1 7.2 41.7 India Geo 10.4 11.4 5.8 6.7 6.0 3.9 6.3 8.0 11.3 Cultural 1.67 1.22 1.44 1.21 3.42 0.81 1.46 1.71 1.52 Trade 0.5 0.7 2.4 0.0 0.1 1.9 0.4 2.9 10.3 Ireland Geo 17.2 4.9 1.3 1.0 1.3 11.2 1.2 0.5 7.3 Cultural 0.35 0.41 0.42 0.93 3.34 2.80 0.25 0.17 0.34 Trade 0.6 0.4 7.5 0.1 0.6 0.5 2.2 15.6 12.2 N Zealand Geo 2.2 14.5 18.1 18.7 17.7 8.5 18.8 18.8 11.6 Cultural 0.16 0.19 0.31 0.56 2.33 3.64 0.29 0.27 0.25 Trade 3.3 0.3 0.4 0.0 0.0 0.2 0.0 0.8 2.0 Russia Geo 14.5 7.2 1.6 2.2 1.7 8.4 2.3 2.5 8.4 Cultural 4.16 3.40 3.30 2.12 3.98 3.71 3.82 5.14 4.21 Trade 0.0 0.2 10.8 0.0 0.3 0.4 5.6 4.9 6.3 S. Africa Geo 11.1 13.1 8.8 8.7 9.7 8.7 8.4 9.0 16.5 Cultural 0.34 0.25 0.22 0.39 2.90 2.06 0.20 0.43 0.32 Trade 0.5 0.2 1.8 0.0 0.0 0.2 0.5 2.2 2.5 S. Korea Geo 8.3 10.5 8.2 8.7 7.7 4.7 8.9 8.9 8.3 Cultural 3.30 2.50 2.12 1.12 2.87 2.72 2.53 4.07 3.46 Trade 2.7 2.3 6.1 0.0 0.5 5.9 1.0 4.2 31.3 Taiwan Geo 7.2 12.0 9.0 9.6 8.7 3.2 9.7 9.8 9.7 Cultural 3.30 2.50 2.12 1.12 2.87 2.72 2.53 4.07 3.46
Anti-self dealing index Anti-director index Block premium Destination Australia 0.760 4.000 0.055 Canada 0.640 4.000 0.045 Germany 0.280 3.500 0.109 Luxembourg 0.280 2.000 0.212 Norway 0.420 3.500 0.048 Singapore 1.000 5.000 0.045 Switzerland 0.270 3.000 0.109 UK 0.950 5.000 0.045 US 0.650 4.000 0.045 Average 0.583 3.778 0.079 All Origin Average 0.551 3.643 0.120 Non-Destination Origin Average 0.518 3.548 0.137
Table 4 Differences in Investor Protection or Private Benefits between Origin and Destination
Obs.
mean
s.d
t-stat
mimium
25%
median 75%
max z-value
anti-self dealing
1,201
-0.09
0.27
-12.14
-0.78
-0.30
-0.08
0.11
0.72
-11.05
anti-director
1,201
-0.34
1.80
-6.63
-4.00
-1.50
0.00
1.00
3.00
-4.96
block premium
1,201
0.04
0.08
17.49
-0.16
0.01
0.01
0.06
0.31
24.19
Table 5 Distribution of Destination and Firm Characteristics
Variable n mean std. min max
Destination characteristics
trade to destination(%) 1,181 16% 22% 0% 88%
geographic distance(km) 1,201 8,525 7,802 343 50,688
cultural distance 1,201 1.39 1.33 0.02 5.14
market capitalization/GDP(%) 1,201 144% 56% 23% 336% number of listed foreign firms 1,071 538 310 14 971
turnover velocity 1,102 1.41 0.89 0.00 6.33
Origin country
Anti-self dealing index 1,201 0.65 0.22 0.17 1
Anti-director index 1,201 3.48 1.37 1 5
Block premium index 1,201 0.10 0.07 0.048 0.356 Destination country
Anti-self dealing index 1,201 0.74 0.21 0.27 1
Anti-director index 1,201 3.82 1.01 2 5
Block premium index 1,201 0.06 0.04 0.045 0.212 Firm characteristics
Tobin's Q 704 10.5 42.7 0.2 680.7
Net income (US$ mil) 724 38.0 238.6 -1346.1 3668.7 Log(Total assets, US$ mil) 897 4.11 2.14 -1.75 11.62
Net sales (US$ mil) 722 659.3 2768.5 0.0 46000.0
Table 6 Cross-listing location determinants anaysis using alternative-specific conditional logit model
country pair variable (1) (2) (3) (4)
trade to destination 3.34** 3.78*** 4.18*** 4.75*** (0.001) (0.000) (0.000) (0.000) geographic distance -4.98*** -4.37*** -4.50*** -4.49*** (0.000) (0.000) (0.000) (0.000) cultural distance -6.67*** -7.58*** -7.50*** -6.96*** (0.000) (0.000) (0.000) (0.000)
relative anti-self dealing -3.85*** -6.69***
(0.000) (0.000)
relative anti-director -2.09* -3.80***
(0.036) (0.000)
relative block premium 4.04*** 6.86***
(0.000) (0.000)
turnover velocity -0.24 -0.22 -0.00 -0.41
(0.809) (0.828) (0.998) (0.681) market capitalization/GDP -2.00* -2.11* -2.24* -1.83+ (0.046) (0.035) (0.025) (0.067)
no. of foreign firms 0.08 0.09 0.12 0.13
(0.940) (0.932) (0.901) (0.896) Wald chi2(47) 282.18 271.68 266.93 291.69 Log likelihood -543.3419 -548.8619 -541.55894 -506.97798 Prob > chi2 0.0000 0.0000 0.0000 0.0000 Number of cases 547 547 547 547 + if p<0.1 * if p<0.05, ** if P<0.01, and *** if P<0.001 Firm-specific determinants by country
Firm variable Australia Canada Germany Luxe mbourg Norway Switzerland UK US Singapore Tobin's Q -0.06 3.70*** 3.73*** -1.41 1.82+ 2.75** 3.87*** 3.92*** (0.955) (0.000) (0.000) (0.159) (0.069) (0.006) (0.000) (0.000) Operating income -4.85*** -3.77*** -2.99** -0.81 -3.68*** -3.76*** -5.64*** -4.36*** (0.000) (0.000) (0.003) (0.416) (0.000) (0.000) (0.000) (0.000) log(Total assets) 0.02 0.86 0.24 3.68*** -1.31 2.94** 2.90** 5.64*** (0.981) (0.388) (0.807) (0.000) (0.190) (0.003) (0.004) (0.000) Ownership dummy -0.52 -2.07* -1.76+ -0.10 -0.02 -2.69** -0.68 -0.42 (0.603) (0.039) (0.078) (0.922) (0.982) (0.007) (0.495) (0.673) High-tech sector dummy 0.56 -1.16 3.27** 0.02 -0.02 3.14** 0.29 4.62*** (0.579) (0.248) (0.001) (0.985) (0.982) (0.002) (0.774) (0.000) constant -1.76+ -3.33** -6.79*** -7.26*** -1.47 -6.87*** -0.67 -5.82***
(0.079) (0.001) (0.000) (0.000) (0.140) (0.000) (0.506) (0.000)
Note: The altenative specific conditional model uses both country pair variables and firm-specifc variables in one analysis. Thus, the results are reported together in each panel. Here, we only report firm-specific determinants result from specification (4). Anti-self dealing index shows the extent of investor protection from private benefit(self-dealing by the controlling shareholders). Anti-director index measures the protection of mirotiry shareholders. Block primium by legal origin shows control premium for block transactions. Higher the anti-self dealing index and anti-director index, higher the investor protection. Higher the block premium index, lower the investor protection. All absolute terms are measured by absolute value of (destination’s index - origin’s index). Turnover velocity is (stock exchange's turnover)/(market capitalization). No. of foreign firms is (number of foreign firms in destination stock exchange)/(total number of foreign firms in all exchange). Tobin's Q is obtained by (market value+ total liability)/total assets. Operating income is operating income scaled by total assets. Ownership dummy is set to 1 when the largest shareholder owns over 20% of shares. SOX dummy is set to 1when a firm cross-listed its stock before the Sarbanes-Oxley Act enacted.(June
Table 7 Sub-period Analysis: Before and After Sarbanes-Oxley Panel A: Before Sarbanes-Oxley
Firm-specific determinants by country
country pair variable Firm variable Australia Canada Germany Luxembourg Norway Switzerland UK US Singapore trade to destination 2.38* Tobin's Q 1.44 0.04 1.46 1.00 -0.19 1.46 1.45 1.46
(0.017) (0.149) (0.968) (0.145) (0.317) (0.851) (0.145) (0.148) (0.144)
geographic distance -2.00* Operating income -1.45 -0.00 -1.12 -0.78 -0.05 -0.82 -1.69+ -1.55
(0.046) (0.146) (0.999) (0.264) (0.435) (0.958) (0.410) (0.092) (0.121)
cultural distance -4.77*** log(Total assets) 2.10* 0.00 1.42 2.47* 2.25* 2.17* 2.66** 2.86**
(0.000) (0.036) (0.998) (0.156) (0.014) (0.024) (0.030) (0.008) (0.004)
relative anti-self dealing -2.24* Ownership dummy -1.02 -0.00 -1.39 -1.41 -0.01 -0.01 -1.33 -1.18
(0.025) (0.309) (0.998) (0.164) (0.158) (0.990) (0.988) (0.184) (0.239)
relative anti-director -0.36 High-tech firm dummy -0.65 -0.00 0.15 -0.82 -0.01 0.06 -0.69 -0.07
(0.716) (0.516) (1.000) (0.882) (0.413) (0.993) (0.955) (0.488) (0.946)
relative block preium 3.41** constant -1.72+ -0.01 -1.60 -2.97** -0.70 -2.94** -1.86+ -1.60
(0.001) (0.085) (0.995) (0.109) (0.003) (0.487) (0.003) (0.063) (0.111) turnover velocity -1.88* (0.060) market capitalization/GDP 2.27* (0.023) Wald chi2(48) = 97.55 Log likelihood = -190.40549 Prob > chi2 = 0.0000 + if p<0.1 * if p<0.05, ** if P<0.01, and *** if P<0.001 Number of cases = 252
Crosslisting location determinants
Panel B: After Sarbanes-Oxley
Firm-specific determinants by country
country pair variable Firm variable Australia Canada Germany Luxembourg Norway Switzerland UK US
trade to destination 3.84*** Tobin's Q -1.10 3.63*** 1.20 -1.59 1.81+ 0.79 3.77*** 3.83***
(0.000) (0.273) (0.000) (0.228) (0.112) (0.071) (0.431) (0.000) (0.000) geographic distance -3.17** Operating income -4.38*** -3.93*** -1.28 -0.77 -3.81*** -4.17*** -5.21*** -3.64***
(0.001) (0.000) (0.000) (0.201) (0.439) (0.000) (0.000) (0.000) (0.000) cultural distance -5.68*** log(Total assets) -1.52 0.92 -0.14 2.87** -1.01 2.16* 2.48* 4.79***
(0.000) (0.129) (0.357) (0.892) (0.004) (0.314) (0.031) (0.013) (0.000) relative anti-self dealing -3.78*** Ownership dummy -1.22 -2.24* -1.12 -0.33 -0.03 -1.43 -0.51 0.19
(0.000) (0.223) (0.025) (0.261) (0.745) (0.977) (0.153) (0.611) (0.846) relative anti-director -3.97*** High-tech firm dummy 0.44 -0.66 1.12 1.05 -0.02 2.45* 1.17 4.63***
(0.000) (0.661 (0.511) (0.263) (0.295) (0.981) (0.014) (0.244) (0.000) relative block premium 5.52*** constant 0.39 -2.72** -3.72*** -5.57*** -1.21 -4.73*** -0.41 -5.06***
(0.000) (0.698) (0.007) (0.000) (0.000) (0.228) (0.000) (0.681) (0.000) turnover velocity 0.04 (0.971) market capitalization/GDP -1.42 (0.156) Wald chi2(48) = 201.86 Log likelihood = -363.66495 Prob > chi2 = 0.0000 + if p<0.1 * if p<0.05, ** if P<0.01, and *** if P<0.001 Number of cases = 417 Crosslisting location determinants
Table 8 Robustness Check: Origin-Destination Pairwise Analysis
Dependent variable: the number of cross-listing in which the firm is from country i to destination country j / the cross-listing in destination country j
variable Origin-Desination Pairs Weighted by listings
trade to destination -1.04 7.74*** (0.304) (0.000) geographic distance -0.09 0.24 (0.929) (0.808) cultural distance 0.09 -6.18*** (0.926) (0.000)
relative anti-self dealing -3.95*** -2.12*
(0.000) (0.034)
relative anti-director -0.07 35.23***
(0.944) (0.000)
relative block premium 0.06 21.39***
(0.956) (0.000)
turnover velocity -4.30*** -7.91***
(0.000) (0.000)
market capitalization/GDP 3.22** 7.88***
(0.002) (0.000)
no. of foreign firms -0.37 -0.40
(0.714) (0.692) constant 5.37*** -6.37*** (0.000) (0.000) R-squared 0.5109 0.7184 Prob>F 0.0000 0.0000 Number of obs 93 1080 + if p<0.1 * if p<0.05, ** if P<0.01, and *** if P<0.001
Note: Equation (1) and (2) sample consits of every one case per country pair to control concentration on certain destination while equation (3) and (4) uses total case of cross-listing. Industry(SIC 4-digit) and year effects are controlled in this analys