R E S E A R C H B R I E F
Comparison of Digital Cephalometric Tracing by Onyx
Ceph Software versus Manual Method
Reza Shahakbari1, Mohammad Pahlevankashi2, Majid Eshghpour1, Atefe Ataii3
1Department of Oral and Maxillofacial Surgery, Faculty of Dentistry, Mashhad University of Medical Sciences, Mashhad, Iran, 2Department of Endodontics,
Faculty of Dentistry, Mashhad University of Medical Sciences, Mashhad, Iran, 3Department of Periodontology, Faculty of Dentistry, Mashhad University of
Medical Sciences, Mashhad, Iran
Abstract
Background: Cephalometric radiography is a valuable method for diagnosis, treatment design, and also for the study of growth and development of teeth and craniofacial complex. In addition to the above features, Onyx Ceph software has the ability to predict soft and hard tissue changes after jaw surgery and can be useful for orthodontists and
surgeons. Aim: The purpose of this study was to compare the accuracy of linear and
angular measurements between these programs and manual measurements.Materials
and Methods: For this study, 30 cephalograms from 30 different patients of orthodontic
candidates were selected. Initially, cephalometric analysis of printed stereotypes was performed manually and then using Onyx ceph v. 3.6 software. Eight angular measurements (FMA/IMPA/SNA/SNB/PNB/1.NA/1.NB/Y-AXIS) and four linear measurements (Co-Gn, Co-A, E-line lower lip, and LAFH). 10 lateral cephalograms were randomly selected and re-traced (5 cases manually and 5 digitally). Data were analyzed by t-test. Results: Regarding the results of the t-test, it was found that the
measurements of the variables between the two groups were not statistically significant and these differences are significant only for the three variables: FMA, 1-NA, and 1-NB. Furthermore, there was no significant difference between any of the variables in these two different times for both manual and digital tracing methods. Conclusion: In this
study, comparing the manual method and the digital method, there was only a significant difference between the FMA variables and there was no significant difference between
the two periods of initial and recurrent trace. The results of this study showed that the digital tracing with the Onyx Ceph software had a same accuracy in comparison to manual tracing and could be used instead of the traditional methods. Clinical Significance: Due to the fact that digital tracing facilitates the tracing process and does not reduce accuracy, the use of these software could be recommended.
Keywords: Cephalometric measurements, digital tracing, lateral cephalometry, manual tracing, Onyx software
Correspondence
Dr. Atefe Ataii, Department of Periodontology, Faculty of Dentistry, Mashhad University of Medical Sciences, Mashhad, Iran. Tel/Fax: +989153617482. E-mail: [email protected]
Received 18 May 2018 Accepted 10 July 2018
doi: 10.15713/ins.ijcdmr.128
How to cite the article:
Shahakbari R, Pahlevankashi M, Eshghpour M, Ataii A. Comparison of Digital Cephalometric Tracing by Onyx Ceph Software versus Manual Method. Int J Contemp Dent Med Rev, vol.2018,
Article ID: 010718, 2018. doi: 10.15713/ins.ijcdmr.128
Introduction
5 years after the discovery of X-rays in 1900, price introduced radiography as an orthodontic diagnostic tool. From this, cephalometric radiographies of craniometric and anthropometric studies were adopted using the Burundi-Bolton Cephalometry which was designed in 1931.[1]
Cephalometric radiography is a valuable method for diagnosis, treatment design, and the study of the growth and development of teeth and skull.[2] Digital radiography has advantages over
old methods, including reduced radiation dose, immediate radiographic image, darkroom removal and saving time and cost,
storage and easy switching, facilitating consultation with other
professionals, and the ability to improve images to meet specific
needs.[3] These benefits can help in choosing a standard method
for future cephalometric measurements.[4]
Murali and Sukumar conducted a study in 2011 on 80 patients with the aim of evaluating the accuracy of skeletal, dental, and soft tissue parameters in digital radiography using manual and computerized tracing techniques. According to the results of this study, most measurements between two manual
tracing methods and the computer are not different.[5]
performed by hand and digital tracings using Dolphin11.0 software on lateral cephalometrics. There was no statistically
significant difference for any of the variables between manual and digital tracings, and there was no difference between the
manual and the angular variables of both the conventional and
the computerized methods.[6]
A study in 2009 by Gallerano was conducted with the purpose of comparing the detected landmarks between two methods of manual and digital tracing, comparing measurements Software Quick Ceph 2000 with manual methods for variable angles, and comparing the superimposition of software Quick Ceph 2000 by Hand-drawn Tracing, accepted by the American Board of Orthodontics. The results of this study showed
that there is no difference in the detection of cephalometric
landmarks between the manual method and Quick Ceph 2000 software.[7]
The Onyx ceph software was first introduced in Germany. The
computer program has the cutting edge graphic software, which provides an alternative way to run cephalometric tracing without the use of conventional cephalometric radiographs.[8] More than
120 linear and angular measurements used in orthodontics and surgery can be done with this software. The Onyx ceph software, in addition to the capability mentioned, allows archiving of all patient information, such as photographic and radiographic sets, quick access to information, and prediction of soft and hard tissue changes following maxillofacial surgery and can be useful for both orthodontists and surgeons.
The aim of this study was to compare the digital cephalometry with Onyx Ceph software and hand-held cephalometry, which is provided by the private radiology center archive in Mashhad.
Materials and Methods
A total of 30 lateral cephalogram radiographs were selected from the archives of the private radiology center with the following
criteria:
• High-quality radiographs without any artifact which might interrupt with the locating of anatomic landmarks.
• Absence of any craniofacial deformity or asymmetry. • Patient bite must be in maximum intercuspation. • Patient must have all permanent teeth.
• In radiographs which have no interruption with locating anatomic landmarks.
All lateral ceph radiographs were taken under the same circumstances (Frankfort plane parallel to the earth and perpendicular to the sagittal plane) with the same digital device. All radiographs had the same magnification. After choosing
the samples, all manual and digital tracings were done by one operator.
Manual tracing
To do manual tracing, at first, digital images printed on
radiographic films with Fujifilm® FM-PDL printer. The acetate
cellulose paper was attached to each radiograph and tracing
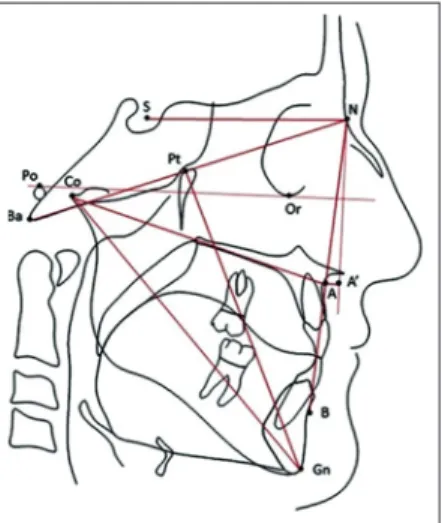
was completed after placing them on a tracing negatoscope in a dark room using HB pencil. Despite the many details that could be traced, only the contours of the following structures
were identified on radiography. A sample of tracing is shown in Figure 1. These structures were included:
• Anterior margin of the frontal bone. • Frontonasal suture.
• Orbit (posterior inferior contour). • Machine pouring.
• Sella turcica.
• Palatal bone (from autonomic nervous system to
parasympathetic nervous system).
• Anterior contour of the maxilla. • Posterior border of the mandibles ramus. • Inferior border of the mandible.
• Anterior and posterior contour of the symphysis.
• Upper and lower central incisors which had the most
protrusion.
Next, anatomical landmarks include machine pouring, Gn،Go،Me،Or،ANS،PNS،S،N،A،B،Co،Li, labial prominence of the central maxilla and mandible, and soft tissue Pog. The most prominent point of the nose was determined on any radiograph. After completing the tracing, lines and angles were drawn and linear measurements were made using ruler and angular measurements using the conveyor.
Digital tracing
Digital images are stored in JPEG quality format after being converted by Onyx Ceph V. 3.6 software. 19-inch LCD and a resolution of 1360 × 1018 pixels were used to view the image. Furthermore, if needed, software features such as
brightness, contrast, and magnification were used to make
landmarks more accurate. After radiographic selection and
before landmark identification, the starting point and end of
the ruler (30 mm) for each radiograph were determined to measure the calibrations based on the actual size of the images.
After specifying the landmarks, the software performed all
measurements based on the predefined analysis, and after
completing the data trending, the data were moved to Excel using the Export analysis item.
Measurement
Eight angular measurements (1.NA, 1.NB, SNA, SNB, ANB, IMPA, FMA, and Y-axis) and four linear measurements (Co-Gn, Co-A, E-line lower lip, and LAFH). Furthermore, 10 radiographs (5 samples for manual method and 5 samples for digital method) were selected randomly, and 20 days after the initial tracing, again by the same operator, to determine the other operator error in tracing, and the ability to repeat the measurements.
Statistical analysis
t-test was used to compare the measurements by manual and
digital methods. Furthermore, measurements were performed again and compared with the initial measurements in both manual and digital methods by the paired t-test.
Results
Comparison between manual and digital variables, as well as data on primary and re-tracing (manual and digital), was performed using independent t-test.
Regarding the results of the t-test, it was found that the
measurements of the variables between the two groups were not
statistically significant and these differences are significant only for the three variables: FMA, 1-NA, and 1-NB. The results are
shown in Table 1.
Comparison of initial and second manual tracing
20 days after the initial tracing, five radiographs were selected
randomly and again traced manually. Data related to these measurements as well as the statistical comparison results are presented in the following table. The results of the paired
t-test indicated that there were no significant differences in the
measurements of any of the variables in the initial and second tracing with manual and digital methods. Results are shown in Table 2.
Compare initial and second digital tracing
After completing initial tracing with digital method, five lateral
cephalograms were randomly selected, and 20 days later, they were again traced with the same method. Measurement data were compared using the paired t-test, which showed the results
of this comparison. There was no significant difference between any of the variables in these two different times. Results are
shown in Table 3.
Landmark diagnosis on digital images can be affected by
various factors such as contrast, spatial resolution of the monitor, background luminescence, luminescence system, screen size, extra light in the room, and use of magnifying tools.[9]
Manual measurements can also be affected by errors in drawing
lines between landmarks and inaccurate reading of sizes on the ruler and conveyor, so it is better to examine a series of structural relationships with multiple cephalometric parameters instead of a single parameter. Therefore, in our study, 13 variables including all three dental, skeletal, and soft tissue variables were studied. These variables were the most commonly used variables in orthodontic diagnosis and treatment plan and treatment outcomes.
In our study, when we examine the results of linear and angular measurements performed with manual and digital tracing, it is determined that the measured values for most variables are close to the mean and standard deviation, which are in relevance with
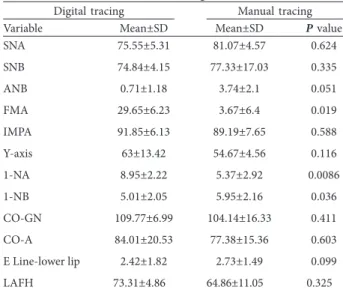
Table 1: Comparison between the values of linear and angular variables obtained from manual and digital methods
Digital tracing Manual tracing
Variable Mean±SD Mean±SD P value
SNA 75.55±5.31 81.07±4.57 0.624
SNB 74.84±4.15 77.33±17.03 0.335
ANB 0.71±1.18 3.74±2.1 0.051
FMA 29.65±6.23 3.67±6.4 0.019
IMPA 91.85±6.13 89.19±7.65 0.588
Y-axis 63±13.42 54.67±4.56 0.116
1-NA 8.95±2.22 5.37±2.92 0.0086
1-NB 5.01±2.05 5.95±2.16 0.036
CO-GN 109.77±6.99 104.14±16.33 0.411
CO-A 84.01±20.53 77.38±15.36 0.603
E Line-lower lip 2.42±1.82 2.73±1.49 0.099
LAFH 73.31±4.86 64.86±11.05 0.325
SD: Standard deviation
Table 2: Comparison between values of linear and angular variables obtained from manual method at T1 and T2 times
Variable Mean±SD P value
Initial
tracing (T1) tracing (T2)Second
SNA 76.72±3.58 74.38±4.25 0.225
SNB 74.82±3.31 74.76±3.17 0.231
ANB 2.43±2.44 1.26±1.05 0.231
FMA 30.22±5.08 29.08±6.31 0.463
IMPA 90.98±7.78 92.72±7.98 0.246
Y-axis 63.84±2.42 62.16±4.82 0.345
1-NA 8.61±4.12 9.3±4.53 0.617
1-NB 5.6±2.49 4.4±1.53 0.247
Co-Gn 112.08±29.48 107.46±5.22 0.417
Co-A 90.85±28.9 77.18±30.33 0.382
E line-lower lip 2.66±1.76 2.18±1.78 0.183
LAFH 75.07±20.93 71.56±14.04 0.777
the non-significant P value obtained for the most of the paired comparisons.
These findings are similar to those of the Chen et al. study,[10]
correia,[11] and vasconcelos,[12] while the study of some of the
other authors[13,14] shows significant statistical differences in data. In our study, the difference between manual and digital tracing was only significant for three variables such as FMA (P = 0.019), 1-NA (P = 0.0086), and 1-NB (P = 0.036).
The FMA is the angle obtained from the Frankfurt and mandibular plane; Frankfurt plane is the connecting line between the two Gn and Go landmarks, which is less reliable due to the presence of both landmarks on curved
anatomical boundaries. Chen et al.[15] also stated in their
study that landmark Gn has less ability than other landmarks in cephalometric measurements. Other researchers in their studies also showed significant differences in measurements including maxillary incisor, mandibular incisors, and both.[16,17]
Brangeli et al.[18] and Martins et al.[19] also argued in their study that dental structures are difficult to identify, and
measurements related to such structures, both in digital and in manual methods, are less reliable. Comparison of linear values to the results obtained in manual and digital tracing showed
that there were no significant statistical differences. In linear
measurements, the lowest P value was related to the E-line lower
lip (P = 0.099), which was also compared in the study of Mann
and Hunt.[5] The results of our study show that digital tracing has a significant difference in most measurements with manual
tracing. Hence, it can be used safely. Almedia[20] and Chen
et al.[10] described the computer method as a reliable method.
Forsyth et al.[21] stated that errors in detecting points, angles, and
linear measurements occur more in digital radiography than in conventional radiographs.
Conclusion
In this study, comparing the manual method and the digital
method, there was only a significant difference between the FMA variables and there was no significant difference between the two
periods of initial and recurrent trace. The results of this study showed that the digital tracing with the Onyx Ceph software had a same accuracy in comparison to manual tracing and could be used instead of the traditional methods. Due to the fact that digital tracing facilitates the tracing process and does not reduce accuracy, the use of these software could be recommended.
References
1. Broadbent BH. A new x-ray technique and its application to orthodontia. Angle Orthodontist 1931;1:45-66.
2. Shahidi S, Oshagh M, Gozin F, Salehi P, Danaei S. Accuracy of computerized automatic identification of cephalometric landmarks by a designed software. Dentomaxillofac Radiol 2013;42:20110187.
3. Mol A, Yoon D. Guide to digital radiographic imaging. J Cal Dent Assoc 2015;43:503-11.
4. Jacobson A, Jacobson RL, Rushton V. Radiographic Cephalometry: From Basics to 3-D Imaging, (Book/CD-ROM set). Hanover Park, IL: Quintessence Publishing; 2007.
5. Mann RW, Hunt DR. Photographic Regional Atlas of Bone Disease: A Guide to Pathologic and Normal Variation in the Human Skeleton. Springfield, IL: Charles C Thomas Publisher; 2013.
6. Adra NA, Barakat N, Melhem RE. Salivary gland inclusions in the mandible: Stafne’s idiopathic bone cavity. Am J Roentgenol 1980;134:1082-3.
7. Fordyce G. The probable nature of so-called latent haemorrhagic cysts of the mandible. Br Dent J 1956;101:40-2.
8. Downs WB. Variations in facial relationships: Their significance in treatment and prognosis. Am J Orthod 1948;34:812-40. 9. Durão AR, Pittayapat P, Rockenbach MI, Olszewski R, Ng S,
Ferreira AP, et al. Validity of 2D lateral cephalometry in orthodontics: A systematic review. Prog Orthod 2013;14:31. 10. Chen YJ, Chen SK, Yao JC, Chang HF. The effects of differences
in landmark identification on the cephalometric measurements in traditional versus digitized cephalometry. Angle Orthod 2004;74:155-61.
11. Quintão AP, Vitral RW. Estudo comparativo entre cefalometria manual e computadorizada (análise de Steiner, Tweed e Downs) em telerradiografias laterais. HU Rev 2010;36:95-9.
12. Vasconcelos MH, Janson G, de Freitas MR, Henriques JF. Avaliação de um programa de traçado cefalométrico evaluation of a cephalometric software. Rev Dent Press Ortod Ortop Facial 2006;11:44-54.
13. Rosenberg G. Brain edema and disorders of cerebrospinal fluid circulation. Bradley’s Neurology in Clinical Practice. 6th ed. Philadelphia, PA: Saunders Elsevier; 2012.
14. Tweed CH. The Frankfort-mandibular incisor angle (FMIA) in orthodontic diagnosis, treatment planning and prognosis. Angle Orthod 1954;24:121-69.
15. Chen SK, Chen YJ, Yao CC, Chang HF. Enhanced speed and precision of measurement in a computer-assisted digital cephalometric analysis system. Angle Orthod 2004;74:501-7.
Table 3: Comparison between linear and angular values obtained from the digital method at T1 and T2 times
Variable Mean±SD P value
Initial
tracing (T1) tracing (T2)Second
SNA 81.7±5.23 80.44±5.47 0.655
SNB 77.67±5.81 77±4.65 0.81
ANB 4.02±1.29 3.32±2.18 0.289
FMA 33.2±8.7 32.3±8.49 0.883
IMPA 88.56±7.3 89.82±6.03 0.797
Y-axis 46.7±6.07 62.64±6.9 0.657
1-NA 5.11±1.98 5.64±2.91 0.746
1-NB 6.24±2.22 5.66±1.51 0.678
Co-Gn 104.5±8.16 103.78±8.37 0.91
Co-A 77.74±6.11 77.02±7.02 0.897
E line-lower lip 2.63±2.78 2.84±2.9 0.889
LAFH 64.97±9.28 64.76±9.36 0.97
16. Paixão MB, Sobral MC, Vogel CJ, Araujo TM. Comparative study between manual and digital cephalometric tracing using dolphin imaging software with lateral radiographs. Dent Press J Orthod 2010;15:123-30.
17. Shah AR, Karandikar G, Ravindranath V, Sonawane M, Mhatre A. A comparative study of reliability and accuracy of manual and digital lateral cephalometric tracing. J Contemp Dent 2016;6:15-8.
18. Brangeli LA, Henriques JF, Vasconcelos MH, Janson G. Estudo comparativo da análise cefalométrica pelo método manual e computadorizado. Rev Assoc Paul Cir Dent 2000;54:234-41.
19. Martins LP, Pinto AD, Martins JC, Mendes AJ. Erro de reprodutibilidade das medidas cefalométricas das análises de steiner e de Ricketts, pelo método convencional e pelo método computadorizado. Ortodontia 1995;28:4-17.
20. Albuquerque HR Jr. Avaliação do erro de reprodutibilidade dos valores cefalométricos aplicados na filosofia Tweed-Merrifield, pelos métodos computadorizado e convencional. Ortodontia 1996;66:43-50.
21. Forsyth D, Shaw W, Richmond S. Digital imaging of cephalometric radiography, part 1: Advantages and limitations of digital imaging. Angle Orthod 1996;66:37-42.