Western Australian Auditor General s Report. Follow-On: Managing Student Attendance in Western Australian Public Schools
Full text
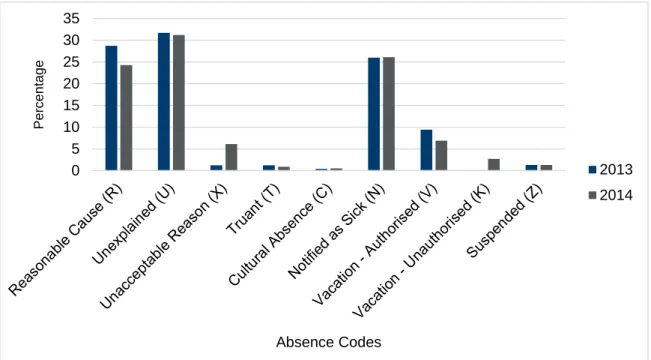
Figure


Related documents
The spreadsheet shows how an incremental increase in the hourly rate of production (Row 2) affects the cost of production (Row 29).. A 50% increase in the hourly production rate
(a) Ion release (Mo/Cr/Co) from a simulator test on the bearing surface at 330,000, 666,000 and 1 million cycles (b) proportion of ions released from the surface
Now a disequilibrium model of a league with win-maximising teams operating under a soft budget constraint in a segmented labour market describe s by the same token
We augment the standard DQN with several distinct sets of outputs; concretely we use the same architecture as the boot- strapped DQN [Osband et al., 2016]. Whereas Osband et
[r]
We address these limitations in the current study by extending our analysis of the effects of provider participation in CACFP on the full sample of children participating in
Electricity capital projects Divisional energy managers Infrastructure projects savings Store change savings Gas savings Water savings Additional challenge Consultancy costs
These indicators provide clear and usable information, easily shared with the general management or any other management likely to use this data to monitor the human development
