Using Dynamic Feedback to Optimise Load Balancing Decisions
Jeremy Kerr
[email protected]
Abstract
The goal of a network load balancer is to distribute a workload evenly amongst a cluster of back-end servers. At present there are a number of standard request allo-cation schemes to distribute requests but none of these can guarantee an even load distribution.
In order to improve the request allocation decisions made, I present an implementation of a dynamic feed-back system as an extension for an existing open source load balancing package, Linux Virtual Server.
The feedback system reports server load to the load balancer and updates the load balancer’s server weight-ing tables to compensate for uneven server loads; the goal of the feedback process is to restore the server nodes to an equalised state. In order to test the ef-fectiveness of the dynamic feedback system, a simula-tion cluster was established and benchmarked in vari-ous configurations, with and without dynamic feedback in place. To simulate an unbalanced server load, one of the servers was given an additional CPU-intensive task to run.
The results of the experimentation show that the feed-back system does optimise the request allocation; CPU load of the servers is brought back to an even distribu-tion with the dynamic feedback process running.
1
Introduction
The Linux Virtual Server (LVS) project is an open source extension to the Linux kernel that provides net-work load balancing functionality [8,9]. To provide a load balanced network service, a computer with a Linux kernel modified with the LVS software (a ‘director’) can be used to divide the provision of a network service amongst a cluster of backend servers. LVS operates at layers 3 and 4 of the TCP/IP stack, so can load balance
most IP-based services without regard for the applica-tion protocol.
When a the first SYN packet for a new connection is received by the director, the director must make a deci-sion on which server node to allocate the new connec-tion to, then forward the connecconnec-tion’s packets to that node. To make these decisions, a request allocation al-gorithm is used – because the backend servers operate more reliably at lower loads, the ultimate goal of a re-quest allocation algorithm is to maintain the servers at the lowest load possible; this requires the load to be dis-tributed evenly amongst all of the servers. The LVS software has a number of request allocation schemes available:
Round Robin New connections are allocated to the
node that has least-recently been used. Round robin is the simplest of the allocation schemes, but assumes that each request will represent a constant amount of work – this is not always the case.
Least Connection Sharing New connections are
allo-cated to the server with the least number of open connections. This way, servers that are busy han-dling requests can be allocated less of a load. This scheme is useful when the duration of the connec-tion represents its cost – FTP for example.
Source/Destination Hashing A hash of the addresses
within the packet’s headers is used to determine the server to use – this allows allocations to be made with a simple constant-complexity function, and the connections do not have to be tracked by the director. Unfortunately, the address space of the incoming packets does not always give an even distribution and does not reflect the load on the servers.
Additionally, some protocols require persistency with successive connections – for example, when a se-cure HTTP (HTTPS) session is started, encryption keys
are generated for the session. Because key generation is a computationally expensive task, the keys are kept by the client and server and used in subsequent con-nections between the client and server pair. If the di-rector allocates a new connection from the same client to a different server, the keys will need to be regener-ated. LVS can be configured to allocate new connec-tions from an existing session to the same server to en-able persistency.
A request for a network service does not always rep-resent a fixed amount of work. For example, an HTTP request may either be for a static HTML page, which is relatively inexpensive to serve, or a complex dynami-cally generated page which is much more computation-ally expensive. Therefore we cannot guarantee that the servers will be evenly loaded by evenly distributing the requests.
This paper is an investigation into the use of dynamic feedback in request allocation – where the ‘health’ of each server is reported to the director so that it can be used to improve allocation decisions. Dynamic feed-back has been implemented in a client/server program that inputs the load information into the weighting ta-bles for LVS software.
2
Implementation
2.1
Design Considerations
During the design of the feedback software, the follow-ing properties were established as desirable:
Modular Interface to Load Measurement The
met-ric used to calculate server load should be easily changeable, preferably without having to recom-pile the program. This allows the load measure-ment to be better suited to each application. If the load metric is generated from parameters that are likely to affect the performance of the network ser-vice, then the load data sent to the director would be more applicable to the load balancing allocation decisions.
Use of an Established Protocol An established
proto-col should be used to communicate load data to allow the program to interoperate with other prod-ucts.
Minimal Resource Usage The purpose of the
feed-back system is to improve the performance of a server cluster, so resource usage (particularly memory usage and CPU load) must be kept at a minimum for it to be useful.
2.2
The Network Element Control
Proto-col
In order to address the second requirement of the feed-back system, two dynamic feedfeed-back protocols were found and investigated – Cisco’s Dynamic Feedback Protocol (DFP) [2] and the Network Element Control Protocol (NECP) [1]. There are no specification doc-uments available for DFP, as it appears to be a closed protocol – this was the main reason for the decision to implement NECP. Fortunately, NECP suits the require-ments for this application well.
NECP was first published in September 2000, as an Internet Draft. NECP provides a method of transferring load data between the Network Element (the director) and the Server Elements (the servers within the cluster). NECP is an open protocol, and software based on it can be released under any license [3].
NECP is TCP-based, where the director acts as the NECP server, accepting incoming connections estab-lished by NECP clients running on server nodes. A typ-ical NECP session is structured as follows:
• The NECP process on the director is started, and listens for incoming connections on TCP port 3262.
• NECP processes are started on the server nodes, which then attempt to connect to the director pro-cess.
• When a connection is established anINITmessage is sent to the director to establish the parameters of the session. The director then replies with anINIT ACKmessage.
• Once the server node is ready to process requests, it sends aSTARTpacket. This packet includes the details (IP sub-protocol, TCP/UDP port and for-warding method) of the services that the server is able to provide. The director replies with aSTART ACKmessage.
• The director then sends periodicKEEPALIVE mes-sages to the server, which is a request for the state of the node. The server replies with aKEEPALIVE ACK, including a number representing the current state of the server. This number can vary from 0 to 100 – 0 signifying that this node is unable to pro-cess further requests, 100 signifying that the server is in perfect health.
• When a server is to be removed from the cluster it sends aSTOPpacket to inform the director. The director then replies with aSTOP ACK.
• The TCP connection is closed by the server. If a reply is not received from a three successive
KEEPALIVErequests within a specified timeout, the di-rector considers the server unavailable and removes it from the server cluster. This allows transparent removal of failed server nodes, increasing service reliability.
To address security concerns, the NECP protocol al-lows packets to be authenticated by both the servers and director. Authenticated messages are appended with a 20-bit hash of the packet, encoded with a shared cre-dential. During an authenticated NECP session, only packets with a valid hash are accepted. This encoded hashing system prevents malicious entities from alter-ing the behavior of the NECP server and clients, as the hash cannot be generated correctly without the creden-tial. When an authenticated NECP session is in use, monotonically increasing sequence numbers are used in each packet to prevent packet replay attacks. If a NECP packet is received with a valid hash but an incorrect se-quence number, the packet is discarded.
NECP also supportsEXCEPTION operations, which enables a server node to request that packets with a spe-cific source or destination address not be allocated to it. Because LVS does not currently support this fine-grained control, handling EXCEPTION messages was not necessary for this project.
At present, there are no known hardware or software implementations of NECP [3]; a search for the string “NECP” on the Internet reveals only the protocol spec-ification.
2.3
Implementation of feedbackd
The implementation of dynamic feedback was named feedbackd, in line with other add-ons available to the
LVS system – keepalived and ldirectord.
During the development of the feedback system, it became apparent that the terms ‘NECP Server’ and ‘NECP Client’ could cause confusion when referring to the two parts of feedbackd, as the ‘NECP Server’ pro-cess actually runs on the director and not the servers. To prevent confusion, the NECP Client (which runs on the servers) is called an ‘agent’ and the NECP Server (which runs on the director) is called a ‘master’. Table
1 summarises the names used for the feedbackd pro-cesses.
Process Role Cluster Node
Master NECP Server Director Agent NECP Client Servers
Table 1: Nomenclature of the feedbackd components
NECP was written in C to improve performance and stability in high load environments.
2.4
Master Process
The master process is responsible for querying the agents for server load status information, collating the information and altering the load balancing decision ta-bles accordingly. Figure1 shows the structure of the master process.
The master process keeps two main tables - an array of servers, and an array of services provided by those servers. These are initialised to empty when the master is started.
When a connection is established with an agent, a server entry is added for that server address and the NECP initialisation is performed to establish parame-ters used for the subsequent NECP session. These pa-rameters are also stored in the server array.
When a NECPSTARTpacket is received by the mas-ter, an entry is added to the services table. Once the master is aware of this service it schedules a
KEEPALIVEmessage for some time in the future. The scheduler is based on an ordered linked list; whenever a new event is scheduled, it is inserted into the list after the last event scheduled for an earlier time. When the task at the head of the list is due for execution the scheduler is invoked and the task is processed. Tasks
Server-side protocol functions
Scheduler
Interface to kernel LVS code TCP Port
3262
Standard NECP definitions
LVS server tables
User-space Kernel
Figure 1: Structure of the feedbackd master process
may be of two types - sending aKEEPALIVEmessage to a server, or aKEEPALIVEtimeout event.
When anyKEEPALIVEmessage is sent, aKEEPALIVE
timeout event is scheduled. Raising aKEEPALIVE time-out event signifies that the master has not received a reply to the last KEEPALIVE message sent to a server within a preset timeout period – these timeout messages are removed from the task list if the reply is received before the event is raised. If a timeout event is raised, anotherKEEPALIVEpacket is sent to the server, and a counter incremented. If this counter reaches three (as recommended in the NECP specification), the server is considered failed and removed from the load balancing tables.
When a response is received to a KEEPALIVE mes-sage the health index is retrieved from the response packet and processed to generate a weighting to be in-serted into the LVS server tables. The health data from the server ranges from 0 to 100, where 100 signifies
that the server is in perfect health, and 0 signifies that the server is unable to process requests.
Initially, the server health values were used directly in the load balancing tables – early testing showed an overreaction to loaded servers – the weights would cy-cle between 1 and 100, as the servers alternated be-tween full load and no load. To overcome this, the health values received from the agents are smoothed us-ing a weighted-average function shown in Equation1. This smoothing is performed to prevent sudden large changes in the server weight values that result in an un-stable cluster.
weightt = α×max(1,health) + (1)
((1−α)×weightt−1)
where 0≤α≤1
In order to interact with the load balancing software, the master process uses a library provided with the LVS software, libipvs. This module provides a set of func-tions to establish a connection with the kernel-level load balancing objects and manipulate the server tables.
2.5
Agent Process
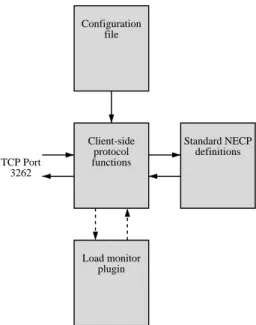
The agent’s task is to monitor the load of the server and send it to the master process when requested. Figure2
shows the structure of the agent process.
When the agent is started, it reads a configuration file (/etc/necp.conf) to obtain parameters for the NECP ses-sion. This configuration file contains the following data:
• The address of the director node running the mas-ter process; and
• An entry for each service the machine can provide:
– A name for the service (eg. HTTP)
– The IP sub-protocol that the service uses
(TCP or UDP)
– The port on which the service operates – The plugin to use to measure system load for
that service
– The routing method used to forward packets
Client-side protocol functions
Standard NECP definitions
Load monitor plugin TCP Port
3262
Configuration file
Figure 2: Structure of the feedbackd agent process
The agent then contacts the specified server and ini-tiates an NECP session. As soon as the session has begun, the agent notifies the master which services are available on this node by sending an NECPSTART mes-sage, which describes each available service.
The agent waits for KEEPALIVE packets from the master; when one is received, the agent queries the load by using the plugin specified for each service and re-turns the load value in aKEEPALIVE ACKpacket. After the acknowledgment packet is sent to the master, the agent waits for anotherKEEPALIVEpacket.
When the agent is sent a SIGINT signal, it sends a
STOPmessage to the master and terminates. This shut-down procedure notifies the master that the server node is to be removed from the cluster.
3
Performance Analysis
Once the feedback system had been implemented, it was tested to determine its behaviour in a load balanc-ing environment and to ascertain whether the use of dy-namic feedback is beneficial. To do this, a simulation cluster was built and the request handling performance measured with and without feedbackd in place.
The benchmarking process was similar to that used by O’Rourke and Keefe in their performance evaluation of Linux Virtual Server [7].
3.1
Benchmarking Environment
Benchmarking was conducted in an undergraduate computer laboratory in the School of Computer Science at The University of Western Australia, using a single network of identical machines. Table2shows the spec-ifications of the computers used for testing. The soft-ware on each machine was based on a minimal install of Red Hat Linux 7.2, including only packages neces-sary for testing. Although the compiler and linker were not used during tests, these programs were used to build all the software used on the cluster. The same kernel was used on the client and server nodes, compiled from the standard Linux 2.4.18 source, configured with only necessary functionality.
Item Specification
Hardware
CPU Pentium Celeron 700MHz CPU Cache 128 KB
Memory 256 MB
Network Interface Intel Ethernet Pro 100Mbps Software
Operating System Linux Kernel 2.4.18 Distribution Red Hat Linux 7.2 C compiler gcc 2.96
Linker GNUld 2.11.93 C Libraries glibc 2.2.5
Table 2: Specification of cluster nodes. On startup, each of the nodes was configured to allow a higher number of file descriptors per pro-cess and the network read and write buffers were increased in size. The size of the IP connection tracking table was also increased. Details of the changes made to facilitate benchmarking are avail-able fromhttp://www.redfishsoftware.com.au/ projects/benchmarking/.
A total of 21 computers were used for testing – 4 servers, 1 director and 16 clients. Each of the nodes was configured depending on its role in the testing process as follows:
3.1.1 Server Nodes
The servers were running version 1.3.23 of the Apache HTTP server. Apache was chosen because it is the most widely used web server software on the Internet; ac-cording to the Netcraft web server survey, 59.9% of web servers are based on Apache, the next-most popular server software being Microsoft’s IIS with 28.9% mar-ket share [6]. The Apache daemon was configured for high loads according to Gaudet’s performance notes [4]. Each server was configured to serve a small HTML file – the size was chosen such that the entire HTTP response could be transferred in a single 1500 byte Eth-ernet frame so that network load does not become a per-formance bottleneck.
3.1.2 Director Node
A separate kernel was built for the director, based on the Linux 2.4.18 source with the ipvs 1.0.2 patch applied, plus a minor patch to enable regular statistics logging. As with the kernel built for other nodes, all unnecessary functionality was removed from the kernel configura-tion.
For the tests, the director was configured to use LVS’s ‘direct routing’ forwarding method, which only requires request packets to be processed by the director, while response packets are sent directly from server to client. Direct routing was used to reduce the load on the director during tests and ensure that the director is not the performance limiting factor.
3.1.3 Client Nodes
Httperf version 0.8 was installed on each client node, modified as described by O’Rourke and Keefe to in-crease the request rate generated [7,5]. The parameters used for all invocations of httperf were:
httperf --hog --server 10.0.0.1 --port 80 --uri index.html -t 8
The timeout figure of 8 seconds will classify any re-sponse that does not arrive within 8 seconds to be an error. Other options such as the connection rate and number of connections were altered for each test.
3.1.4 Network
All benchmarking nodes were placed on one 100Mbps Ethernet network. The IP addresses given to the clus-ter nodes was split into two ranges - 192.168.0.2 to .5 for the servers, and 10.0.0.2 to .18 for the clients. The director node was given the address 192.168.0.1 for the server network, plus the virtual IP address 10.0.0.1. During testing the network was isolated so that external traffic could not influence the benchmark results.
3.2
Testing Process
Each test applies a certain request rate to the cluster, measured in requests per second. Given a certain re-quest rate, the server cluster generates a set of responses at the response rate – which may be equal to or less than the request rate. If the response rate is less than the re-quest rate, we can assume that at least one of the servers in the cluster is at its maximum request-handling capac-ity.
A benchmark involved a set of separate tests – start-ing at a low request rate and increasstart-ing by 320 request per second (20 per client) to establish the maximum re-sponse rate from each benchmarking configuration.
Three benchmarks were conducted to analyse the be-haviour of feedbackd. Initially, the cluster was tested without feedbackd running to obtain a maximum ‘re-sponse per second’ performance figure of the cluster.
To simulate an unevenly loaded cluster, one of the four servers’ HTML pages was replaced with a simple CGI script. As the CGI script is more computation-ally expensive to serve, this simulates a situation where one server is being allocated a disproportionately large amount of expensive requests. This configuration was then retested to determine the effect of an unbalanced load.
For the final benchmark, feedbackd was added to the unbalanced cluster configuration to ascertain whether or not the presence of the dynamic feedback daemon can re-balance the cluster load and improve performance to original levels.
4
Results
4.1
Cluster Performance
Firstly, the cluster was benchmarked to give a baseline performance figure. A request load was applied, start-ing at 320 requests per second (rps) and increasstart-ing at 320 rps per test up to a maximum of 4160 rps. Figure3
gives the response rate performance of these tests.
0 500 1000 1500 2000 2500 3000
0 500 1000 1500 2000 2500 3000 3500 4000 4500 0 2 4 6 8
Responses per Second
Errors (%)
Requests per Second Response and Error Rates Under Request Load
Responses per Second
Errors
Figure 3: Response performance and error rates of the evenly loaded cluster.
The evenly loaded cluster responds linearly to an in-crease in request load up to 2880 rps, after which the servers become fully loaded and response rate drops. Error rates remain low up to and including the same point of 2880 rps – higher loads cause a dramatic in-crease of errors.
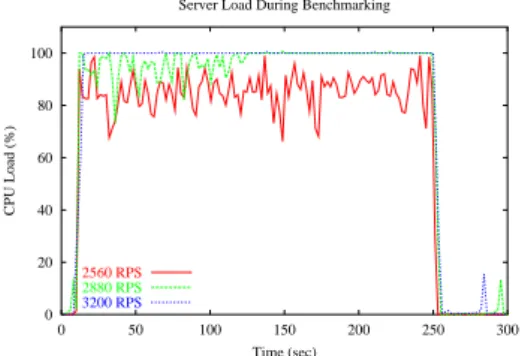
We can logically conclude that the load on the servers reaches 100% at 2880 requests per second – to investi-gate this, Figure4shows the CPU usage during the tests below, at and above the 2880 request per second load.
0 20 40 60 80 100
0 50 100 150 200 250 300
CPU Load (%)
Time (sec) Server Load During Benchmarking
2560 RPS
2880 RPS
3200 RPS
Figure 4: CPU usage during tests of varying request loads.
The server load of the test conducted at 2560 rps re-mains under 100%, while the server load of the 2880 rps test reaches 100% in the later parts of the test – this accounts for the slight increase in error rate at 2880 rps. The 3200 rps test shows an almost consistent server load of 100%. This suggests that the limit on response rates is due to the CPU usage on the servers.
4.2
Unbalancing the Cluster
To unbalance the server loads, one of the servers’ HTML pages was replaced with a small CGI script, which is more expensive to serve. Figure5shows the performance of the cluster with this modification.
0 500 1000 1500 2000 2500 3000
0 500 1000 1500 2000 2500 3000 3500 4000 4500 0 2 4 6 8
Responses per Second
Errors (%)
Requests per Second Response and Error Rates Under Request Load
Responses per Second
Errors
Figure 5: Response performance and error rates of the unevenly loaded cluster.
With this CGI script, we see a much higher error rate from lower loads – this is becasue the CPU load of the server with the CGI script reaches 100% much earlier than the other servers. The error rate levels off until the 2880 rps load, after which the other servers be-come fully loaded and start adding to the error rate. The shape of the response rate curve is similar to that of the evenly loaded cluster but with a slightly less-than-linear response to increasing request rates and a lower maxi-mum. Again, this is attributed to the high load on the one server.
Figure6shows the CPU load of servers during a sin-gle test at a low request rate of 640 rps – this illustrates the higher load due to the CGI script. The difference in CPU usage between the two servers ranges from around 50% to 80%. Clearly the servers with the HTML pages are being underutilised while the CGI-based server is under high load.
0 20 40 60 80 100
0 50 100 150 200 250 300
CPU Load (%)
Time (sec) Server Load During Benchmarking
HTML Page
CGI Page
Figure 6: CPU usage during testing of the unevenly loaded cluster with a 640 rps request load.
4.3
Deploying Feedbackd
For the next set of tests the feedbackd system was run on the unbalanced cluster to attempt to restore the load distribution to a balanced state. Figure7shows the re-sults of the benchmark.
0 500 1000 1500 2000 2500 3000
0 500 1000 1500 2000 2500 3000 3500 4000 45000 2 4 6 8
Responses per Second
Errors (%)
Requests per Second Response and Error Rates Under Request Load
Responses per Second
Errors
Figure 7: Response performance and error rates of the unevenly loaded cluster with feedbackd running.
The response rate plot with feedbackd enabled shows that the linear performance response is restored at lower loads, indicating that the system is successfully redis-tributing load away from the server with the CGI script. With feedbackd in place, we also see the error rates de-creased – Section 4.4provides a comparison of error rates and performance figures directly.
Figure 8 shows the CPU usage during the test at 640 rps. The load applied in this test is identical to that shown in Figure6– the CPU usage of the server with the CGI page is much closer to that of the other servers; the feedback daemon is indeed directing load away from the loaded server. Compared to the 50—
0 20 40 60 80 100
0 50 100 150 200 250 300
CPU Load (%)
Time (sec) Server Load During Benchmarking
HTML Page
CGI Page
Figure 8: CPU usage during testing of the unevenly loaded cluster with a 640 rps request load, with feed-backd running.
80% load difference shown by Figure6, we see a much smaller difference of 25—35%. Reducing this differ-ence further is an area of future improvement for the feedback system.
4.4
Performance Comparison
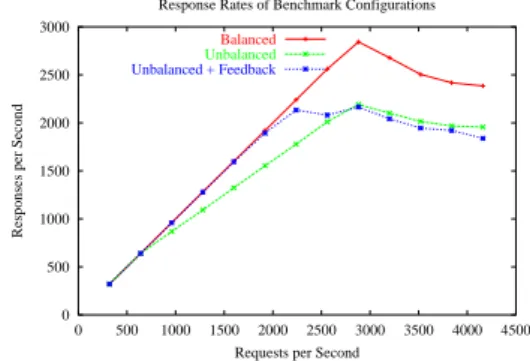
Figure 9 shows the response rate plots of all three benchmarks – the initial baseline test, the unevenly loaded cluster and the unevenly loaded cluster with feedback.
0 500 1000 1500 2000 2500 3000
0 500 1000 1500 2000 2500 3000 3500 4000 4500
Responses per Second
Requests per Second Response Rates of Benchmark Configurations
Balanced
Unbalanced
Unbalanced + Feedback
Figure 9: Response rate performance of the three clus-ter configurations.
The presence of the feedback system gives an im-provement in response rates at lower loads. At higher loads however, the feedback system is unable to main-tain balance, and the request rate drops to slightly be-low that of the cluster without feedbackd running. The slight performance degradation in the feedbackd plot
can be attributed to the presence of an extra process (the feedbackd agent) running on the servers.
Figure10shows the error rates from the same three benchmarks.
0 1 2 3 4 5 6 7 8
0 500 1000 1500 2000 2500 3000 3500 4000 4500
Errors (%)
Requests per Second Error Rates of Benchmark Configurations
Balanced
Unbalanced
Unbalanced + Feedback
Figure 10: Error rates of the three cluster configura-tions.
We see a marked improvement in the error rates with the addition of feedbackd – due to the reduction in load on the server with the CGI script.
5
Conclusion
The results presented here show a definite improvement in the cluster’s performance with the addition of the feedbackd system in both response rates and error rates. The performance increase is only present at lower loads; however, a production environment would typically be operating within a reasonable load bracket to ensure sta-bility and reliasta-bility. In this situation the use of feed-backd (or any other dynamic feedback system) would be beneficial.
Based on the cluster configuration used in these tests, if we were aiming to provide a service with a 99.5% sucessful response rate (ie, 99.5% of the responses are correct and arrive within 8 seconds), the addition of feedbackd allows us to operate at loads 2.3 times greater than that of a system without feedbackd.
5.1
Further Work
Although the feedback system gives an increase in clus-ter performance and reliability, I believe this could be
improved further by adjustment of both the measure-ment metric and smoothing function.
Throughout this test, the definition of server load has been restricted to solely CPU usage. In this case the ser-vice provision task has been purely CPU-based, with lit-tle dependence on other system resources, such as disk access. Because of this, load measurement plugin used to report ‘server health’ only measures CPU usage. The performance of a production server cluster would be de-pendent on more than just CPU usage; other plugins could be developed to monitor these aspects of server load.
The CPU-usage plot shown by Figure 8 indicates that there is still a difference between the load of the server nodes – this could be reduced by the use of an alternative smoothing or load-distribution function in the master process. Perhaps a logarithmic scale of weights could be developed to move request allocation away from busy servers more effectively. Once an equal server loading is achieved, we can expect to see a fur-ther increase in the cluster’s overall performance.
References
[1] CERPA, A., ELSON, J., BEHESHTI, H., CHANKHUNTHOD, A., DANZIG, P., JALAN, R., NEERDAELS, C., CHROEDER, T., AND
TOMLINSON, G. NECP – the network element control protocol, March 2000.
[2] CISCO SYSTEMS. The cisco dynamic feedback protocol, August 2002. http: //www.cisco.com/warp/public/cc/pd/ ibsw/mulb/tech/dfp_wp.htm [2002, 20 September].
[3] ELSON, J. Private communication: “Re: NECP Protocol”, July 2002.
[4] GAUDET, D. Apache http server version 1.3 – Apache performance notes. http://httpd. apache.org/docs/misc/perf-tuning.html [2002, 28 May].
[5] MOSBERGER, D.,ANDJIN, T. httperf - A tool to measure web server performance. In Proceedings, USENIX Symposium on Internet technologies and Systems (1997), pp. 59–76.
[6] NETCRAFT. Netcraft web server survey, May 2002. http://www.netcraft.com/survey/[2002, 28 May].
[7] O’ROURKE, P., AND KEEFE, M. Performance evaluation of Linux Virtual Server, April 2001. [8] ZHANG, W. Linux Virtual Server for scalable
net-work services. In Proceedings, Ottawa Linux Sym-posium (2000).
[9] ZHANG, W. Linux Virtual Server web site, 2002.http://www.linuxvirtualserver.org/ [2002, 15 May].