Server Power and Performance Evaluation
in High-Temperature Environments
Overview and Background
Expanding the ambient-temperature operating range for IT equipment (ITE) can yield significant savings in capital and operating expenses related to cooling infrastructure.
Existing standards and guidelines can provide an appropriate framework for evaluating performance, reliability, and other factors while operating close to the prescribed limits of ambient temperature ranges. This paper describes the results of a study in which under certain load conditions an Intel® Xeon® processor-based system designed for a Class A2 environment1 as defined by the American Society of Heating, Refrigerating, and Air-Conditioning Engineers (ASHRAE) can be adapted to a Class A4 environment1 or to a 3.1E environment as defined by the European Telecommunications Standards Institute (ETSI).
The study, conducted by Microsoft and Intel, shows how a server can be characterized to determine its capability based on ambient temperature and performance while ensuring that power and thermal constraints can be maintained. It also summarizes other issues to be considered in the context of operation at the extremes of the environmental range specified for a given system.
Creating server systems that operate at higher-than-usual ambient temperatures can help initiate a trend away from conventional chiller-cooled data centers to free-air-cooled data centers. The further system design improvements discussed here target the elimination of water used for adiabatic cooling by using only the surrounding outdoor ambient air for cooling, thereby lowering facility complexity and total cost of ownership (TCO).
The results of this study are not necessarily relevant to all environments, and it also does not address reliability issues associated with operating outside the Class A2 environment.
Intel Corporation: K. Govindaraju, Workloads/Performance Architect; Robin Steinbrecher, Platform Thermal Architect; Sandeep Ahuja, CPU Thermal Architect; Eyran Eylon, Technology Development Manager; Jay Kyathsandra, Product Marketing
Microsoft Corporation: Dileep Bhandarkar, Chief Architect, Global Foundation Services; Kushagra Vaid, General Manager, Hardware Engineering; Mark Shaw, Director, Hardware Engineering; Sriram Sankar, Hardware Engineer
Server Design for
High-Temperature Operation
The use of free-air-cooled data centers can result in exposure to a wider range of inlet temperatures to the ITE, which is typically designed based upon a maximum inlet temperature of 35° C (95° F). While Microsoft has shown that free-air-cooled data centers work well in certain climates, such as that of Dublin, Ireland,2 few populated places in the world stay below this temperature year round. This white paper demonstrates how a well-designed server can support temperature excursions to as high as 45° C (113° F) based upon meeting target use conditions for a specific application. One approach to operating at higher temperatures is to improve an air-cooled server design through the use of enhanced heat sinks and increased airflow. While improving design for higher efficiency is often the right choice, sizing ITE for full
performance at 45° C may result in lower overall efficiency by requiring a larger data center footprint and provisioning power that is only used during the hottest portion of the year due to the increase in airflow and power requirements for the servers. If the extreme temperatures occur for only a few hours, it is reasonable to advocate trading off a small amount of performance at the hottest time of the year to achieve efficiency the remainder of the year. This approach is also likely to maintain the server purchase cost, by avoiding the increased cost of server cooling components that support continuous operation at high temperatures. While operation above 35° C in an economized data center needs to be supported, these temperature excursions occur for only a few hours during the year, even in high-temperature climates, as shown in Figure 1.2
0 5 10 15 20 25 30 35 40 45
4500 4000 3500 3000 2500 2000 1500 1000 500 0
Number of Hours
Ambient Temperature (°C)
Tropical Climate Humid Northern Desert Climate Data - Average Hours at a Given Temperature
In many climates, the temperature goes above 35° C for only a few hours in an average year; desert climates experience the most, at 67 hours per year (0.8 percent of the time). Systems that can operate at 45° C are able to handle 50-year extremes in temperature. Note that temperatures in tropical climates are nearly always between 22° C and 33° C.
Hours over 35° C
2 5 67
Tropical Humid Northern Desert
Hours over 40° C
0 0 3
Average Maximum
36° C 36° C 41° C
50 year Extreme
37° C 41° C 43° C
Figure 1. Low incidence of temperature excursions above 35° C.3
Table of ConTenTs
overview and background . . . . 1
server Design for High-Temperature operation . . . . 2
Performance Requirement Based on a Specific Benchmark . . . . 4
Provisioning for Power and Server Quantity . . . . 4
Recipe to Support Usage Model . . . . 5
Test environment and Protocol . . . . 6
Results . . . . 6
Conclusion . . . . 8
acknowledgements . . . . 8
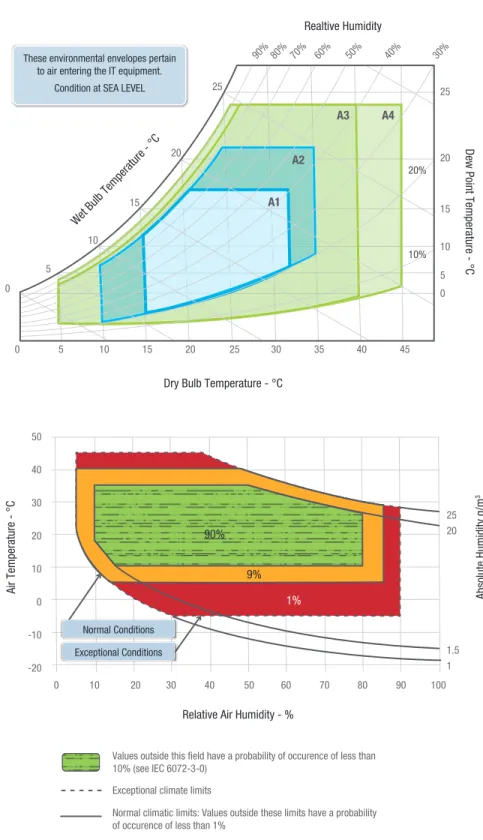
To support this usage model, it is necessary to understand the relevant environmental classes to ensure alignment with IT manufacturer design targets and warranties. In 2011, ASHRAE defined two new classes—A3 and A4,1 as shown in Figure 2—to set expectations for data centers operating with a high degree of economization and the ITE designed for them. The ranges of both temperature and humidity widened significantly, creating the opportunity for reductions in both capital and operating expenditure depending upon climate.
ASHRAE provides guidance1 on evaluating the reliability of ITE in an individual data center based on the time spent at various environmental conditions. By evaluating a data center’s time-weighted temperature throughout the period of interest, one can derive the expected multiplier to the baseline failure rate of ITE in the data center. However, ASHRAE does not recommend operating at high temperature, and the ITE manufacturer’s warranty may not support it either.
ETSI has set an environmental standard that includes operation up to 45° C for limited time periods, illustrated by the data shown in Figure 2. This standard applies to telecommunications equipment, as opposed to the focus of the ASHRAE guidelines on ITE in general. The ETSI standard does provide one model for designing ITE but does not define the performance required under these conditions. In any case, an ITE manufacturer may find it valuable to align future equipment with one of these environments to enable wide-ranging acceptance of its product, and the ETSI specification provides a model with respect to time spent in state.
0 5 10 15 20
20%
10%
25 0
5 10
15 20
25
90%80% 70% 60% 50% 40% 30%
30 35 40 45
25
20
15 10 5 0
Dry Bulb Temperature - °C Wet Bulb Temperature - °C
Realtive Humidity
Dew Point Temperature - °C
These environmental envelopes pertain to air entering the IT equipment.
Condition at SEA LEVEL
A3 A4
A2 A1
0 10 20 30 40
Values outside this field have a probability of occurence of less than 10% (see IEC 6072-3-0)
Exceptional climate limits
Normal climatic limits: Values outside these limits have a probability of occurence of less than 1%
NOTE: Exceptional conditions may occur following the failure of the temperature controlling system. This is described as 3.1E in the tables, but it should be noted that there is no separate class 3.1E.
50 50
40 30 20 10 0 -10 -20
60 70 80 90 100
25 20
1.5 1
Relative Air Humidity - %
Air Temperature - °C Absolute Humidity g/m
3
90% 9%
1%
Normal Conditions Exceptional Conditions
Figure 2. American Society of Heating, Refrigerating, and Air-Conditioning Engineers (ASHRAE) classes and the European Telecommunications Standards Institute (ETSI) specification.
3 3
Performance Requirement Based
on a Specific Benchmark
Large-scale online services that are both processor and memory intensive typically operate in scale-out commodity server deployments. Such applications operate under a particular performance service-level agreement (SLA). However, due to the scale-out nature of the application, it is extremely rare that all servers are tasked with peak workloads at the same time, and as a consequence, not all servers are equally stressed.
This presents an opportunity for optimizing operational constraints based on this usage. For such large-scale online services, if one can achieve significant benefit in terms of data center cost efficiency (operations and build out), one can trade off performance SLA in preference for optimal operation, achieving a better overall performance and TCO. The next section elaborates the efficiency of data center builds based on capacity sizing. To understand the benefit of sizing by power and expected load on the machine, applications were benchmarked on proposed server configurations. The load versus power characteristics obtained from such benchmark runs can be used to optimally size the data center.
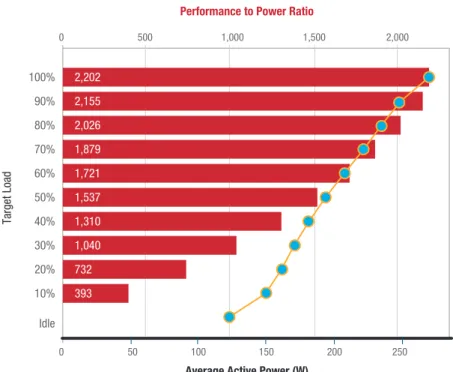
Figure 3 shows a sample load versus power curve for specific points making up the SPECpower* workload for the server under study. As load is reduced, power decreases until it reaches the server’s idle power level. Reducing utilization would impact power and in turn component temperatures in the server. The rest of this paper references SPECpower in examining performance and power trade-offs associated with the methodology under consideration.
Provisioning for Power
and Server Quantity
To ensure optimal efficiency of the data center solution, all available power capacity must be utilized. The industry metric for building data centers is millions of U.S. dollars per megawatt ($M/MW). If a hypothetical data center utilizes only 50 percent of the total capacity, the true cost is doubled (1/0.50). Cloud service providers typically size IT loads to match data center capacity by adding servers until the capacity is reached. The ITE is rated based on running the worst-case application. This aspect of sizing is very important, because the actual worst-case power is typically much lower than the nameplate power of the equipment, since it accounts for variations in configurations and actual system utilization and includes the power supply’s efficiency at the actual operating point. This factor enables a very high utilization of a data center’s capacity. It also requires that users
of the equipment evaluate power consumption whenever changes are made to hardware or software running on the servers.
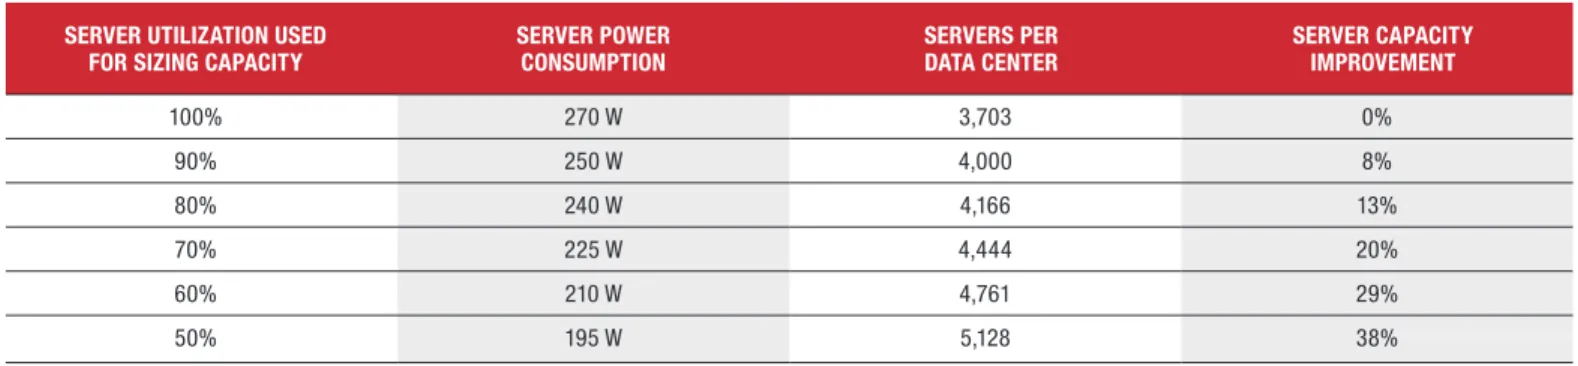
Table 1 lists the comparative data for a hypothetical 1 MW data center populated with a single type of server, with the power consumption profile shown in Figure 3. As shown in Table 1, if the data center is sized for servers at the full SPECpower consumption value, 3,703 servers could be installed. But if the application can never go above 225 W at 70-percent utilization, the data center could fit 4,444 servers. Overall capacity of the solution is 20-percent better than sizing at the maximum SPECpower value of 270 watts. Figure 3 shows the power levels at nominal temperature. If the server operates at 45° C at full performance, the fans and the silicon consume more power. This approach requires that an even higher power level per server be used when calculating data center capacity. By using power
0 50 100 150 200 250
0 500 1,000 1,500 2,000
Target Load
Performance to Power Ratio
Average Active Power (W)
100% 90% 80% 70% 60% 50% 40% 30% 20% 10% Idle
2,202 2,155 2,026 1,879 1,721 1,537 1,310 1,040 732 393
Figure 3. Load versus power curve for SPECpower*.
Table 1. Server capacity improvement as a function of server power consumption
Server UTIlIzaTIOn USeD
FOr SIzIng CapaCITy Server pOwer COnSUMpTIOn ServerS per DaTa CenTer Server CapaCITy IMprOveMenT
100% 270 W 3,703 0%
90% 250 W 4,000 8%
80% 240 W 4,166 13%
70% 225 W 4,444 20%
60% 210 W 4,761 29%
50% 195 W 5,128 38%
capping at higher temperatures, power requirements per server can be reduced, allowing more servers to be provisioned into the data center, as long as the reduced performance and reliability at high temperature are acceptable. The following sections quantify a method for determining the magnitude of the performance degradation. Additional investigation is needed to determine the impact on reliability.
Recipe to Support Usage Model
Microsoft’s future environmental needs based on climate align well with the ETSI specification where operation above 35° C is limited, but requires support up to 45° C at least a few days per year. Consequently, a 45° C capability was chosen as the high temperature requirement for this study. Evaluating performance under Microsoft’s workload during the excursion above 35° C enables Microsoft to size the capability for optimizing TCO based upon the previously described metrics. A server selected for use under this usage model must still meet all thermal specifications, potentially resulting in increased requirements for the ITE manufacturer. Full evaluation of thermal capability for determining the adequacy of the thermal design is still necessary. However, it also important to
consider the capability for supporting the higher ambient temperature
without adding undue cost to the server or consuming excessive power based on the higher ambient-temperature support.
By characterizing the workloads, ITE manufacturers can tune thermal management to ensure that server design supports the model. Through use of power-limiting mechanisms such as processor P-states and memory thermal throttling, ITE manufacturers can characterize and tune server thermal management, including fan speed control, to deliver the thermal characteristics required to meet performance goals. In effect, the server must be classified as capable of operating in A4 conditions but may not support typical performance design points for such a server. In that respect, it is denoted as a “workload-tuned” server tolerant of operating over short periods of time in an A4 environment. When selecting a server to support extreme temperature conditions, its basic design and its components must be carefully considered. Some processor models are better suited to extreme operation and can be enabled with little or no performance degradation under any load.
One potentially counterintuitive aspect of system design is that a higher number of DIMMs may be easier to cool than a lower number of DIMMs. This relationship exists because a higher number of
smaller-capacity DIMMs is associated with lower power levels per DIMM and lower DRAM temperatures for an equivalent workload. However, a higher number of low-capacity DIMMs are likely to consume more total power than fewer high-capacity DIMMs, further reducing the overall server capacity. These interrelationships demonstrate that optimizing memory configurations cannot be achieved using a simple formula, and the process can benefit from consulting ITE manufacturers. Finding an optimal thermal design for the server itself requires trade-offs that include optimal heat sink design, as well as board and system layout. A server that is configured to eliminate thermal shadowing will generally be easier to cool—and consume less fan power—than an equivalent server with the same features and configuration that has thermally shadowed components. Tests have shown that hard-disk drives (HDDs) have lower reliability as temperatures increase.4 Placing HDDs in locations that receive fresh inlet air is generally recommended. Still more opportunities exist at the system level in terms of density reduction using larger form factors such as 1.5U compared with 1U. These larger form factors enable larger heat sinks and improved venting, thereby improving operating capabilities at increased ambient temperature.
Test environment and protocol
Testing was conducted on the server, which was designed to support an ASHRAE Class A2 environment, as described in Table 2. An
environmentally-controlled chamber was used to deliver the tested ambient temperature as measured at the server inlet, and thermocouples were mounted in the server on key components and at other relevant locations.
The SPECpower workload used in the investigation was modified so that for each load point, tests were executed for 20 minutes instead of the default four-minute setting. This modification allowed the components to stabilize based on the ambient temperature setting. Execution of benchmarks, data collection, and system inlet temperature control were fully automated. Intel® Data Center Manager (Intel® DCM)5 was used for power capping.
To enable temperature stabilization, all system fans were set to specific speeds in unison and at fixed conditions instead of allowing the server management firmware to automatically adjust fan speeds. The server fans were pulse-width modulation (PWM) controlled. The fan speeds were roughly linear with PWM duty cycle setting and tested at 34 percent (the approximate recommended setting based upon a TDP workload under worst-case ASHRAE Class A2 conditions for the tested configuration), 41 percent (+20 percent of baseline), and 48 percent (+40 percent of baseline). Intel DCM was used to define the power capping limit of the server in order to study its performance behavior.
Table 2. Test server configuration.
COMpOnenT DeSCrIpTIOn
Processors Two IntelIntel® QuickPath Interconnect ® Xeon® processors L5640, 60W @ 2.53 GHz, 6.4 GT/s
Chipset Intel® 5500 Chipset
Memory Configuration DRx8 (32 GB total) Drives Four 300-GB drives
60 65 70 75 80 85 90 95 100
Performance (ssj_ops) System Power (W
)
Performance, Power vs. Processor P State Setting @PWM=34%, 50°C
Processor P State Setting (% of P1)
600,000 550,000 500,000 450,000 400,000 350,000 300,000
275 270 265 260 255 250 245
Performance Power
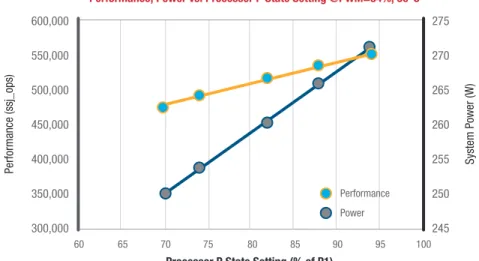
Figure 4. Performance characterization.
results
Power and performance
characteristics were established using the acquired data as shown in Figure 4 for a single ambient temperature and fan speed combination. With these characteristics and those under other fan speeds and ambient temperature combinations, power and performance capability can be determined under any defined processor utilization setting.
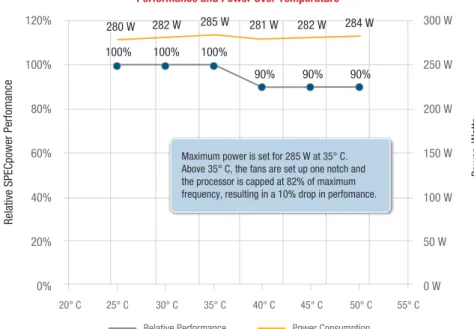
Microsoft’s performance
requirements can then be mapped within the performance, power, and ambient temperature capability of the server. Figure 5 shows an example of this approach, based on staying within a power cap of 285 W. As ambient temperature increases above 35° C, performance as measured by relative SPECpower performance drops to 90 percent of
20° C 25° C 30° C 35° C 40° C 45° C 50° C 55° C
Relative SPECpower Perfom
anc
e
Power, Watt
s
Performance and Power Over Temperature
120% 100% 80% 60% 40% 20% 0%
280 W 282 W 282 W 284 W
90% 90% 90% 100% 100% 100%
285 W 281 W 300 W
250 W 200 W 150 W 100 W 50 W 0 W
Relative Performance Power Consumption
Maximum power is set for 285 W at 35° C. Above 35° C, the fans are set up one notch and the processor is capped at 82% of maximum frequency, resulting in a 10% drop in perfomance.
Figure 5. Performance within a power envelope versus system inlet temperature. peak capability to match the power
capability of the data center as equated to a single server. A power management capability such as that available from Intel® Intelligent Node Manager can provide that power capping capability. For the specific system under test, only at 50° C could any component temperature be exceeded. However, that one component was the processor itself, which reduces P-state based on thermal limits thereby ensuring continuous performance within the boundaries of Microsoft’s requirements. Because systems are rarely operated at or above 90 percent of peak capability, server power capping is below the rated maximum and would not drop the processor frequency or impact application performance.
The testing described in this paper used an ASHRAE Class A2 server. The equipment manufacturer must evaluate and approve server operations outside the intended range; otherwise, the data center operator must assume the added risk. The characteristics of the specific server tested were well understood, and as a consequence even non-monitored components were known to be within the specification based on the evaluated cases. The usage condition for the processor also fell within the allowable excursion specification. Locations likely to experience longer term excursions, such as those in the deserts of the southwestern United States, may be outside the 360-hour processor excursion specification and may not be supportable because of the potential impact on long-term reliability.
Conclusion
A methodology utilizing power capping technology was defined to allow an ASHRAE Class A2 server to meet real-world application performance requirements in an ASHRAE Class A4 environment over short intervals of time. More servers can be deployed into the data center under this methodology, improving TCO. Power capping ensures that thermal specifications are met, and power capacity limits are not broken. A free-air-cooled data center
that supports higher temperature excursions can help reduce data center capital costs by elimination of the need for adiabatic or mechanical cooling. A small reduction in performance capability during high ambient temperature excursions will be experienced. The capacity increases and the amount of
performance degradation can be modeled in advance by reviewing climate data and adjusting the knobs to align with the business needs of the data center user. Operationally, potential performance degradation can be anticipated and addressed accordingly by watching day-to-day weather reports.
Data center operators that have not yet begun to consider the topics covered in this paper may put their competitiveness at risk. The alternative described here shows a possible avenue for improving efficiency and reducing the use of water and refrigerants in data centers, while balancing power and performance. The reliability aspects of high temperature operation needs further investigation to complete the analysis.
acknowledgements
The authors wish to thank the Intel Data Center Group for contributions and assistance.
1 See the ASHRAE white paper describing environmental classes at www.tc99.ashraetcs.org. 2 Microsoft’s Dublin Data Center Grows with Enhanced Efficiency and Sustainability
http://www.globalfoundationservices.com/posts/2012/march/5/microsofts-dublin-data-center-grows-with-enhanced-efficiency-and-sustainability.aspx.
3 ASHRAE Technical FAQ ID 40 Question Where can I get bin weather data for my area? www.ashrae.org/File%20Library/docLib/Public/20100427_tc_0407faq_40.pdf.
4 Sriram Sankar, Mark Shaw, Kushagra Vaid “Impact of Temperature on Hard Disk Drive Reliability in Large Datacenters” at DSN 2011, International Conference on Dependable Systems and Networks. 5 More information on Intel® Data Center Manager can be found at www.datacentermanager.intel.com.
INFORMATION IN THIS DOCUMENT IS PROVIDED IN CONNECTION WITH INTEL® PRODUCTS. NO LICENSE, EXPRESS OR IMPLIED, BY ESTOPPEL OR OTHERWISE, TO ANY INTELLECTUAL PROPERTY RIGHTS IS GRANTED BY THIS
DOCUMENT. EXCEPT AS PROVIDED IN INTEL’S TERMS AND CONDITIONS OF SALE FOR SUCH PRODUCTS, INTEL ASSUMES NO LIABILITY WHATSOEVER, AND INTEL DISCLAIMS ANY EXPRESS OR IMPLIED WARRANTY, RELATING TO SALE AND/OR USE OF INTEL PRODUCTS INCLUDING LIABILITY OR WARRANTIES RELATING TO FITNESS FOR A PARTICULAR PURPOSE, MERCHANTABILITY, OR INFRINGEMENT OF ANY PATENT, COPYRIGHT OR OTHER INTELLECTUAL PROPERTY RIGHT. UNLESS OTHERWISE AGREED IN WRITING BY INTEL, THE INTEL PRODUCTS ARE NOT DESIGNED NOR INTENDED FOR ANY APPLICATION IN WHICH THE FAILURE OF THE INTEL PRODUCT COULD CREATE A SITUATION WHERE PERSONAL INJURY OR DEATH MAY OCCUR.
Intel may make changes to specifications and product descriptions at any time, without notice. Designers must not rely on the absence or characteristics of any features or instructions marked “reserved” or “undefined.” Intel reserves these for future definition and shall have no responsibility whatsoever for conflicts or incompatibilities arising from future changes to them. The information here is subject to change without notice. Do not finalize a design with this information. The products described in this document may contain design defects or errors known as errata which may cause the product to deviate from published specifications. Current characterized errata are available on request. Contact your local Intel sales office or your distributor to obtain the latest specifications and before placing your product order. Copies of documents which have an order number and are referenced in this document, or other Intel literature, may be obtained by calling 1-800-548-4725, or by visiting Intel’s Web Site http://www.intel.com/.
Software and workloads used in performance tests may have been optimized for performance only on Intel microprocessors. Performance tests, such as SYSmark and MobileMark, are measured using specific computer systems, components, software, operations and functions. Any change to any of those factors may cause the results to vary. You should consult other information and performance tests to assist you in fully evaluating your contemplated purchases, including the performance of that product when combined with other products. For more information go to www.intel.com/performance.
*Other names and brands may be claimed as the property of others.
Copyright © 2012 Intel Corporation. All rights reserved. Intel, the Intel logo, and Xeon are trademarks of Intel Corporation in the U.S. and other countries