Detecting attacks involving DNS servers
A Netflow data based approachStephan Roolvink
Supervisors: Dr. ir. A. Pras
Dr. R. Sadre A. Sperotto M.Sc.
Detecting attacks involving DNS servers
A Netflow data based approachStephan Roolvink c
Date December 15, 2008
Supervisors: Dr. ir. A. Pras
Dr. R. Sadre A. Sperotto M.Sc.
Abstract
The number of attacks on Internet services has been on the rise since the Internet became available to the general public. One of the services that has also been attacked using various ways is the Domain Name System (DNS) service. The DNS is one of the most important parts of the Internet. Without it, people would not be able to connect to favorite websites or check their e-mail. New attacks on services appear almost daily, like the DNS cache poisoning attack that was discovered by Dan Kaminsky. To defend against such attacks, a number of approaches have been researched and implemented, with varying success.
In this thesis several steps were taken to gain insight into the DNS service and the attacks that plague them. Log files from two DNS servers was used to gain insight into the DNS traffic that client and the DNS servers generate. The different types of attacks that are possible were analysis and described. The detection of attacks is done by describing the characteristics of the attacks and deriving methods of detection. One of these methods, called the relative entropy method, was tested in an effort to validate the effectiveness of this method. The goal that will be presented in the thesis focuses on detecting attacks involving DNS servers, using high level flow data gathered at routers.
From the research it could be concluded that the implementation of many DNS clients and the DNS server software BIND have implementation issues that need to be dealt with. The research has also shown that several different types of attacks exist that threaten the DNS service. From the research it could be concluded that certain attacks can be found using only Netflow data. The use of relative entropy method has shown that with more research can be used to detect certain attacks.
Preface
The thesis that you are about to read is the result of final masters project done on the University of Twente at the Design and Analysis of Communication Systems (DACS) chair. In a lab on the fifth floor I spend my time ”quietly” trying to solve the problems of detect DNS attacks with only Netflow data. The research enticed me to use statistical measures I had not even heard of before the start of the project, which was hard but interesting to do. The literature about DNS traffic showed me many aspects on DNS traffic that were intriguing to know. It was great fun working on this project as it entailed a lot of thinking and doing stuff.
I want to thank Aiko Pras, Anna Sperotto and Ramin Sadre for their guidance during the research. The guys at ICTS for their help in gathering the data that was used in the research and their insight into the structure of the network.
This thesis would never ever have seen completion if my father and mother would not have supported and trusted me like they did (and the occasional needed kick in the butt). This
thesis would be in much poorer state, if my girlfriend D´esir´ee Pikaar and my fellow students and
friends Jochem Rutgers and Martijn van Eenennaam, had not helped me out with improving the grammar, spelling and content in this thesis. And I would like to thank Gert Vliek for being the bringer of the end of the week (he always did that and nobody knows why).
Finally I want to thank Jochem Rutgers, Martijn van Eenennaam and Gerwin Ruiterkamp for their bottles of wine during the Christmas dinner on 20 December 2008.
I liked writing this thesis, so I hope you like reading it, it might be a little rough but hold interesting information.
Stephan Roolvink
Contents
Abstract v
Preface vii
1 Introduction 1
1.1 The research . . . 1
1.2 Research approach . . . 2
1.3 Outline . . . 3
2 State of the art 5 2.1 The DNS protocol . . . 5
2.1.1 DNS response codes . . . 8
2.1.2 Extensions to DNS . . . 9
2.2 Network Intrusion Detection Systems . . . 12
2.2.1 Packet symmetry . . . 12
2.2.2 Cache poisoning detector . . . 12
2.2.3 Tunneling attack detector . . . 12
2.3 The Netflow data . . . 13
2.4 The TCPdump data . . . 14
3 DNS statistics 17 3.1 Netflow data statistics . . . 17
3.2 TCPdump traffic statistics . . . 19
3.2.1 Measures . . . 19
3.2.2 Outcome . . . 21
3.3 Summary . . . 28
4 Attack overview 29 4.1 Types of DoS attacks . . . 29
4.2 Attacks targeting DNS servers . . . 31
4.3 Attacks using DNS servers . . . 34
4.4 Traffic characteristics of the attacks . . . 34
4.4.1 DoS attack . . . 35
4.4.5 DNS cache poisoning . . . 37
4.4.6 Buffer overflow . . . 37
4.4.7 Port scans . . . 37
4.4.8 DNS tunneling . . . 38
5 Search methods for finding attacks 39 5.1 Search method per attack characteristic . . . 39
5.1.1 DoS attack . . . 39
5.1.2 Botnet DDoS attack . . . 39
5.1.3 Reflection DDoS attack . . . 40
5.1.4 Recursive query attack . . . 40
5.1.5 DNS cache poisoning . . . 40
5.1.6 Buffer overflow . . . 41
5.1.7 Port scans . . . 41
5.1.8 DNS tunneling . . . 41
5.2 General detection methods . . . 41
5.2.1 Packet per flow method . . . 41
5.2.2 Average number of connecting hosts . . . 45
5.2.3 Average number of flows . . . 46
6 Validation 49 6.1 Relative entropy validation . . . 49
6.1.1 Relative entropy calculator . . . 49
6.1.2 Relative entropy output . . . 52
6.1.3 Threshold calculation . . . 60
6.2 Summary . . . 62
7 Conclusions and Recommendations 63 7.1 Conclusions . . . 63
7.2 Future work . . . 65
Appendices 69 A DNS requests and their responses 69 A.1 UDP traffic . . . 69
A.2 TCP traffic . . . 70
List of Figures
2.1 DNS message sequence: recursive querying . . . 6
2.2 DNS message sequence: iterative querying . . . 6
2.3 DNS response for www.utwente.nl (using DIG) . . . 7
2.4 Small example network . . . 8
2.5 Zones in DNS hierarchy . . . 10
2.6 AXFR zone information example . . . 10
2.7 Network topology overview . . . 14
2.8 TCPdump capture mirror port setup . . . 15
3.1 Source port distribution DNS clients . . . 26
3.2 Source port usage Restricted range DNS clients . . . 26
3.3 Source port distribution UT DNS servers . . . 26
3.4 Query ID distribution DNS client . . . 27
3.5 Query ID distribution UT DNS servers . . . 27
4.1 The IPv4 header . . . 30
4.2 A DDoS attack using Botnets . . . 30
4.3 A DoS attack. . . 31
4.4 A Reflection DDoS attack . . . 32
4.5 Cache poisoning — Dan Kaminsky . . . 33
4.6 Port scan features . . . 38
5.1 Distribution of average packets per flow — UT dataset. . . 42
5.2 Standard deviation packets per flow — UT dataset. . . 43
5.3 Skewness illustration (source Wikipedia) . . . 44
5.4 Two identical probability distributions — with Relative entropy zero . . . 45
5.5 Two different probability distributions . . . 46
5.6 Distribution of connecting hosts . . . 47
6.1 Time plots of two hosts with flows having the highest average packets per flow . 50 6.2 Relative entropy output UT DNS servers (gc= 0.001) . . . 53
6.3 Relative entropy output UT DNS servers (gc= 1−100) . . . 54
6.4 Distribution comparisons . . . 55
6.6 Probability impact . . . 56
6.7 Relative entropy modifications . . . 57
6.8 Relative entropy — probability domain separation . . . 57
6.9 Relative entropy — Bin merging . . . 58
6.10 Distribution comparison — Re=0.015 . . . 59
6.11 Relative entropy —i impact . . . 59
6.12 Relative entropy — Remove top packet per flow bin . . . 60
A.1 Sequence diagram of DNS connection over TCP . . . 71
A.2 The IPv4 header . . . 71
List of Tables
2.1 Options Resource Record . . . 11
3.1 Balance of DNS servers against active hosts . . . 18
3.2 Balance of TCP versus UDP DNS traffic . . . 18
3.3 The number of UDP DNS servers of the total amount of DNS servers . . . 18
3.4 Amount of DNS traffic compared to total traffic . . . 19
3.5 Client to DNS server statistics . . . 22
3.6 DNS server recursion statistics . . . 23
3.7 Top 10: Requested top level domains . . . 24
3.8 Top 10: Requested unknown TLDs . . . 24
6.1 Distribution of packets per flow . . . 52
6.2 Example distributions — High entropy but no attack . . . 54
6.3 Example distribution — Domain separation . . . 58
6.4 Lower and upper bounds for Relative entropy threshold . . . 60
A.1 The TCP flags of request and corresponding response using BIND . . . 72
1
Introduction
Over the years the internet has expanded to enormous proportions, with increasing numbers of hosts and availability of high-speed connections. This expansion has also lead to an increase in the number of attacks on hosts. The Domain Name System (DNS) is one of the important parts of the internet. Without it most people would not be able to connect to their favorite website. It is not hard to imagine that DNS servers have also been the targets of attacks. These attacks are possible because of exploits in the DNS protocol or bugs in the DNS software. There is also a group of attacks that overload a host with packets taking up massive amount of bandwidth and processing power in the hope of making the DNS server unavailable for genuine users. These attacks are called Denial of Service (DoS) attacks. The reasons for these attacks differ: for example a DNS cache poisoning attack is used to get control over a domain, while DoS attacks just want to disrupt normal service. Although system administrators are continuously adding new lines of defense to protect their infrastructure, the new generation of attackers is continuously trying new approaches to find ways to circumvent these defenses. Recently there have been reports of domain hijacks of several Internet Corporation for Assigned Names and
Numbers (ICANN1) addresses [57]. This raises a question: if a well maintained organization like
ICANN can be victim of a domain hijack, which other organizations have been victims of similar attacks? The use of high-speed networks makes low-level packet inspection a costly operation, so new ways are needed to perform traffic analysis for Intrusion Detection Systems (IDS). For this project, Netflow is used to perform traffic analysis. Netflow data is aggregated flow level data that was captured at routers.
1.1
The research
The use of Netflow data for high-speed traffic analysis would put less strain on a Intrusion Detection System. However the use of Netflow comes at the cost that the packets have been stripped of their content. As Sir Francis Bacon once said: “Knowledge is power” [4]. With this loss of the packet content, some attacks will be impossible to find, because in those cases only the packet content contains relevant information. This leads to the following research question:
How can attacks on DNS servers be detected by using Netflow data from routers?
In order to completely answer the main research question, a few sub questions are formulated. Each of these sub questions is part of the main research question and focuses on a certain aspect of the main research question. The sub research question that where formulated are:
1. What are the types of attacks that target DNS servers, and in what way?
Before it is possible to detect attacks is best to know the possible attacks and their char-acteristics.
2. What are the traffic characteristics of the attacks and how do they translate to Netflow data?
The possible attacks have characteristics that might be found in Netflow data, but it might also have characteristics that cannot be detected. For example: a traffic characteristic can be that during an attack the ratio of large packets from the DNS is larger than normally expected. The use of Netflow data might make it impossible to use certain traffic characteristics to find attack. This means that information needs to be identified that can be used to construct a viable way to look for attacks.
3. Which algorithms can be used to successfully detect attacks?
Using specific detection methods for every attack leads to more overhead than necessary. If attacks have overlapping characteristics, one detection method could be used to detect both attacks.
4. What are the false positives probabilities of the algorithms that can be used?
Every search algorithm will have a probability that it will give false positives on the existence of an attack [62]. This means that the method says there is an attack, which was not the case.
5. What are the false negatives probabilities of the algorithms that can be used?
Every search algorithm will also have a probability that it will give false negatives on the existence of an attack [62]. This means that the method says there is not an attack, which there actually was.
1.2
Research approach
The following approach is used in this thesis.
• Literature study: From literature, information is gathered about the workings of the DNS protocol, the possible attack and their characteristics. The literature study is used to answer sub research questions one and two. Sub research question one is answered in chapter 4 and sub research question two is answered in chapter 5.
• Gathering statistics: The data used in the project contains information about many different aspects of the usage the DNS protocol. A statistical analysis is performed to get a better insight into the usage of the DNS protocol and helps to understand certain flows, that can be found in in the Netflow data.
• Analysis: The characteristics that were found in the literature study need to be linked to a detection method for Netflow, if that is possible. The methods that were described for the attack characteristics are analyzed to find more general methods of finding attacks. This part of the approach should help answer the sub research question three. This sub research question is answered in chapter 5.
• Validation: Validation of the usefulness and accuracy of the methods of the previous step is done by using the Netflow data. The validation is done to answer the sub research questions four and five. These questions are answered in chapter 6.
1.3. Outline
1.3
Outline
Chapter 2 describes the state of the art of DNS servers, while chapter 3 describes various statistics about the DNS protocol usage that was extracted from the data that was used for this thesis. Chapter 4 discusses various attacks and corresponding traffic characteristics. Chapter 5 explains the possible search methods for the attack characteristics and also gives more generic methods of finding attacks. Chapter 6 shows the validation of one the search methods that was described in chapter 5. Chapter 7 is used to draw conclusions on the research questions.
2
State of the art
In this chapter the state of art will be described of the DNS protocol and Network Intrusion Detection Systems (NIDS). Also a description will be given of the Netflow information and it database as it was used in this assignment.
2.1
The DNS protocol
A DNS server is used to translate human readable domain name to the corresponding IP address. The basic scenario of a DNS resolution can be seen in figure 2.1. A sequence of steps is taken to complete the address resolution: in the situation depicted in figure 2.1 the DNS server has an empty cache (see below).
1. A client asks its local DNS server for an address resolution.
2. The local DNS server asks the root DNS server for the address resolution. 3. The root DNS server responds with a referral to the top level DNS server. 4. The local DNS server asks the top level DNS server for the address resolution. 5. The top level DNS server will respond with a referral to the second level DNS server. 6. The local DNS server asks the second level DNS server for the address resolution.
7. If this second level DNS server is the authoritative DNS server for the queried address, then it will respond with the IP address of the host or an error. Otherwise it will respond with the address to the third level DNS server.
8. The local DNS server responds to the client with the answer to its query.
In total there can be 127 levels of DNS servers, so a search can continue for several more requests. The local DNS server will store the results of this query in its cache so that if the address is asked again it can give a faster response. The DNS server described above is a recursive DNS server, for it recursively queries DNS servers until it finds the authoritative DNS in which the search host should reside and then it responds. An alternative to recursive querying is iterative querying. With iterative querying the client will do the entire DNS address resolution, instead of the local DNS server. Figure 2.2 shows the sequence of events of an iterative querying client. It can be seen that the first step taken in this iterative search is a query to the local DNS server.
Local DNS server
Root DNS server
.nl DNS server
utwente.nl DNS server
Query for www.utwente.nl
1. 8.
2. 3. 4. 5. 6. 7.
Figure 2.1: DNS message sequence: recursive querying
Local DNS server
Root DNS server
.nl DNS server
utwente.nl DNS server Query for
www.utwente.nl
1. 2.
3. 4.
5. 6.
7. 8.
2.1. The DNS protocol
Figure 2.3: DNS response for www.utwente.nl (using DIG)
If it has the address resolution in its cache it will return this, otherwise it will point to the DNS server with the best address fix.
The DNS protocol has record types. These record types can be found in the request and responses messages in the DNS protocol. In figure 2.3 a DNS response message to a query for
addresswww.utwente.nl can be seen. Looking at figure 2.3 from top to bottom the following
element can be seen:
• Question section: This section contains the initial address that was asked for.
TheArecord indicates an address record, because we want the address for www.utwente.nl.
• Answer section: This section contains the IP address for the address we searched for-mulated.
TheCNAMErecord gives address names that are aliases of the searched for address. These records are called canonical name records.
The A record here indicates that the host webhare.civ.utwente.nl has the latter IP
address.
• Authoritative section: This section lists the DNS servers that are authoritative for the domain in which the address resides.
The NS record indicates that host following the NS tag in this row is a DNS server
for the domain in the beginning of the row.
• Additional section: This section lists additional information about the domain, in this case the address resolution for the authoritative DNS servers. This section is not obligatory, so there will be responses that do not contain this section.
The DNS protocol can return in total thirty four different record types. For this assignment it is of no further interest what these record types are, except for the ones that might be indicative for an attack. These will be handled when needed [22].
Every DNS record has a Time To Live (TTL) field. A DNS server will throw away records in its cache if the TTL has expired. The TTL field was intended for domain administrators to be able to make changes in their domain. In more recent years domain administrators started using the TTL field for load balancing. This is done by setting the TTL value to a very low value which forces a DNS server to query the authoritative DNS server more often, which will then return a server IP address which equalizes to the load of the server.
In figure 2.4 a small network is depicted. This network contains a primary and secondary DNS server run by the Internet Service Provider (ISP). This ISP has a link to the Internet. The ISP has two end users, each end user gets one IP address from the ISP. End user 1 uses this IP address to connect a computer directly to the ISPs network. End user 2 however wants to
connect two computers to the ISP network and uses a router to do this. For end user 1 it can be expected that when it does a DNS query it will not choose a random port number with a value lower than 1024 as these are restricted port numbers [23]. For end user 2 the same traffic might be expected, however the router that end user 2 uses contain a DNS server. The DNS server in the router is used by the Local Area Network (LAN) to resolve hostnames with that LAN. It is also used to resolve queries for addresses on the Internet that are asked by the LAN hosts. Most manufacturers have implemented the routers DNS server to issue these queries from port 53, this is conform the RFC 1035 specification. The use of port 53 as a source port number a for queries by DNS server can be seen as a security problem. D.J. Bernstein proposed to also use a random source port number for inter DNS traffic [6] instead of source port 53.
One feature of the DNS protocol which is reasonably unique is the use of both UDP and TCP as a transport mechanism. The DNS protocol has some rules about when to use UDP and when to switch over to TCP. The main rule is that, if a client contacts a DNS server for a query and the answer to this query makes the UDP packet larger than 512 bytes, the DNS server will respond a message stating that the use of TCP is needed to get the answer. A client is allowed to use TCP for its query instead of UDP even without first contacting the DNS server over UDP [41][42].
Internet
Secondary DNS
End user 1
End user 2 Primary DNS
Figure 2.4: Small example network
2.1.1 DNS response codes
One of the header fields of the DNS protocol is the response code (RCODE) field. When the server responds to a query it will set the RCODE field to the appropriate value to indicate if anything has gone wrong, and if so what has gone wrong. The possible values that the RCODE field can have according to RFC1035 [42] are the following:
No error (0)If no error occurred during the processing the query the RCODE field will have value zero.
Format error (1) In the case that a query does not conform to the DNS specification, by setting incorrect values for certain field or leaving out parts, a format error response will be send.
2.1. The DNS protocol
Server failure (2) A server failure response is send if a query is conform the DNS specification but has fields set in such a way that the name server implementation cannot handle it. An example of this is sending two questions in one query, which is correct according to the specification but should not be used. A query like this would generate a Server failure response.
No such name (3)Indicates that the requested domain name does not exist. This error response is send by the authoritative DNS server for a zone in which the domain name could have existed.
Not Implemented (4)The request done by the client is correct but the function is not implemented.
Refused (5)The request done by the client is refused due to policy reasons. An example of this is the refusal to disclose zone information to outside clients.
Reserved (6-15) These values have been reserved for future.
2.1.2 Extensions to DNS
Over the years some extensions were developed for DNS, which are used to tackle some important issues that are present in the DNS protocol. In the following sections a few of these extensions will be described.
DNS zone transfer
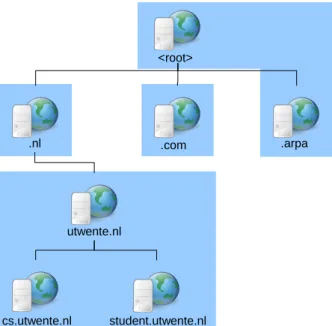
DNS zone transfer is not a separate protocol from DNS, it a part of the DNS protocol which is also known by query opcode AXFR [41]. DNS zone transfer is used for database replication. The DNS zone transfer makes it so that a domain administrator only needs to change zone information of one DNS server. After which DNS zone transfer is used to transfer the zone information to the other authoritative DNS servers in the zone. Figure 2.5 illustrates a some example zones in the hierarchy of DNS, the zones contains all the information about the hosts present in the network.
In figure 2.6 a sample of zone information can be seen. In this example only one host exists,
namely router.openet. The host has two canonical names which are also points of reference for
the name server and the mail server in this zone as are given by the NS record and the MX
record. The Start Of Authority (SOA) record indicates which hosts are Authoritative for this
zone, in this example that would bens.openet. and router.openet.
There are some issues with the use of the DNS zone transfer. The first issue is that of compatibility with the DNS software. Most servers have extra information that is stored in their database about the zone. This information can however not be configured using DNS zone transfer because then the software would not be compatible with other DNS software.
The second issue has to do with the size of zone information and its propagation to the other name servers in the network. It can be imagined that the zone information to be transferred can get very large when the network has a large number of hosts. It can also be imagined that some changes will be made in a zone over time. To overcome the problems with transferring large zone transfers during normal operation of a DNS server when changes are made an extension was created for DNS named incremental zone transfer (IXFR) [44] which works as follows: somewhere in time an IXFR command will be issued with a serial number set in the SOA information. This will result in the response of current SOA information of the server and the zone information. The serial number in the SOA is used as a version number for the last version of the zone that was seen. When a change is made to the network this serial number is changes.
<root>
.nl .com .arpa
utwente.nl
cs.utwente.nl student.utwente.nl
Figure 2.5: Zones in DNS hierarchy
openet. 86400 IN SOA ns.openet. router.openet. 2005062901 21600 3600 604800 86400
openet. 86400 IN NS ns.openet.
openet. 86400 IN MX 10 mail.openet.
router.openet. 86400 IN A 10.0.4.1
ns.openet. 86400 IN CNAME router.openet.
mail.openet. 86400 IN CNAME router.openet.
openet. 86400 IN SOA ns.openet. router.openet. 2005062901 21600 3600 604800 86400
Figure 2.6: AXFR zone information example
It can be incremented, but a best practice is to make it a time stamp. When a new IXFR command is issued with the old received serial number, the server will check if its version is the same or if it differs, and will send the changes since the last serial number.
Dynamic updates
By using the dynamic update protocol it is possible to update host information in a zone [60]. A dynamic update be used in a situation where hosts can become part of the network via a Virtual Private Network (VPN) connection. In order to make the hostname of the VPN host available to the DNS zone a dynamic update is performed by some authorized host, which can be the Dynamic Hosts Configuration Protocol (DHCP) server that issued IP address lease to the VPN host [2] [17]. Also when this user leafs the network it should be removed from the zone. The dynamic update protocol describes additional possible response code (RCODE) values to the list of RCODEs already described in section 2.1.1. The additions to the list are :
YXDOMAIN (6) The update request contains a name that should not exist.
YXRRSET (7) The update request contains a Resource record (RR) that should not exist.
2.1. The DNS protocol
Field Name Field Type Description
NAME domain name empty (root domain)
TYPE u int16 t OPT
CLASS u int16 t sender’s UDP payload size
TTL u int32 t extended RCODE and flags
RDLEN u int16 t describes RDATA
RDATA octet stream attribute,value pairs
Table 2.1: Options Resource Record
NXRRSET (8) The update request misses a RR that is needed for the zone.
NOTAUTH (9) The DNS server is not authoritative for the zone which is declared in the update request.
NOTZONE (10)The update request uses a name in the Prerequisite or Update Section which is not within the zone.
Extension mechanism from DNS 0
This extension also called EDNS0 and can be found in RFC 2671 [58]. RFC 2671 focuses on three alterations on the DNS protocol two of which are alternate use of DNS header information. The third one is of interest to this project as it defines a mechanism to allow the transfer of packets larger than 512 Bytes over UDP. DNS clients and server that implement EDNS0 can include an Options Resource Record (OPT RR) with layout as in table 2.1. The class field in the OPT RR can be set to the value indicating the maximum size of the UDP packets.
Extension mechanism from DNS 1
This extension also called EDNS1 [59]. This extension allow a DNS client to ask multiple
questions in the same query. Although this feature was already described in RFC 1035 it was flawed and never used [42]. The flaw that is present in RFC 1035 is that it is unclear how a server should react if one of the questions returns an error. EDNS1 was created to fix the problems that were not handled in RFC 1035. EDNS1 works on top of EDNS0, so a packet containing a EDNS1 request can be larger than 512 bytes. The use of ENDS1 allows a DNS client to significantly increase the size of a request by asking more than one question. Although this extension is still a draft it might have influence on the applicability of search method that will be discussed in this thesis.
DNS blacklists
A DNS blacklist (DNSBL) is a DNS database containing IP addresses of hosts that have per-formed suspicious activity like spamming [38]. A DNS blacklist can be queried in a normal way it can be asked for the A record or TXT record of a possible spammer. The DNS blacklist can
than respond with eitherno such name indicating that this host is not in the blacklist or it can
respond with an address. The returned address can be used to indicate what made the host look suspicious.
2.2
Network Intrusion Detection Systems
To explain what a Network Intrusion Detection System (NIDS) is it is first best to know what a Intrusion Detection System (IDS) is. An IDS system is used to detect attacks by analyzing incoming data on an end host. The IDS software uses fingerprints of attacks to detect if the it is under attack. These fingerprints contain information on an attack, like specific bits set in a TCP header or data content. The IDS software is there to protect an end host. Now what if there is an entire network to be defended? One option is to install IDS software on every host in the network, this however not very practical and it might be that certain attacks are not found. The other option is to use an NIDS system. In that case the entry points to the network from the Internet are equipped with an IDS system that scans all traffic that passes through. In that case all the traffic of an attack towards the network or from the network should pass through the NIDS system which can protect an entire network.
The problem that packet analysis performing NIDS systems are facing is the rapidly increas-ing bandwidth of networks. Processincreas-ing a packet takes time and system resources. When faced with increasing amount of packets the total amount of used system resources and processing time will increase to a point where the NIDS system is unable to handle the sheer volume of data. For high volume networks a new type of NIDS system is needed, a system that uses less processing time and system resources.
Some methods of finding attacks in Netflow have already been researched. These methods will be described in the following sections.
2.2.1 Packet symmetry
The basic feature of any normal UDP DNS traffic is that the traffic is balanced. This means that for every request there should be one response. Because UDP is connectionless it is however possible that some packets are lost. This also means that no packets will be retransmitted. The use of packet symmetry using Netflow data has been a subject of research by Van der Sanden [33]. His research has proven that it is possible to use packet symmetry. An open issue that was described by Van der Sanden is the packet symmetry of TCP connections. With UDP the traffic should be fully symmetrical while for with TCP this is not the case. It was calculated that the balance between incoming and outgoing traffic might differ a factor two or three.
2.2.2 Cache poisoning detector
For a description of cache poisoning attacks see section 4.2 on page 31. Karasaridis et al. have
described a method to detect cache poisoning attacks [29]. In the detection method request and response flows are counted between two destinations with the same bytes per packet (bpr). If the flow count of either direction surpasses a certain threshold, then an alert is given and using equation 2.1 a decision is made whether this traffic is a Cache poison attack or not.
bprresponse> bprrequest+bprthreshold (2.1)
2.2.3 Tunneling attack detector
For a description of DNS tunneling see section 4.3 on page 34. During an attack it is possible
that more flows are received with a higher average packet size. Karasaridis et al. have created
a system based on Relative entropy to calculate the difference between a normal packet size distribution and the packet size distribution during a time period [29].
2.3. The Netflow data
2.3
The Netflow data
To be able to formulate search algorithms a fixed dataset is needed so that the outcome of search algorithm is repeatable. If the algorithms would be developed using only real-time data, then every time the algorithm would run another result can be expected. Real-time analysis is the ultimate goal of this project, but for formulating and testing queries a fixed dataset is needed.
Some of the networks from which data was captured performed sampling where only 1 out ofn
samples was captured, this was done to decrease the load on the capturing devices. The datasets used in this project are from three sources, namely:
• University of Twente: Here traffic from the university campus is captured. The Netflow data from the University of Twente (UT) has no sampling.
• Geant: Geant is a European network, which is formed out a collaboration between twenty six research and education networks, the European Commission and DANTE, which covers thirty European countries. Because Geant is a multi gigabit data communications network the Netflow data from Geant was sampled at a rate of 1 out of 1000 samples.
• Surfnet: This is an Internet Service Provider (ISP) in the Netherlands focused at provid-ing Internet for Educational institutes, and local governments. Surfnet has sampled the Netflow data at a rate of 1 out of 100 samples. This was done because of the high traffic load on the Surfnet routers.
These institutes captured the data at routers in their network. These routers were configured to export the Netflow data in a specific Netflow version, for Geant and Surfnet Netflow version 9 was used and the UT used Netflow version 5. The basic information that Netflow contains are:
Flow id A number by which a flow can be identified
Start timeThe time stamp indicating the start time of the flow
End time The time stamp indicating the end time of the flow
Source IP The IP address that was set in the source IP field in the IP header
Source portThe port number from which the source IP was connecting
Destination IPThe IP address that was set in the destination IP field in the IP header
Destination portThe port number from which the destination IP was connecting
PacketsThe number of packets that make up this flow
Octets The total amount of octets that make up this flows
ProtocolThe number stating the protocol that was used in this flow. This can be 17 for UDP, 6 for TCP or any other value as given by RFC 790 [48].
TCP flagsIn the case that the used protocol is TCP this field can contain the numerical representation of the used TCP flags by the packets in this flow
Netflow contains more information which can be interesting in other settings but were not of interest for this project.
The Netflow data that was captured for the project was captured during one week august in 2007 and during one week of September in 2008. The UT also gave access to real-time Netflow data.
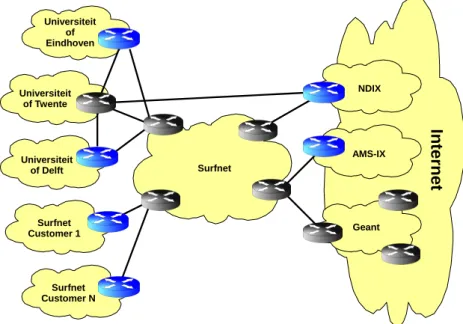
In figure 2.7 the layout can be seen of the UT, Surfnet and Geant. The Grey routers are the routers at which the Netflow data was captured. From the figure it can be seen that the UT has two paths to the Internet. One path goes via Surfnet and the other via ND-IX. The UT however also has a direct connection with the University of Delft and Eindhoven, which are not depicted in figure 2.7.
In
te
rn
et
Universiteit of Eindhoven
Universiteit of Twente
Universiteit of Delft
Surfnet Customer N Surfnet Customer 1
Surfnet
NDIX
AMS-IX
Geant
Figure 2.7: Network topology overview
2.4
The TCPdump data
TCPdump is a tool which can be used to capture traffic that arrives at a host or is sent by the host [40]. During the Netflow data capture in September 2008 the DNS traffic to and from the primary and secondary DNS server was captured. For both DNS servers the connecting switch was configured to mirror the traffic to and from the DNS server. This was done to separate DNS server operation from the traffic capturing. By using TCPdump to capture traffic it is possible to look into the content of the packets. In figure 2.8 a depiction is given of the mirror
port setup. Traffic from the DNS clients and DNS servers (bottom of figure) destined for the
DNS server is mirrored to the mirror host. Also the traffic from the DNS server to the DNS clients and DNS servers is mirrored to themirror host.
2.4. The TCPdump data
DNS server Mirror Host
Router
DNS clients & DNS servers
3
DNS statistics
In this chapter the statistics about the DNS servers and clients will be gathered from the Netflow data and the TCPdump data that was captured. By analyzing these statistics a more clear picture can be draw on the real life traffic of DNS clients and servers. In the first section the statistics that were gathered from the Netflow data will be given, and in the second section the statistics of the TCPdump data will be given.
3.1
Netflow data statistics
In this section the statistics that where gathered from the Netflow dataset that was captured in august 2007 will be discussed. Some questions were formulated that could be answered by the statistics. These questions are:
• How many DNS servers can been found in the Netflow datasets?
• Which part of the DNS traffic uses UDP and which part TCP?
• How much traffic is generated by these servers?
• How many clients connect to these servers?
In table 3.1 it can be seen that for the UT dataset only 0.91% out of all the hosts in the UT data is a DNS server. It is also visible that the UT dataset has a higher percentage of DNS servers compared to the number of active hosts. There are some possible reasons for this, namely:
• The UT Netflow data was not sampled, while the Geant and Surfnet data is sampled. This
sampling allows for scarcely contacted host to not show up in the captured data.
• The UT Domain is a network with only end users. It can be assumed that some of these
end users have routers installed with DNS software. As was described in section 2.1 these DNS servers contact other DNS servers via port 53.
• The high percentage of DNS server on the UT might be caused by scan attacks. As with
scan attacks end hosts are contacted on port 53 while they are not a DNS server but do appear as such.
By measuring the number of port scans and the number of DNS servers within the UT it could be calculated which of these three factors has the biggest impact. However in section 2.3 it was already pointed out that not all traffic from the UT to the Internet passes through Surfnet. Another issue is the unknown impact of the sampling that was done on Surfnet.
DNS servers Active Hosts % DNS servers
UT 221758 24284505 0.91%
Geant 94620 13913353 0.68%
Surfnet 196738 37655805 0.52%
Table 3.1: Balance of DNS servers against active hosts
flows packets
TCP UDP % TCP TCP UDP % TCP
UT 102487 39165510 0.26% 452530 877979727 0.05%
Geant 21375 3067913 0.70% 25436 3350307 0.76%
Surfnet 62148 22983594 0.27% 88445 36791954 0.24%
Table 3.2: Balance of TCP versus UDP DNS traffic
From RFC1035 it is known that it is possible to connect to a DNS server using both TCP and UDP [42]. The basic mode of operation for the DNS protocol is run over UDP, and only in some situations the DNS protocol uses TCP. So it is interesting to know what percentage of traffic runs over UDP and how much traffic goes over TCP.
In table 3.2 a comparison on the amount of TCP traffic is made based on flow counts and the number of packets. The reason for this comparison is that flows display to number of time frames in which TCP or UDP traffic occurred, while the number of packets displays the amount of traffic that has occurred. One would expect that either way the percentage of TCP traffic would be almost the same. It can however be seen that in the UT domain the number of packets per UDP flow far exceeds the number of packets per flow of TCP. For all of the datasets it can be seen that the number of TCP packets is larger than the number of flows, which can be expected because of the three way handshake and connection teardown packets in TCP.
The growth of the amount of UDP is explainable by looking at how you surf the Internet. In most cases an end user will browse the Internet and almost always a website will be visited that has various hostnames that need to be resolved in order to display the entire webpage. Most web browsers are made such that they will resolve a list of hostnames using the same UDP socket and thus the same source port. One thing that can be clearly seen in table 3.2 is that only a very small percentage of the DNS traffic is caused by TCP.
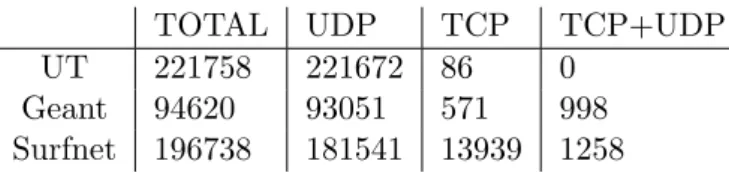
Now that it is clear that in fact there is TCP traffic it is interesting to know how many DNS servers are only contacted using TCP or using both TCP and UDP. In table 3.3 it can be seen that there are some DNS servers that are only contacted via TCP, a reasonable assumption here could be that these DNS servers are contacted from other DNS servers. As stated in section 2.1 in most cases TCP will be used after a UDP address resolution has failed, so it can be expected that the amount of DNS servers with both incoming TCP and UDP connection is large.
TOTAL UDP TCP TCP+UDP
UT 221758 221672 86 0
Geant 94620 93051 571 998
Surfnet 196738 181541 13939 1258
3.2. TCPdump traffic statistics
DNS packets total packets %
UT 920362476 32496256228 2.83 %
Geant 5379771 411652992 1.31 %
Surfnet 63317097 2286917973 2.77 %
Table 3.4: Amount of DNS traffic compared to total traffic
In table 3.4 the ratio between the total number of captured packets and the amount of captured DNS packets can be seen. For the UT and Surfnet an almost equal percentage of packets is for the DNS service. However for Geant this percentage is only half. The reason for this much lower amount of DNS packets is unclear. A reason might be that Geant in relation
to the UT and Surfnet is a transient1 network. The UT and Surfnet will have numerous end
hosts contacting their local DNS server. For only a certain amount of queries does the local DNS server need to do recursive DNS lookups. The DNS traffic that can be seen on the Geant network will mostly by these recursive queries. So the lack of the queries to a local DNS server could explain this difference.
3.2
TCPdump traffic statistics
The TCPdump data that was captured at the primary and secondary UT DNS servers was analyzed for protocol usage statistics. Some papers on statistical analysis of DNS servers exists,
some of these papers were used as a basis of identifying DNS anomalies. Wessels et al. [61]
performed a TCPdump analysis on one root server. They identified eight different DNS query
anomalies. Brownlee et al. [11] did similar measurement but had some added anomalies they
searched for. Brandhorstet al. [9] analyzed TCPdump data of traffic captured at the UT router
they searched for different DNS anomalies.
3.2.1 Measures
In this section the different anomalies that will be searched for in the TCPdump data will be described. The measures that were used by Wessels, Brownlee and Brandhorst will be described, some of which are not applicable on this TCPdump data.
Unused query class
In the DNS protocol the query class field can be set. This field is 16 bits in size but only 5 values are defined to be used, namely: IN (1), CS (2), CHAOS (3), HS (4) and ANY (255) [42]. It can be assumed that any other value for the query field is strange.
A record of an IP address
The response to an A record for a hostname will be an IP if it exists. There might however be DNS clients that ask for the A record of an IP address. This is of course a question that need not be asked by the client at all, nor should the question be recursively answered by the DNS server.
Unknown Top Level Domain
The Top Level Domains (TLD) can be separated into two groups, namely the country TLDs (.nl, .uk, etc.) and the generic TLDs (.com, .org, etc.). Currently there are 280 TLDs registered at Internet Assigned Numbers Authority (IANA) [24], any other asked for TLD should be considered as an Unknown TLD.
Non printable characters in query name
In RFC1035 it is stated that a queried name may only consist of the letters A to Z (capitalized or in lower case), numbers 0 to 9, and hyphen (-) [42]. In recent years this restriction has been lifted by extensions to the DNS protocol [31], therefore this cannot be seen as an anomaly anymore.
RFC1918
When a client queries a DNS server for a PTR record it is asking for a reverse DNS resolve. So a client wants a translation for an IP address to a hostname. In RFC1918 the network address space for intranet is specified. These addresses should not leave the intranet in which they are used. If a PTR record request is done for one of these domains then this was probably asked by a wrongly configured DNS client. The domains that RFC1918 state are:
• 10.0.0.0 - 10.255.255.255 (10/8 prefix)
• 172.16.0.0 - 172.31.255.255 (172.16/12 prefix)
• 192.168.0.0 - 192.168.255.255 (192.168/16 prefix)
Another element that was not mentioned by Wessels et al. [61] is the leakage of RFC 1918
addresses as a source address, although this has nothing to do with DNS it could contribute to the amount of repeated queries and the PTR queries done for RFC 1918 addresses.
Identical queries
If a client asks a DNS server for the same information with the same parameters ( ID, type, class, name), then these queries can be classified as identical queries. There are two reasons why identical queries are strange phenomenon’s, namely:
1. Asking the same question twice indicates a lack of response caching
2. By reusing the same query id the client is not implemented according to RFC 1035
Repeated queries
A repeated query is almost like an identical query, with the difference that the DNS client uses a different ID for every request. This gives information about the caching performed by a DNS client, because in case of repeated queries it can be assumed that this client does not cache responses at all or just for a very short period.
3.2. TCPdump traffic statistics
Referral not cached
A DNS client receives a referral when it asks a DNS server for a domain name that is part of its zone, but for which another DNS server is authoritative. For example a client gets a referral from the root DNS server to the .nl authoritative name server when it asks the root DNS server for www.utwente.nl. Now the DNS client should cache this referral. If the referral is not cached it will again query the root DNS server for a host within the .nl domain (for example www.google.nl). The problem with this query anomaly for the UT DNS servers is that a client that connect to the UT DNS servers mostly let the UT DNS server recursively resolve any query, so all the referrals are handled by the UT DNS server and not the clients. For this reason this type of anomaly was not searched for.
Error responses
As described in section 2.1.1 the response to a query will have an RCODE value. If this RCODE value is higher than zero, then the response is an error response. Error responses can be expected in any network, the amount of error responses and the reason for the error responses are of interest.
Restricted source port number
According to RFC 1700 [50] the port numbers in the range 0-1023 are considered restricted port numbers and should only be used by the registered services for those port numbers. So in the analysis the DNS clients should not be using a port number lower than 1024 to connect to a DNS server, with one exception being port 53.
Dynamic updates
Domain administrators have the option to update zone information at run time using dynamic updates [60]. Because the dynamic updates are only allowed from authorized hosts it would be strange to see other hosts trying to do dynamic updates. Any response value other than zero (NOERROR) is an indication of either a misconfiguration or an unauthorized attempt to update the zone information.
Query IDs
In every DNS packet a query ID needs to be set. In the first DNS clients and servers it was common practice to increment the ID by one every time a query was done. It has been realized that this is not a good approach as an attacker can guess the query ID very fast. The use of a Pseudo Random Number Generator (PRNG) should yield an unpredictable next query ID. However of many PRNGs that are used for different purposes including DNS server it is known that they are not random enough. A good PRNG should generate uniformly distributed values: from this it is expected that the query IDs will be equally distributed and any peaks could indicate a bad PRNG or no PRNG at all [54]. Another option to determine the randomness of
the PRNG is to use Phase Space Analysis as described by Zalewskiet al. [63].
3.2.2 Outcome
In this section the outcome of the described measures from section 3.2.1 will be given and discussed. The statistics were calculated over DNS traffic that was captured on the primary and secondary DNS of the UT using TCPdump. For the statistical analysis only the traffic over UDP was checked, because as discussed in section 3.1 only a very small amount of traffic is TCP.
Primary Secondary All General
Packets (in) 297311723 37188564 334500287
Packets (out) 330257650 43789811 374047461
Queries 297061020 37152322 334213342
Responses 277233055 32547014 309780069
Query contenta
Recursion flag 290271971 (97.7%) 30183294 (81.2%) 320455265 (95.9%)
Iterative 6789049 (2.3%) 6969028 (18.8%) 13758077 (4.1%)
Dynamic update 166194 (0.06%) 7297 (0.02%) 173491 (0.05%)
Repeated 244084071 (82.2%) 25184308 (67.8%) 269268379 (80.6%)
Identical 87885926 (29.6%) 12298620 (33.1%) 100184546 (30.0%)
RFC1918 7645 (0.003%) 10149 (0.03%) 17794 (0.005%)
RFC1918 PTR 1292212 (0.43%) 37583 (0.10%) 1329795 (0.40%)
A of IP 502230 (0.17%) 121278 (0.33%) 623508 (0.19%)
Query responsesb
No error 222082290 (80.1%) 22267032 (68.4%) 244349322 (78.9%)
Format error 175 (0.00006%) 145 (0.0004%) 320 (0.0001%)
Server failure 2648313 (0.96%) 1515671 (4.7%) 4163984 (1.3%)
No such name 51996185 (18.76%) 8677624 (26.7%) 60673809 (19.6%)
Not implemented 546 (0.0002%) 543 (0.002%) 1089 (0.0004%)
Refused 135853 (0.05%) 13398 (0.04%) 149251 (0.05%)
YXDOMAIN 72 (0.00003%) 85 (0.0003%) 157 (0.00005%)
YXRRSET 1724 (0.0006%) 147 (0.0005%) 1871 (0.0006%)
NXRRSET 19932 (0.007%) 376 (0.001%) 20308 (0.007%)
NOTAUTH 0 0 0
NOTZONE 0 28 (0.00009%) 28 (0.000009%)
aPercentages of analyzable queries. b
Percentages of analyzable responses.
Table 3.5: Client to DNS server statistics
The TCPdump analysis was separated into two domains, namely: the traffic from the clients to the UT DNS servers and the traffic from the UT DNS servers to other DNS servers. This was done because the UT DNS servers can do recursive querying and this can give interesting information about the DNS traffic.
In the analysis the traffic between port 53 and port 53 was not split according to the initiator of the conversation as this would complicate the gathering of statistics. This has the effect that some traffic is seen as queries while in fact they are responses.
Unused query class
Because of problems with the output format of TCPdump it was impossible to create a perfect working analyzing tool for finding unused query classes. During the analysis of unused query classes it was found that no extraordinary query classes were used. The analyzing tool did output some entries that it found to be unused query classes, but were in fact caused by machines performing queries with space in the domain name.
3.2. TCPdump traffic statistics
Primary Secondary All
General
Packets (in) 54189989 13340421 67530410
Packets (out) 62204411 15609917 77814328
Queries 54056327 13301903 67358230
Responses 49247103 12018641 61265744
Query contenta
Repeated 25022296 (46.3%) 7136437 (53.6%) 32158733 (47.7%)
Identical 17138 (0.03%) 17907 (0.13%) 35045 (0.05%)
A of IP 130736 (0.24%) 33378 (0.25%) 164114 (0.24%)
Query responsesb
No error 37049727 (75.2%) 8314042 (69.2%) 45363769 (74.0%)
Format error 297829 (0.6%) 79325 (0.66%) 377154 (0.62%)
Server failure 1025951 (2.1%) 653194 (5.43%) 1679145 (2.74%)
No such name 10488637 (21.3%) 2771370 (23.06%) 13260007 (21.6%)
Not implemented 1647 (0.003%) 102 (0.0008%) 1749 (0.003%)
Refused 383312 (0.78%) 200608 (1.67%) 583920 (0.95%)
aPercentages of analyzable queries. b
Percentages of analyzable responses.
Table 3.6: DNS server recursion statistics
A record of an IP address
In table 3.5 it can be seen that 0.33% of the queries done on the secondary DNS server was for the address resolution of an IP address. The output of the log files also showed the request for the IP addresses occurred at a stable amount of the entire week. In table 3.6 it can be seen that of these request the DNS server tried to recursively resolve 33378 which is 27.5% of the 121278 as stated in table 3.5. It can be seen that these numbers are lower for the primary DNS server where only 0.17% of the requests for A records of an IP address. Of these requests the primary DNS server tried to recursively resolve 26.03%. The strange part in these recursively resolved queries is that, the DNS server should not even attempt to perform these requests.
Unknown Top Level Domain
In tables 3.7(a) and 3.7(b) the top ten requested TLDs can be seen all of which are not unknown TLDs. There are however a lot of unknown TLDs that where requested the first of which is on the 31 in tables 3.8(a) and 3.8(b) the top ten most requested unknown TLDs are given. It can be seen that the percentage of times that these unknown TLDs are requested in comparison to the total amount of request done by DNS client to the DNS servers is very small. What is interesting to notice is most of these TLDs (local, lan, mshome, lokaal) are intranet domains which might indicate misconfiguration in clients.
RFC1918
The use of RFC1918 IP addresses should not occur in the UT network, however the statistics show that for the primary DNS server forty different RFC1918 IP addresses and twenty-four for the secondary were used. For both the primary and secondary DNS server a significant part
(a) Primary DNS server
Domain Amount % of queries
arpa. 136086248 45.8%
nl. 92450838 31.1%
com. 32003696 10.8%
org. 12629577 4.3%
net. 12034560 4.1%
de. 1397324 0.5%
ru. 1039119 0.3%
uk. 518342 0.2%
dk. 447350 0.2%
edu. 364042 0.1%
(b) Secondary DNS server
Domain Amount % of queries
nl. 16979042 45.7%
arpa. 6288185 16.9%
com. 5812015 15.6%
org. 2750672 7.4%
net. 2547030 6.9%
ru. 263608 0.7%
de. 251251 0.7%
dk. 160783 0.4%
info. 129839 0.3%
uk. 116850 0.3%
Table 3.7: Top 10: Requested top level domains
(a) Primary DNS server
Domain Amount % of queries
local 246872 0.08%
wpad 43915 0.01%
icehp4 40225 0.01%
lan 27120 0.009%
manticore 24924 0.008%
lokaal 22918 0.008%
mshome 22749 0.008%
nld 22347 0.008%
id 19949 0.007%
melita 19914 0.007%
(b) Secondary DNS server
Domain Amount of queries
mshome 21455 0.06%
local 17485 0.05%
wpad 13703 0.04%
gs1 8321 0.02%
localhost 6563 0.02%
lan 6234 0.02%
lokaal 4535 0.01%
nld 4407 0.01%
belkin 2888 0.008%
Table 3.8: Top 10: Requested unknown TLDs
(25% primary, 42% secondary) of the IP addresses were used more than a hundred times in a request, some even up to two thousand or more.
On the DNS servers also a lot of PTR requests where done. For the primary DNS server a total of 1292212 requests where done, and for the secondary DNS server 37583. In percentages this means that
Repeated queries
In table 3.5 it can be seen that a high percentage of the queries done on the DNS servers is a repeated query. The most probable reason that this percentage is, that most traffic to the DNS servers is from end hosts. For these end hosts the UT DNS servers are the DNS cache. For the recursion rate this means that only a small part of requests are recursively resolved (18% primary, 36% secondary).
In table 3.6 it can be seen that of all the queries still around 50% of all the queries is a repeated query. It could be expected that the UT DNS server cache enough data so that repeating a query would be almost unnecessary. There are possible reasons for these repeated queries, namely:
3.2. TCPdump traffic statistics
query the DNS server might not cache this response. In that way another recursive query to be done for the same query.
• Recursion: When a DNS server performs a recursive query operation it will in some cases query different DNS servers with the same query.
• Cache expiration: As stated in section 2.1 on page 5 some Domains use the DNS system for load balancing, this is done by setting the expiration timer of the result set to a very low value. This will lead to an increase in the number of requests for the same name. It is unclear which of these possibilities has the biggest impact.
Identical queries
It should be expected that clients will not use identical query IDs let alone totally identical queries. However in table 3.5 it can be seen that about 30% of all the queries done is identical. This means that of around 40% of all the repeated queries is in fact an identical query (36% primary, 49% secondary). In table 3.6 it can be seen that only a small amount of the recursively performed queries is an identical query. Although this amount is low it is still strange to so this amount as it should be expected that the UT DNS servers have a good PRNG and perform no identical queries at all. One reason for these indentical queries by DNS servers is that these queries are actually responses to identical queries from DNS client.
Error responses
In tables 3.5 and 3.6 it can be seen that most error types happen only scarcely. The two errors
that stand out are theserver failure and no such name. The no such name error with its 20%
overall is the largest contributor to error responses. From the log files it has become clear that
most of theseno such name errors can be attributed to DNS blacklist querying. Of theserver
failure errors 58% was caused by reverse DNS lookups. The other server failure errors were caused by DNS queries to a lot of different domains.
Restricted source port number
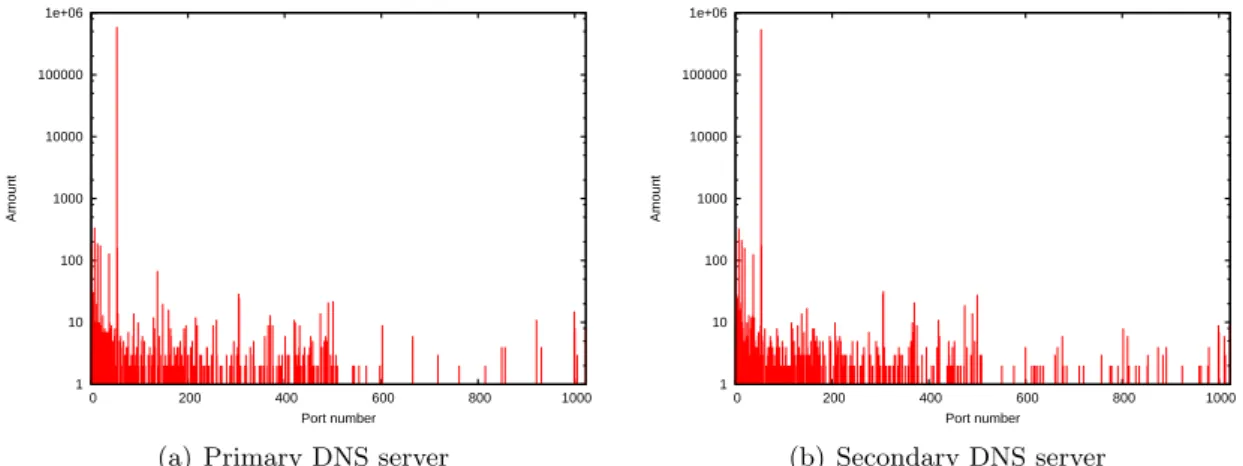
In figures 3.1(a) and 3.1(b) the distributions of the used source port numbers can be seen as used by DNS clients. It can be seen that the usage of the source ports is equally distributed. This means that there are DNS client that don’t use a good random source port number. It can also be seen that there are request done using low source port numbers. In figures 3.2(a) and 3.2(b) the usage of the restricted port numbers is show in more detail. The peak for port 53 is because of DNS server that use source port 53 to perform recursive queries. But there are also normal clients that use source port 53 to contact the DNS server.
In figures 3.3(a) and 3.3(b) the distribution can be seen of the UT DNS servers recursive querying. It can be seen that both DNS servers have a nicely balanced use of source port numbers and do not appear to use restricted port numbers. The peak for port 53 in figures 3.3(a) and 3.3(b) is caused by response traffic from client connecting from source port 53. For these situations there is traffic from port 53 to port 53.
Dynamic updates
In table 3.5 it can be seen that from the requests to the UT DNS servers only a very small part was a Dynamic update query. Almost all of these requests where responded to with an error response. Most of the error responses that where sent in reaction to a Dynamic update query
1 10 100 1000 10000 100000 1e+06 1e+07
0 10000 20000 30000 40000 50000 60000 70000
Amount
Port number
(a) Primary DNS server
1 10 100 1000 10000 100000 1e+06
0 10000 20000 30000 40000 50000 60000 70000
Amount
Port number
(b) Secondary DNS server
Figure 3.1: Source port distribution DNS clients
1 10 100 1000 10000 100000 1e+06
0 200 400 600 800 1000
Amount
Port number
(a) Primary DNS server
1 10 100 1000 10000 100000 1e+06
0 200 400 600 800 1000
Amount
Port number
(b) Secondary DNS server
Figure 3.2: Source port usage Restricted range DNS clients
100 1000 10000 100000
0 10000 20000 30000 40000 50000 60000 70000
Port number
Amount
(a) Primary DNS server
100 1000 10000 100000
0 10000 20000 30000 40000 50000 60000 70000
Port number
Amount
(b) Secondary DNS server
3.2. TCPdump traffic statistics
1000 10000 100000 1e+06 1e+07 1e+08
0 10000 20000 30000 40000 50000 60000 70000
Packets with ID
Query ID
(a) Primary DNS server
100 1000 10000 100000 1e+06 1e+07
0 10000 20000 30000 40000 50000 60000 70000
Packets with ID
Query ID
(b) Secondary DNS server
Figure 3.4: Query ID distribution DNS client
100 1000 10000
0 10000 20000 30000 40000 50000 60000 70000
Packets with ID
Query ID
(a) Primary DNS server
10 100 1000 10000
0 10000 20000 30000 40000 50000 60000 70000
Packets with ID
Query ID
(b) Secondary DNS server
Figure 3.5: Query ID distribution UT DNS servers
Query IDs
In figures 3.4(a) and 3.4(b) the query ID distribution can be seen for the DNS traffic towards the DNS servers. In both figures it is clearly visible that there are large peaks for certain query IDs, this is a indication for the existence of badly implemented DNS clients that either use a fixed query id or have a poor PRNG. In figure 3.4(b) it can also be seen that the usage of specific query IDs fluctuates a lot. This fluctuation is a clear indication that some DNS clients use poor PRNGs, as with the use of good PRNG an almost uniformly distributed figure should be visible. In figures 3.5(a) and 3.5(b) the query ID distribution can be seen of the DNS traffic generated by the UT DNS servers. It can be seen the UT DNS servers also do not have a uniformly distributed query ID usage. It can however be seen that apart from the increased usage of low query ID number the usage of most query IDs is evenly distributed. The peaks that appear with both DNS servers indicate an increased probability that one of these numbers is chosen. However if only looking at these numbers there is only a chance of approximately 0.015 percent that an attack can choose the right number, which is not very likely.
3.3
Summary
In this chapter it has been shown that only a small portion of the traffic on the Geant, Surfnet and UT network is caused by the DNS service. It has also been show that the UT DNS servers are primarily asked to answer a query in recursively, and that they only do this for approximately one sixth of the time. The statistics show that the DNS clients on the UT are not very smart client, this can be seen from the fact that approximately eighty procent of all the traffic are repeated queries or even identical queries. This can also be seen in the fact that address resolution is asked for IP addresses and the not uniformly distributed usage of source port or query IDs by the DNS clients.
4
Attack overview
Over the years attackers have found new ways to perform attacks to circumventing defenses laid down to protect against previous types of attacks. In this chapter the different types of attacks that involve DNS server will be described. The attacks involving DNS servers can be classified into two groups, namely:
• The attacks targeting DNS servers
• The attacks using DNS servers, to target some other system
In section 1 the basic types of Denial of Service (DoS) attacks will be described which can target DNS servers. After which a short description of attacks that target DNS server will be given in section 2, and in section 3 the attacks using DNS servers will be described. Finally in section 4 a detailed description will be given on identifiable traffic characteristics of the attacks as described in sections 2 and 3.
4.1
Types of DoS attacks
DoS are a known phenomenon on the Internet. It can be expected that DNS servers are also potential targets for a DoS attack. In this section the basics of a DoS attack as can be found in literature is described.
Before discussing the types of attacks let us first look at the flaw that is used in almost all DoS attacks. The flaw that is exploited is the absence of header security in IPv4, as can be seen in figure 4.1. The header of IPv4 holds the source and destination address of a packet. In a normal connection the source address of a packet would be set to your address, while the destination would be the address of the server you want to connect to [5]. By changing the source address to a different address than your own it is almost impossible to trace back where the packet came from or it can be used to attack a victim. In most networks nowadays network administrators are using ingress filter to disallow users within their domain to spoof their IP address [19]. Also egress filters are installed to disallow traffic for outside the domain to use IP addresses from within the domain [10].
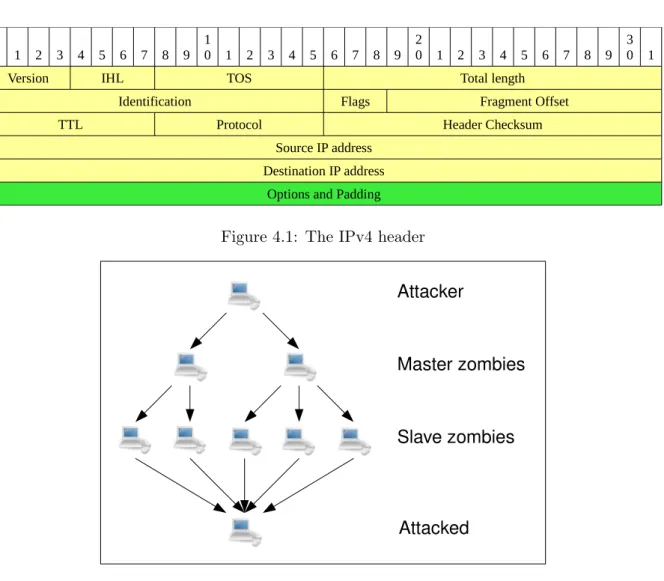
Figure 4.2 depicts a DoS attack. From this figure the path from an attacker to the attacked host can be seen. Four actors can be distinguished in the figure, namely:
• Attacker: The attacker is the actor which initiates the attack. In many cases there is not just one attacker but multiple attackers which try to keep a host or network of the Internet for as long as possible.
0
0 1 2 3 4 5 6 7 8 9 10 1 2 3 4 5 6 7 8 9 20 1 2 3 4 5 6 7 8 9 30 1
Version IHL TOS Total length
Identification Flags Fragment Offset
TTL Protocol Header Checksum
Source IP address Destination IP address
Options and Padding
Figure 4.1: The IPv4 header
Attacker
Master zombies
Slave zombies
Attacked
Figure 4.2: A DDoS attack using Botnets
• Master zombie: An attacker will in most cases use a number of botnets. The program used by the attacker to initiate an attack using a specific botnet is the Master zombie.
• Slave zombie: When a Master zombie is given a command to execute, it will pass this command to the Slave zombies it controls which will then execute the command.
• Attacked: The attacked is the host or network that is being targeted by the attacker. These actors are common elements in DoS attacks. Attackers that perform a DoS attack are focused on disrupting a server by consuming resources of the server, which can be either the CPU, memory or bandwidth. The three types of DoS attacks that can be distinguish are:
• DoS attacks: This type of attack is the most basic. It is initiated by one or more hosts run by the attackers themselves. In most cases to make an attack of this type successful against a server, a lot of hosts need to participate, otherwise an attack will not take a large enough part of the bandwidth to take the server of the Internet. An attacker will in most cases exploit a flaw in the software of the server. That way a server can be forced to consume more resources with less effort [39]. Figure 4.3 shows what a DoS attack looks
like. In DoS attacks the attacker will use a randomly generated IPv4 source address, if
possible.
An example of a DoS attack is the SYN flood, which uses a the TCP SYN packet to create half open TCP connections on the server, which lead to the server having a massive pool