Reducing the impact of substance abuse and mental illness on America’s communities. Behavioral Health is Essential To Health • Prevention Works • Treatment is Effective • People Recover
www.samhsa.gov • 1-877-SAMHSA-7 (1-877-726-4727)
·
CFDA 93.958 (Mental Health)
FY 2012
Table of Contents
A. Introduction
B. Implementation Report
C. State Agency Expenditure Report
D. Population and Services Report
Section A. Introduction
Title XIX, Part B, Subpart III of the Public Health Service Act (42 U.S.C. 300x-52(a)) requires the Secretary of the Department of Health and Human Services, acting through the Administrator of the Substance Abuse and Mental Health Services Administration (SAMHSA), to determine the extent to which States and Jurisdictions have implemented the State plan for the prior fiscal year. The purpose of the Annual Report is to provide information to assist the Secretary in making this determination.
States and jurisdictions are requested to prepare and submit their reports for the last completed fiscal year in the format provided in this guidance. The report will address the purposes for which the MHBG and SABG funds were expended, the recipients of grant funds, and the authorized activities and services purchased with such funds. Particular attention should be given to the progress made toward accomplishing the goals and performance indicators identified in the States’ and Jurisdictions’ plans.
All States are required to prepare and submit their respective reports utilizing SAMHSA’s Web Block Grant Application System (BGAS). This report must be received by SAMHSA not later than December 1 in order for State or Jurisdiction to receive a grant for the subsequent Federal fiscal year. If the due date falls on a weekend or Federal holiday, the report will be due on the next business day. The following schedule provides specific due dates for annual reports:
Plan and Repor t Receipt Dates Application for
Feder al fiscal year
Plan Receipt Date
Planning Per iod Repor t Receipt Date
Repor t Per iod
2012 9/01/2011 10/01/2011 –
06/30/2013
12/01/2011 10/01/2010 -09/30/2011
2013 12/01/2012 07/01/2011
-06/30/2012
2014 04/01/2013 07/01/2013
-06/30/2015
12/01/2013 07/01/2012 – 06/30/2013
2015 12/01/2014 07/01/2013 –
06/30/2014
2016 04/01/2015 07/01/2015 –
06/30/2017
12/01/2015 07/01/2014 – 06/30/2015
2017 12/01/2016 07/01/2015
-06/30/2016
States are required to complete the Reporting Document. The reporting Document is comprised of the following sections:
Section B: Implementation Report - In this first section, States are required to provide a brief review of the extent to which their respective plans were implemented, the progress towards the priorities and goals identified in the Block Grant application. The report should also include a brief review of areas that the State identified in Block Grant Application as needing
improvement and changes that the State and Jurisdiction would propose to achieve the goals established for the priorities.
Section C: State Agency Expenditure Report - In this section, States should provide information regarding expenditures for authorized activities and services for mental health (and substance abuse prevention, and substance abuse treatment if submitting combined report).
Section D: Populations and Services Report - In this section, States and Jurisdictions must provide specific information regarding the number of individuals that were served with MHSBG funds. In addition, States and Jurisdictions should provide specific information regarding the services these individuals received.
Section E: Performance Indicators and Accomplishments - In this section of the report, States and Jurisdictions are required to complete the Performance Indicator tables. Performance indicators should be reported using the table format provided in this document. The purpose of the performance indicator tables is to show progress made over time as measured by SAMHSA’s National Outcome Measures (NOMS) for mental health services as well as any State- or
B. Implementation Report
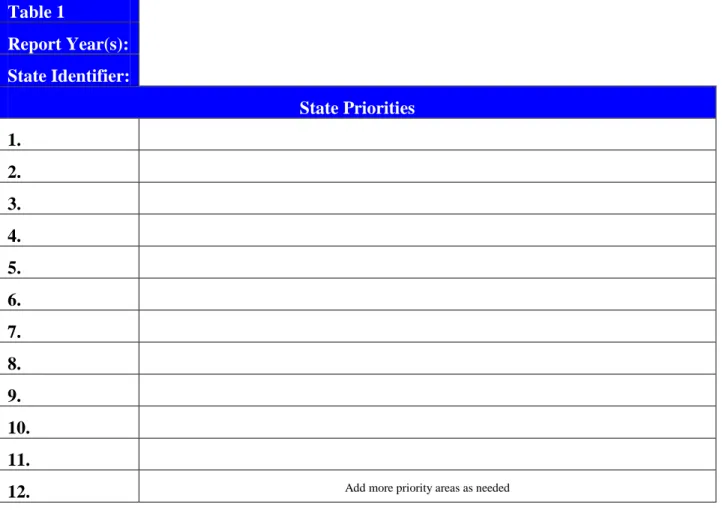
Table 1: As part of the planning section, States identified their priorities in addition to the joint planning areas and the statutorily required priorities. This table should be filled out for all priority areas that the State will focus on during the planning period. The same table will be used to capture progress reporting.
Table 1
Report Year(s): State Identifier:
State Priorities 1.
2. 3. 4. 5. 6. 7. 8. 9. 10. 11.
12. Add more priority areas as needed
At the end of each priority area, States and Jurisdictions should clearly indicate whether or not the particular goal identified in the State plan for the prior State fiscal year was “achieved” or “not achieved.” If a target was “not achieved,” a detailed explanation must be provided.
Table 2, Priority Area by Goal, Strategy, and Performance Indicator, should be completed for each priority areas identified by States and Jurisdictions in their respective State plans and for which fiscal resources were expended during the prior State fiscal year.
Table 2
Report Year(s): State Identifier: Priority Area: Goal:
Strategy: (use as many lines as needed for each strategy) Performance Indicator:
Description of Collecting and Measuring Changes in Performance Indicator:
Report of Progress toward goal attainment in prior State Fiscal Year: ____ Achieved _____ Not Achieved (if not achieved, explain why)
C. Expenditure Reports
Mental Health Services Block Grant Spending
States and Jurisdictions should provide information regarding MHBG and State general revenue funds expended for authorized activities to prevent and treat mental illness. Please complete the tables described below: Please Note: Data for all tables contained in the Uniform
Reporting System (URS) will continue to be submitted into the URS data base maintained by the URS Contractor.
• Table 3A and 3B (URS Tables 5A and 5B). Profile of Clients by Type of Funding
Support. Table 3A and 3B is to provides the number of Female and Male clients by race and by ethnicity that have: Medicaid Only, Non-Medicaid Sources, Both Medicaid and Non-Medicaid, and Status not available.
• Table 4 (URS Table 7). Profile of Mental Health Service Expenditures and Sources of
Funding. Table 4 is to provide information on Mental Health Expenditures and Sources of Funding. This includes funding from Medicaid, the MHSBG. Other federal funding sources, state, local and other funds.
• Table 5 (NEW). MHSBG Expenditures By Service. Table 5 is to be used to provide
information on MHSBG spending by unduplicated individual and specific services.
• Table 6 (NEW) Primary Prevention Expenditures Checklist. This table provides a
description of MHSBG Block Grant expenditures on primary prevention strategies funded by State Mental Health Authority.
• Table 7(URS Table 8). Profile Of Community Mental Health Block Grant Expenditures
For Non-Direct Service Activities. Table 7 is used to describe the use of MHSBG funds for non-direct service activities that are sponsored, or conducted by the State Mental Health Authority
• Table 8(URS Table 10). – Statewide Entity Inventory. This table provides a description of the recipients of MHSBG funds including intermediaries, e.g., administrative service organizations, and other organizations which provided mental health services during the prior State fiscal year. The table has been amended to include recipients of SAPTBG funds for those states submitting one application.
• Table 9 (NEW) - Maintenance of Effort for State Expenditures on Mental Health
Services. This table provides a description of all State non-Federal expenditures for authorized activities to prevent and treat mental illness during each State fiscal year.
• Table 10 (NEW) – Report and Set-aside for Children’s Mental Health Services. This
table provides a description of non-Federal funds expended for children’s mental health services during each State fiscal year (SFY).
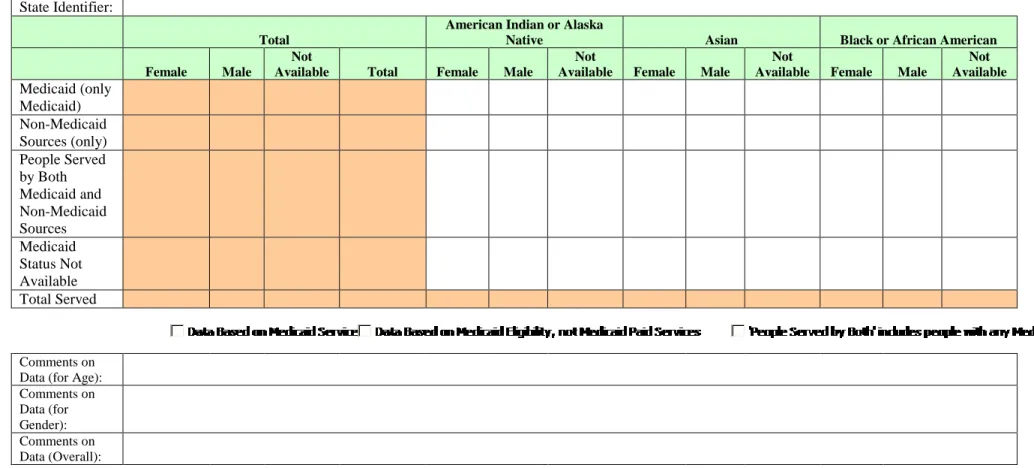
Table 3A. (URS Table 5A) Profile of Clients by Type of Funding Support
This table provides a summary of clients by Medicaid coverage. Since the focus of the reporting is on clients of the public mental health service delivery system, this table focuses on the clientele serviced by public programs that are funded or operated by the State Mental Health Authority. Persons are to be counted in the Medicaid row if they received a service reimbursable through Medicaid.
Please note that the same person may be served in both Medicaid and Non-Medicaid programs during the same reporting period.
Table 3A
Report Year: State Identifier:
Total
American Indian or Alaska
Native Asian Black or African American
Female Male
Not
Available Total Female Male
Not
Available Female Male
Not
Available Female Male
Not Available
Medicaid (only
Medicaid)
Non-Medicaid
Sources (only)
People Served by Both Medicaid and Non-Medicaid
Sources
Medicaid Status Not
Available
Total Served
Comments on Data (for Age):
Comments on Data (for Gender):
Comments on Data (Overall):
Each row should have a unique (unduplicated) count of clients: (1) Medicaid Only, (2) Non-Medicaid Only, (3) Both Medicaid and Other Sources funded their treatment, and (4) Medicaid Status Not Available.
If a state is unable to unduplicate between people whose care is paid for by Medicaid only or Medicaid and other funds, then all data should be reported into the 'People Served by Both Medicaid and Non-Medicaid Sources' and the 'People Served by Both includes people with any Medicaid' check box should be checked.
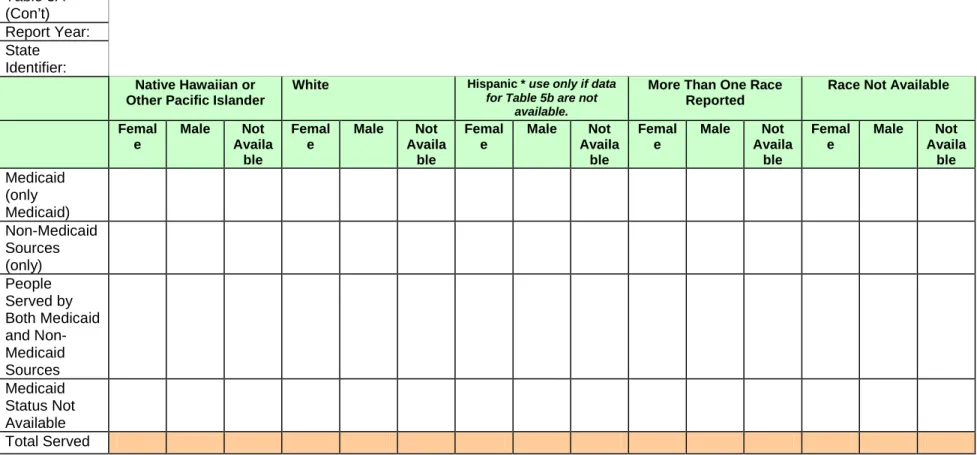
(continued on next page)
Table 3A (Con’t) Report Year: State Identifier:
Native Hawaiian or Other Pacific Islander
White Hispanic * use only if data
for Table 5b are not available.
More Than One Race Reported
Race Not Available
Femal e
Male Not Availa
ble
Femal e
Male Not Availa
ble
Femal e
Male Not Availa
ble
Femal e
Male Not Availa
ble
Femal e
Male Not Availa ble Medicaid (only Medicaid) Non-Medicaid Sources (only) People Served by Both Medicaid and Non-Medicaid Sources Medicaid Status Not Available Total Served
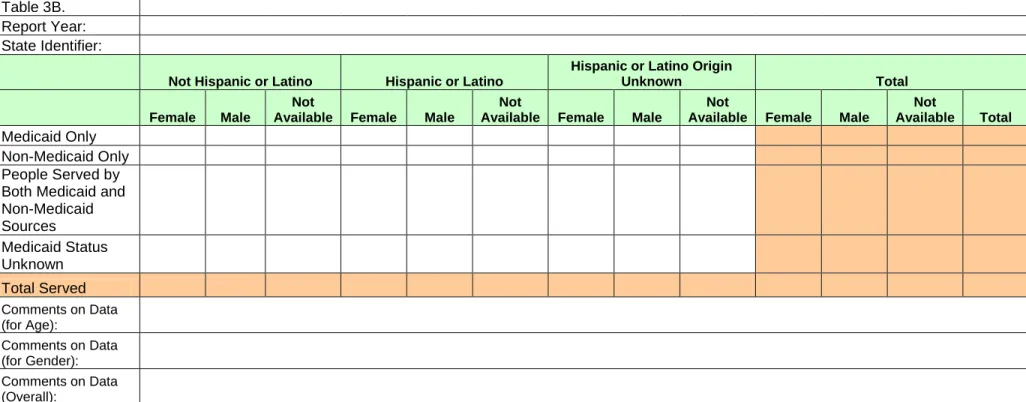
Table 3B. (URS Table 5B) Profile of Clients by Type of Funding Support
Of the total persons covered by Medicaid, please indicate the gender and number of persons who are Hispanic/Latino or not Hispanic/Latino. Total persons covered by Medicaid would be the total indicated in Table 3A.
Please note that the same person may be served in both Medicaid and Non-Medicaid programs during the same reporting period.
Table 3B.
Report Year:
State Identifier:
Not Hispanic or Latino Hispanic or Latino
Hispanic or Latino Origin
Unknown Total
Female Male
Not
Available Female Male
Not
Available Female Male
Not
Available Female Male
Not
Available Total
Medicaid Only
Non-Medicaid Only
People Served by Both Medicaid and Non-Medicaid
Sources
Medicaid Status
Unknown
Total Served
Comments on Data (for Age):
Comments on Data (for Gender):
Comments on Data (Overall):
Each row should have a unique (unduplicated) count of clients: (1) Medicaid Only, (2) Non-Medicaid Only, (3) Both Medicaid and Other Sources funded their treatment, and (4) Medicaid Status Unknown.
Table 4 (URS Table 7): Profile of Mental Health Service Expenditures and Sources of Funding
This table describes expenditures for public mental health services provided or funded by the State mental health agency by source of funding.
Table 4
Report Year: State Identifier:
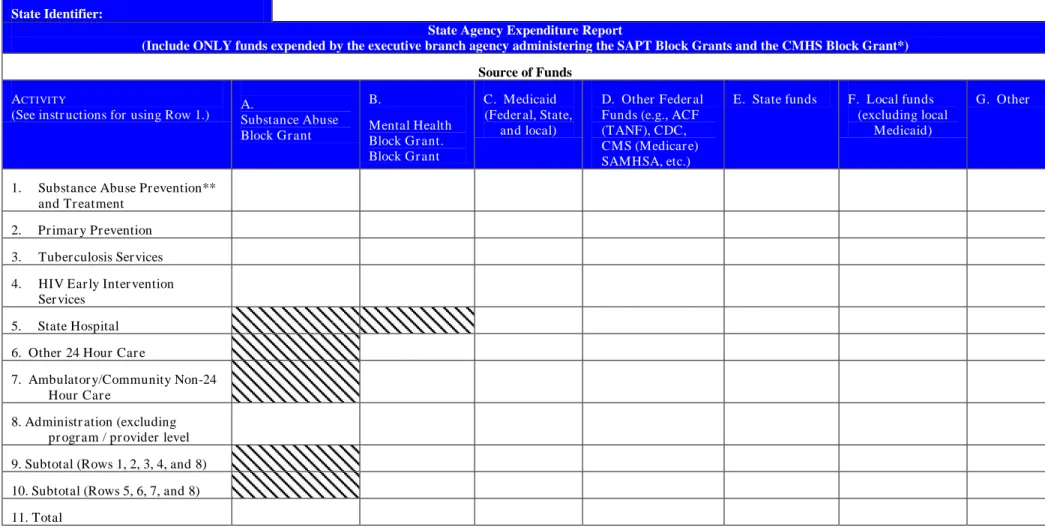
State Agency Expenditure Report
(Include ONLY funds expended by the executive branch agency administering the SAPT Block Grants and the CMHS Block Grant*)
Source of Funds
ACTIVITY
(See instr uctions for using Row 1.) A. Substance Abuse Block Gr ant
B.
Mental Health Block Gr ant. Block Gr ant
C. Medicaid (Feder al, State,
and local)
D. Other Feder al Funds (e.g., ACF (TANF), CDC, CMS (Medicar e) SAMHSA, etc.)
E. State funds F. Local funds (excluding local
Medicaid)
G. Other
1. Substance Abuse Pr evention** and Tr eatment
2. Pr imar y Pr evention 3. Tuber culosis Ser vices 4. HIV Ear ly Inter vention
Ser vices 5. State Hospital 6. Other 24 Hour Car e
7. Ambulator y/Community Non-24 Hour Car e
8. Administr ation (excluding pr ogr am / pr ovider level 9. Subtotal (Rows 1, 2, 3, 4, and 8) 10. Subtotal (Rows 5, 6, 7, and 8) 11. Total
* States and Jurisdictions may utilize a single table to report expenditures for the SAPT and CMHS Block Grants if a State or Jurisdiction submits a single report to SAMHSA**Prevention other than Primary Prevention
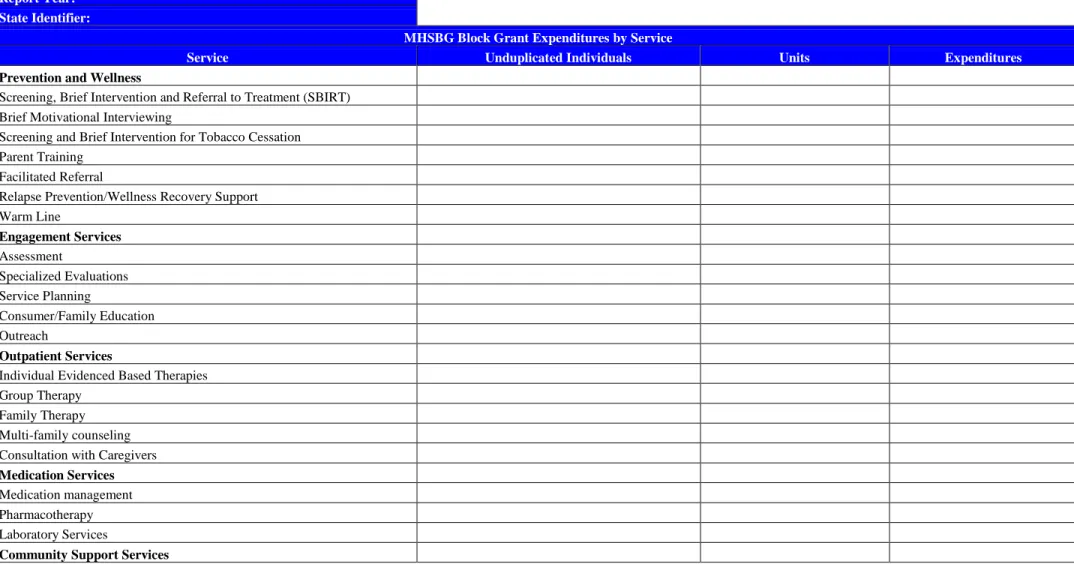
Table 5 (NEW): MHSBG Expenditures by Service Table 5
Report Year: State Identifier:
MHSBG Block Grant Expenditures by Service
Service Unduplicated Individuals Units Expenditures
Prevention and Wellness
Screening, Brief Intervention and Referral to Treatment (SBIRT)
Brief Motivational Interviewing
Screening and Brief Intervention for Tobacco Cessation
Parent Training
Facilitated Referral
Relapse Prevention/Wellness Recovery Support
Warm Line
Engagement Services
Assessment
Specialized Evaluations
Service Planning
Consumer/Family Education
Outreach
Outpatient Services
Individual Evidenced Based Therapies
Group Therapy
Family Therapy
Multi-family counseling
Consultation with Caregivers Medication Services
Medication management
Pharmacotherapy
Laboratory Services
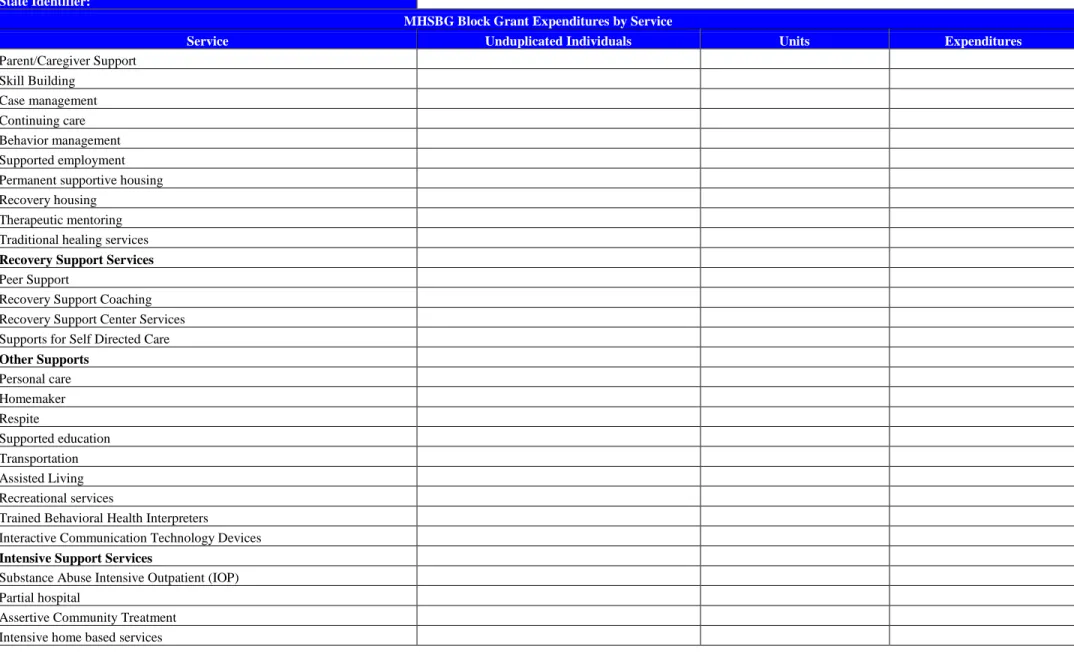
Table 5 Report Year: State Identifier:
MHSBG Block Grant Expenditures by Service
Service Unduplicated Individuals Units Expenditures
Parent/Caregiver Support
Skill Building
Case management
Continuing care
Behavior management
Supported employment
Permanent supportive housing
Recovery housing
Therapeutic mentoring
Traditional healing services
Recovery Support Services
Peer Support
Recovery Support Coaching
Recovery Support Center Services
Supports for Self Directed Care
Other Supports
Personal care
Homemaker
Respite
Supported education
Transportation
Assisted Living
Recreational services
Trained Behavioral Health Interpreters
Interactive Communication Technology Devices
Intensive Support Services
Substance Abuse Intensive Outpatient (IOP)
Partial hospital
Assertive Community Treatment
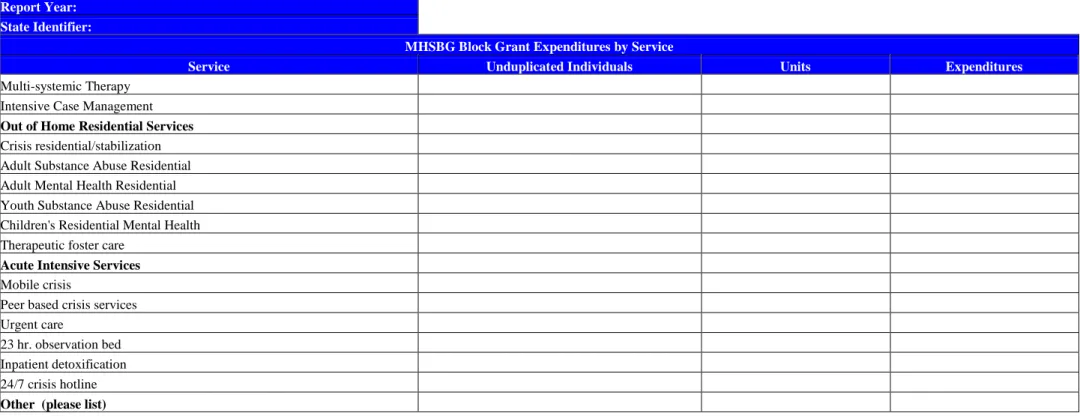
Table 5 Report Year: State Identifier:
MHSBG Block Grant Expenditures by Service
Service Unduplicated Individuals Units Expenditures
Multi-systemic Therapy
Intensive Case Management
Out of Home Residential Services
Crisis residential/stabilization
Adult Substance Abuse Residential
Adult Mental Health Residential
Youth Substance Abuse Residential
Children's Residential Mental Health
Therapeutic foster care
Acute Intensive Services
Mobile crisis
Peer based crisis services
Urgent care
23 hr. observation bed
Inpatient detoxification
24/7 crisis hotline
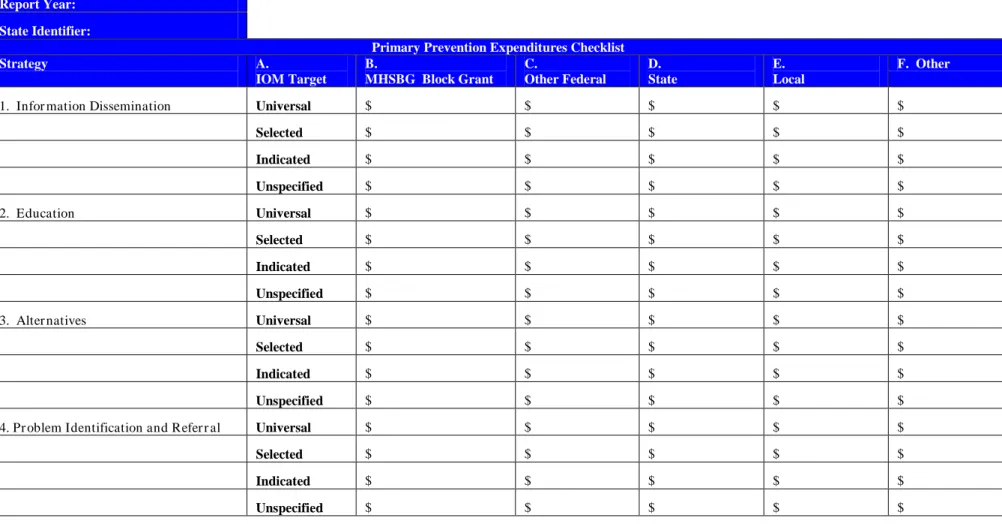
Table 6 (NEW): Primary Prevention Expenditure Checklist
*Please lit all sources, if possible (e.g.., Centers for Disease Control and Prevention, Block Grant, foundations, etc.)
Table 6
Report Year:
State Identifier:
Primary Prevention Expenditures Checklist
Strategy A.
IOM Target
B.
MHSBG Block Grant
C.
Other Federal
D. State
E. Local
F. Other
1. Infor mation Dissemination Universal $ $ $ $ $
Selected $ $ $ $ $
Indicated $ $ $ $ $
Unspecified $ $ $ $ $
2. Education Universal $ $ $ $ $
Selected $ $ $ $ $
Indicated $ $ $ $ $
Unspecified $ $ $ $ $
3. Alter natives Universal $ $ $ $ $
Selected $ $ $ $ $
Indicated $ $ $ $ $
Unspecified $ $ $ $ $
4. Pr oblem Identification and Refer r al Universal $ $ $ $ $
Selected $ $ $ $ $
Indicated $ $ $ $ $
5. Community-Based Pr ocesses Universal $ $ $ $ $
Selected $ $ $ $ $
Indicated $ $ $ $ $
Unspecified $ $ $ $ $
6. Envir onmental Universal $ $ $ $ $
Selected $ $ $ $ $
Indicated $ $ $ $ $
Unspecified $ $ $ $ $
7. Section 1926-Tobacco Universal $ $ $ $ $
Selected $ $ $ $ $
Indicated $ $ $ $ $
Unspecified $ $ $ $ $
8. Other Universal $ $ $ $ $
Selected $ $ $ $ $
Indicated $ $ $ $ $
Table 7 (URS Table 8): Profile of Community Mental Health Block Grant Expenditures for Non-Direct Service Activities
This table is used to describe the use of CMHS BG funds for non-direct service activities that are sponsored, or conducted, by the State Mental Health Authority.
PLEASE DO NOT ADD, DELETE OR MOVE ROWS, COLUMNS AND/OR CELLS!
Table 7
Report Year:
State Identifier:
Profile of Community Mental Health Block Grant Expenditures for Non-Direct Service Activities
Service Estimated Total Block Grant
MHA Technical Assistance Activities
MHA Planning Council Activities
MHA Administration
MHA Data Collection/Reporting
MHA Activities Other Than Those Above
Total Non-Direct Services
Comments on Data:
Instructions:
1. States should only report on the expenditures of the CMHBG by the SMHA or programs that they directly contract with.
2. States should not report on expenditures by programs more than one-level down from the State in funding: e.g., if a state provides CMHBG funds to county mental health authorities, which in turn contract with private, not-for-profit mental health providers, only the expenditures by the SMHA and the county mental health authorities should be reported in this table.
Table 8 (URS Table 10). Statewide Entity Inventory
Table 88 Report Year: State Identifier:
Entity Inventory
Source of Funds
State SAPT Block Grant CMHS Block Grant
A B B D E F G
Entity Number I-SATS ID (for SABG) Area Served (Statewide or Sub-State Planning Area) Provider/Program Name Street Address
City State Zip Prevention (other than primary prevention) and Treatment Services Pregnant Women and Women with Dependent Children Primary Prevention Early Intervention Services for HIV
Adults with serious mental illness
Children with a serious emotional disturbance
$ $ $ $ $ $ $
$ $ $ $ $ $ $
Table 9 (NEW). Maintenance of Effort for State Expenditures on Mental Health Services Table 9:
Report Year: State Identifier:
Total Expenditures for SMHA _____
Period
A
Expenditures
B
B1 (2009) + B2 (2010) 2
C SFY 2009
(1) SFY 2010
(2) SFY 2011
(3)
Are the expenditure amounts reported in Column B “actual” expenditures for the State fiscal years involved?
FY 2009 Yes_____ No_____
FY 2010 Yes_____ No_____
FY 2011 Yes_____ No_____
If estimated expenditures are provided, please indicate when “actual” expenditure data will be submitted to SAMHSA: ___/___/_________
Table 10(NEW): Report on Set-Aside for Children’s Mental Health Services Table 10:
Report Year: State Identifier:
State Expenditures for Mental Health Services
Actual SFY 2008 Actual SFY 2012 Actual SFY 2013
States are required to not spend less than the amount expended in FY 2008. This is a change from the previous year, when the baseline for the state expenditures was 1994.
D. Populations and Services Report
States are requested to provide information regarding individuals that are served by the state mental health authority for FY 2011 using Tables 11 through 15.
• Table 11 (URS Table 1). Profile of the State Population by Diagnosis. Table 11 provides the number of Adults with SMI and Children with SED in the reporting year and in three years forward.
• Table 12 (URS Table 12) . State Mental Health Agency Profile. Table 12 provides the
Populations covered in State hospitals and Community program in age categories; 0-3, 4-17 and 18 and above.
• Table 13A and 13B (URS Tables 2A and 2B) Profile of Persons Served, All Programs by
Age, Gender and Race/Ethnicity. Table 13 provides an aggregate profile of unduplicated persons in the reporting year. The reporting year should be the latest state fiscal year for which data are available. This profile is based on a client receiving services in programs provided or funded by the state mental health agency. The client profile takes into account all institutional and community services for all such programs. States are to provide this information on all programs by age, gender, race/ethnicity.
• Table 14 (URS Table 3). Profile Of Persons Served In The Community Mental Health
Settings, State Psychiatric Hospitals And Other Settings. Table 14 provides an aggregate profile of unduplicated persons in the reporting year for services funded through the MHSBG. The reporting year should be the latest state fiscal year for which data are available. This profile is based on a client receiving services in programs provided or funded by the MHSBG. The client profile takes into account all institutional and community services for all such programs. States are to provide this information on all programs by age, gender, race/ethnicity.
• Tables 15A,15B and 15C (NEW, URS Tables 14A and 14B). Profile of Persons With
SMI/SED Served By Age, Gender And Race/Ethnicity. Tables 15A, B and Crequest counts for persons with SMI or SED using the definitions provided by the CMHS. Tables 15A, B and C included individuals receiving services in programs provided or funded by the state mental health agency. These tables count only clients who meet the CMHS definition of SMI or SED. States should report using the Federal Definitions of SMI and SED if they can report them, if not, please report using your state’s definitions of SMI and SED and provide information in these tables describing your state’s definition.
• Table 16 (URS Table 5). Profile of Client Turnover. Table 16 requests information
regarding the profile of client turnover in various out of home settings (e.g. state hospitals, inpatient psychiatric hospitals, residential treatment centers). Information collected by this table requests admissions, discharges, and length of stay.
Table 11 (URS Table 1). Profile of the State Population by Diagnosis
This table summarizes the estimates of adults residing within the State with serious mental illness (SMI) and children residing within the state with serious emotional disturbances (SED). The table calls for estimates for two time periods, one for the report year and one for three years into the future. CMHS will provide this data to States based on the standardized methodology developed and published in the Federal Register and the State level estimates for both adults with SMI and children with SED.
Table 11
Report Year:
State Identifier:
Current Report Year Three Years Forward
Adults with Serious Mental Illness (SMI)
Children with Serious Emotional Disturbances (SED)
Note: This Table will be completed for the States by CMHS.
The purpose of this profile is to obtain information that provides a context for the data provided in the tables. This profile covers the populations served, services for which the state mental health agency is responsible, data reporting capacities, especially related to duplication of numbers served as well as certain summary administrative information.
PLEASE DO NOT ADD, DELETE OR MOVE ROWS, COLUMNS AND/OR CELLS!
Table 12
Report Year:
State Identifier:
Populations Served
1 Which of the following populations receive services operated or funded by the state mental health agency? Please indicate if they are included in the data provided in the tables. (Check all that apply.)
Populations Covered Included in Data
State Hospitals Community Programs State Hospitals
Community Programs
1. Aged 0 to 3
2. Aged 4 to 17
3. Adults Aged 18 and over
4. Forensics
Comments on Data:
2 Do all of the adults and children served through the state mental health agency meet the Federal definitions of serious mental illness and serious emotional disturbances?
2.a. If no, please indicate the percentage of persons served for the reporting period who met the federal definitions of serious mental illness and serious emotional disturbance?
2.a.1 Percent of adults meeting Federal definition of SMI:
2.a.2 Percentage of children/adolescents meeting Federal definition of SED
3 Co-Occurring Mental Health and Substance Abuse:
3.a. What percentage of persons served by the SMHA for the reporting period have a dual diagnosis of mental illness and substance abuse?
3.a.1
3.a.2. Percentage of children/adolescents served by the SMHA who also have a diagnosis of substance abuse
problem:
3.b. What percentage of persons served for the reporting period who met the Federal definitions of adults with SMI and children/adolescents with SED have a dual diagnosis of mental illness and substance abuse.
3.b.1 Percentage of adults meeting Federal definition of SMI who also have a diagnosis of substance abuse
problem:
3.b.2. Percentage of children/adolescents meeting the Federal definition of SED who also have a diagnosis of
substance abuse problem:
3b.3 Please describe how you calculate and count the number of persons
with co-occurring disorders
4 State Mental Health Agency Responsibilities
a. Medicaid: Does the State Mental Health Agency have any of the following responsibilities for mental health services provided through Medicaid? (Check All that Apply)
1. State Medicaid Operating Agency
2. Setting Standards
3. Quality Improvement/Program Compliance 4. Resolving Consumer Complaints
5. Licensing 6. Sanctions
7. Other
Are Data for
these programs reported on URS Tables?
b. Managed Care (Mental Health Managed Care
4.b.1
Does the State have a Medicaid Managed Care initiative?
4.b.2 Does the State Mental Health Agency have any responsibilities for mental health services provided through Medicaid Managed Care?
If yes, please check the responsibilities the SMHA has:
4.b.3 Direct contractual responsibility and oversight of the MCOs or BHOs 4.b.4 Setting Standards for mental health services
4.b.5 Coordination with state health and Medicaid agencies 4.b.6 Resolving mental health consumer complaints 4.b.7 Input in contract development
4.b.8 Performance monitoring
4.b.9 Other
5
Data Reporting: Please describe the extent to which your information systems allows the generation of
unduplicated client counts between different parts of your mental health system. Please respond in particular for Table 2, which requires unduplicated counts of clients served across your entire mental health system.
tables?
5.a. Unduplicated :counted once even if they were served in both State hospitals and community programs and if they were served in community mental health agencies responsible for different geographic or programmatic areas.
5.b.
Duplicated: across state hospital and community programs 5.c. Duplicated: within community programs
5.d. Duplicated: Between Child and Adult Agencies
5.e. Plans for Unduplication: If you are not currently able to provide unduplicated client counts across all parts of your mental health system, please describe your plans to get unduplicated client counts by the end of your Data Infrastructure Grant.
6 Summary Administrative Data
6.a. Report Year
6.b. State Identifier
Summary Information on Data Submitted by SMHA:
6.c. Year being reported: From: to
6.d. Person Responsible for Submission
6.e. Contact Phone Number:
6.f. Contact Address
Table 13A (URS Table 2A). Profile of Persons Served, All Programs by Age, Gender and Race/Ethnicity
This table provides an aggregate profile of persons in the reporting year. The reporting year should be the latest state fiscal year for which data are available. This profile is based on a client receiving services in programs provided or funded by the state mental health agency. The client profile takes into account all institutional and community services for all such programs. Please provide unduplicated counts if possible.
Please report the data under the categories listed - "Total" are calculated automatically. Table 2.
Report Year: State Identifier:
Total American Indian or Alaska Native
Asian Black or African American Female Male Not
Availa ble
Total Female Male Not Availabl
e
Female Male Not Availabl
e
Female Male Not Availabl
e
0-17 years 18-24 years 25-44 years 45-64 years 65+ years Total Pregnant Women
Are these numbers unduplicated? Comments on Data (for Age):
Comments on Data (for Gender):
Comments on Data (for Race/Ethnicity):
Comments on Data (Overall):
Table 13A. Report Year: State Identifier:
Native Hawaiian or Other Pacific Islander
White Hispanic * use only if data for Table 2b are not available.
More Than One Race Reported
Race Not Available Female Male Not
Availab le
Female Male Not Availab
le
Female Male Not Availab
le
Female Male Not Availabl
e
Femal e
Male Not Availabl
e
0-17 years 18-24 years 25-44 years 45-64 years 65+ years Total Pregnant Women
Table 13B (URS Table 2B). Profile of Persons Served, All Programs by Age, Gender and Race/Ethnicity
Of the total persons served, please indicate the age, gender and the number of persons who are
Hispanic/Latino or not Hispanic/Latino. Total persons served would be the total as indicated in Table 2A.
Please report the data under the categories listed - "Total" are calculated automatically.
Table 13B.
Report Year:
State Identifier:
Not Hispanic or Latino Hispanic or Latino
Hispanic or Latino Origin
Not Available Total
Female Male
Not
Available Female Male
Not
Available Female Male
Not
Available Female Male
Not
Available Total
0-17 years
18-24 years
25-44 years
45-64 years
65+ years
Total
Pregnant Women
Comments on Data (for Age):
Comments on Data (for Gender):
Comments on Data (for Race/Ethnicity):
Comments on Data (Overall):
Table 14 (URS Table 3). Profile of Persons served in the community mental health setting, State Psychiatric Hospitals and Other Settings
This table provides a profile for the clients that received public funded mental health services in community mental health settings, in state psychiatric hospitals, in other psychiatric inpatient programs, and in residential treatment centers for children.
Table 14
Report Year:
State
Identifier:
Table 14 Service Setting
Age 0-17 Age 18-20 Age 21-64 Age 65+
Female Male
Not
Available Female Male
Not
Available Female Male
Not
Available Female Male
Not Available
Community Mental Health
Programs
State Psychiatric
Hospitals
Other Psychiatric
Inpatient
Residential Treatment
Centers
Table 14 (cont.) Profile of Persons served in the community mental health setting, State Psychiatric Hospitals and Other Settings
Table 14
Report Year:
State Identifier:
Table 14 Service Setting
Age Not Available Total
Female Male Not Available Female Male Not Available Total
Community Mental Health
Programs
State Psychiatric Hospitals
Other Psychiatric Inpatient
Residential Treatment Centers
Comments on Data (for Age):
Comments on Data (for Gender):
Comments on Data (Overall):
Note: Clients can be duplicated between Rows: e.g., The same client may be served in both state psychiatric hospitals and community mental health centers during the same year and thus would be reported in counts for both rows.
Instructions:
1 States that have county psychiatric hospitals that serves as surrogate state hospitals should report persons served in such settings as receiving services in state hospitals. 2 If forensic hospitals are part of the state mental health agency system include them.
3 Persons who receive non-inpatient care in state psychiatric hospitals should be included in the Community MH Program Row
4 Persons who receive inpatient psychiatric care through a private provider or medical provider licensed and/or contracted through the SMHA should be counted in the "Other Psychiatric Inpatient" row. Persons who receive Medicaid funded inpatient services through a provider that is not licensed or contracted by the SMHA should not be counted here. 5 A person who is served in both community settings and inpatient settings should be included in both rows
6
RTC: CMHS has a standardized definition of RTC for Children: “An organization, not licensed as a psychiatric hospital, whose primary purpose is the provision of individually planned programs of mental health treatment services in conjunction with residential care for children and youth primarily 17 years old and younger. It has a clinical program that is directed by a psychiatrist, psychologist, social worker, or psychiatric nurse who has a master’s degree or doctorate. The primary reason for the admission of the clients is mental illness that can be classified by DSM-IV codes-other than the codes for mental retardation, developmental disorders, and substance-related disorders such as drug abuse and alcoholism (unless these are co-occurring with a mental illness).”
Table 15A (NEW) Profile of Persons with SMI/SED Served by Age, Gender and Race/Ethnicity This table provides a profile for the clients that received public funded mental health services in community mental health settings, in state psychiatric hospitals, in other psychiatric inpatient programs, and in residential treatment centers for children.
PLEASE DO NOT ADD, DELETE OR MOVE ROWS, COLUMNS AND/OR CELLS!
Table 15A
Report Year:
State
Identifier:
Table 15A Service Setting
Age 0-17 Age 18-20 Age 21-64
Female Male Not Available Female Male Not Available Female Male Not Available
Community Mental Health
Programs
State Psychiatric
Hospitals
Other Psychiatric
Inpatient
Residential Treatment
Centers
Table 15A (cont.) Profile of Persons served in the community mental health setting, State Psychiatric Hospitals and Other Settings
Table 15A
Report Year:
State Identifier:
Table 15A Service Setting
Age 65+ Age Not Available Total
Female Male
Not
Available Female Male
Not
Available Female Male
Not
Available Total
Community Mental Health
Programs
State Psychiatric Hospitals
Other Psychiatric Inpatient
Residential Treatment Centers
Comments on Data (for Age):
Comments on Data (for Gender):
Comments on Data (Overall):
Note: Clients can be duplicated between Rows: e.g., The same client may be served in both state psychiatric hospitals and community mental health centers during the same year and thus would be reported in counts for both rows.
Instructions:
1 States that have county psychiatric hospitals that serve as surrogate state hospitals should report persons served in such settings as receiving services in state hospitals. 2 If forensic hospitals are part of the state mental health agency system include them.
3 Persons who receive non-inpatient care in state psychiatric hospitals should be included in the Community MH Program Row
4 Persons who receive inpatient psychiatric care through a private provider or medical provider licensed and/or contracted through the SMHA should be counted in the "Other Psychiatric Inpatient" row. Persons who receive Medicaid funded inpatient services through a provider that is not licensed or contracted by the SMHA should not be counted here.
5 A person who is served in both community settings and inpatient settings should be included in both rows
6
RTC: CMHS has a standardized definition of RTC for Children: “An organization, not licensed as a psychiatric hospital, whose primary purpose is the provision of individually planned programs of mental health treatment services in conjunction with residential care for children and youth primarily 17 years old and younger. It has a clinical program that is directed by a psychiatrist, psychologist, social worker, or psychiatric nurse who has a master’s degree or doctorate. The primary reason for the admission of the clients is mental illness that can be classified by DSM-IV codes-other than the codes for mental retardation, developmental disorders, and substance-related disorders such as drug abuse and alcoholism (unless these are co-occurring with a mental illness).”
Table 15B (URS Table 14A). Profile of Persons with SMI/SED served by Age, Gender and Race/Ethnicity
This is a developmental table similar to Table 2A. and 2B. This table requests counts for persons with SMI or SED using the definitions provided by the CMHS. Table 2A. and 2B. included all clients served by publicly operated or funded programs. This table counts only clients who meet the CMHS definition of SMI or SED. For many states, this table may be the same as Tables 2A. and 2B. For 2007, states should report using the Federal Definitions of SMI and SED if they can report them, if not, please report using your state’s definitions of SMI and SED and provide information below describing your state’s definition.
Please report the data under the categories listed - "Total" are calculated automatically. Table 15B
Report Year: State Identifier:
Total American Indian or Alaska Native
Asian Black or African American
Native Hawaiian or Other Pacific
Islander Femal
e
Male Not Availa
ble
Total Fem ale Mal e Not Availa ble Fema le
Male Not Availa
ble
Femal e
Male Not Availa ble Fem ale Mal e Not Availa ble 0-12 Years 13-17 years 18-20 years 21-64 years 65-74 years 75+ years Not Available Total
Comments on Data (for Age): Comments on Data (for Gender): Comments on Data (for Race/Ethnicity): Comments on Data (Overall):
(contin ued on next page) Table 15B. Report Year:
State
Identifier:
White Hispanic *use only if data
for Table 14b are not available
More Than One Race Reported
Race Not Available
Femal e
Male Not Availa
ble
Femal e
Male Not Availa
ble
Fema le
Male Not Availa
ble
Femal e
Male Not Availa
ble
0-12 Years 13-17 years 18-20 years 21-64 years 65-74 years 75+ years Not Available Total
1. State Definitions Match the Federal Definitions:
Yes No Adults with SMI, if No describe or attach state definition:
Yes No Diagnoses included in state SMI definition:
Yes No Children with SED, if No describe or attach state definition:
Table 15C (URS Table 14B). Profile of Persons with SMI/SED served by Age, Gender and Race/Ethnicity
Of the total persons served, please indicate the age, gender and the number of persons who meet the Federal definition of SMI and SED and who are Hispanic/Latino or not Hispanic/Latino. The total persons served who meet the Federal definition of SMI or SED should be the total as indicated in Table 14A.
Please report the data under the categories listed - "Total" are calculated automatically.
Table 15C
Report Year:
State Identifier:
Not Hispanic or Latino Hispanic or Latino
Hispanic or Latino Origin
Not Available Total
Female Male
Not
Available Female Male
Not
Available Female Male
Not
Available Female Male
Not
Available Total
0 - 12 Years
13 - 17 years
18 - 20 years
21-64 years
65-74 years
75+ years
Not Available
Total
Comments on Data (for Age):
Comments on Data (for Gender): Comments on Data (for
Race/Ethnicity):
Table 16 (URS Table 5): Profile of Client Turnover
PLEASE DO NOT ADD, DELETE OR MOVE ROWS, COLUMNS AND/OR CELLS!
Table 16.
Report Year:
State Identifier:
Profile of Service Utilization
Total Served at Beginning of Year (unduplicated) Admissions During the year (duplicated) Discharges During the year (duplicated)
Length of Stay (in Days): Discharged
Patients
For Clients in Facility for Less
Than 1 Year: Average Length of
Stay (in Days): Residents at end
of year
For Clients in Facility More Than 1 Year: Average Length of Stay
(in Days): Residents at end of year Average
(Mean) Median
Average
(Mean) Median
Average
(Mean) Median
State Hospitals
Children (0 to 17 years)
Adults (18 yrs and over)
Age Not Available
Other Psychiatric Inpatient
Children (0 to 17 years)
Adults (18 yrs and over)
Age Not Available
Residential Tx Centers
Children (0 to 17 years)
Adults (18 yrs and over)
Age Not Available
Community Programs
Children (0 to 17 years)
Adults (18 yrs and over)
Age Not Available
Comments on Data (State
Hospital):
Comments on Data (Other
Inpatient):
Comments on Data (Residential
Treatment):
Comments on Data (Community
Programs):
E. Performance Data and Outcomes
• Table 17 (URS Table 17). Profile of Adults with Serious Mental Illnesses Receiving
Specific Services During the Year. Table 17 provides the number of unduplicated Adults with SMI receiving family psychoeducation, integrated treatment for co-occurring disorders, illness self-management and medication management.
• Table 18A (URS Table 4). Profile of Adult Clients By Employment Status. Table 18A
describes the status of adults clients served in the report year by the public mental health system in terms of employment status. The focus is on employment for the working age population, recognizing, however, that there are clients who are disabled, retired or who homemakers, care-givers, are etc and not a part of the workforce. These persons should be reported in the “Not in Labor Force” category. This category has two subcategories: retired and other. (The totals of these two categories should equal the number in the row for “Not in Labor Force”). Unemployed refers to persons who are looking for work but have not found employment. Data should be reported for clients in non-institutional settings at time of discharge or last evaluation.
• Table 18B (URS Table 4A). Profile Of Adult Clients By Employment Status: By Primary
Diagnosis Reported. Table 18B request information on the status of adult clients served in the report year by the public mental health system in terms of employment status by primary diagnosis reported.
• Table 19 (URS Table 15). Living Situation Profile. Table 19 requests information
regarding the number of Individuals in Each Living Situation as collected by the most recent assessment in the reporting period. Specifically, information is collected on the individual’s last known living situation. Living situations include, but are not limited to: private residence, foster care, residential care, jail/correctional facility, homeless shelter and other.
• Table 20 (URS Table 19B). Profile of Change in School Attendance. Table 20 measures
the change in days attended over time. Information requested includes information on suspensions, expelled, and changes in the school attendance.
• Table 21 (URS Table 9). Social Connectedness and Improved Functioning. Table 21
requests states to provide information for youth and adults regarding Social
Connectedness. In addition, States are requested to provide information on functional domains that provide a general sense of an individual’s ability to develop and maintain relationships, cope with challenges and a sense of community belonging.
• Table 22A (URS Table 11). Summary Profile of Client Evaluation of Care. Table 22A
requests information that evaluates the “experience” of care for individuals that participate in the public mental health system. Specifically, the evaluation focuses on several areas including: access, quality and the appropriateness of services, participation in treatment planning and general satisfaction with services. Please provide unduplicated counts, if possible. This table provides an aggregate profile of persons served in the reporting year. The reporting year should be the latest state fiscal year for which data are available. This profile is based on a client's last known Living Situation.
• Table 22B (URS Table 11A). Consumer Evaluation of Care By Consumer
• Table 23 (URS Table 19A). Profile Of Criminal Justice Or Juvenile JusticeInvolvement.
Table 23 requests information to measure the change in Arrests over time.
• Table 24 (URS Table 16). Profile of Adults With Serious Mental Illnesses And Children
With Serious Emotional Disturbances Receiving Specific Services. Table 24 requests information regarding the number and demographics of individuals that are receiving specific evidenced-based services. In addition, the table requests information on if and how states monitor the fidelity for the evidenced based services.
• Table 25A (URS Table 20A). Profile of Non-Forensic (Voluntary and Civil-Involuntary)
Patients Readmission to Any State Psychiatric Inpatient Hospital Within 30/180 Days of Discharge. Table 25A provides the total number of discharges within the year, the number of readmissions within 30-days and 180-days and the percent readmitted by age, gender, race, and ethnicity.
• Table 25B (URS Table 20B). Profile of Forensic Patients Readmission to Any State
Psychiatric Inpatient Hospital Within 30/180 Days of Discharge. Table 25B provides the total number of discharges within the year, the number of readmissions within 30-days and 180-days and the percent readmitted by age, gender, race, and ethnicity.
• Table 26 (URS Table 21). Profile of Non-Forensic (Voluntary and Civil-Involuntary
Patients) Readmission to Any Psychiatric Inpatient Care Unit (State Operated or Other Psychiatric Inpatient Unit) within 30/180 Days of Discharge This Table provides the total number of discharges from inpatient care units w/I the year, the number of
readmissions w/I 30-days and 180-days and the percent readmitted by age, gender, race, and ethnicity..
Table 17 (URS Table 17): Profile of Adults with Serious Mental Illnesses Receiving Specific Services During The Year:
Table 17. Report Year: State Identifier:
ADULTS WITH SERIOUS MENTAL ILLNESS
Receiving Family Psychoeducation
Receiving Integrated Treatment for Co-occurring Disorders
(MH/SA)
Receiving Illness Self Management
Receiving Medication Management
Age
18-20 21-64 65-74 75+
Not Available TOTAL
Gender Female Male Not Available
Race
American Indian/ Alaska Native Asian
Black/African American Hawaiian/Pacific Islander White
Hispanic*
More than one race Unknown
Hispanic/Latino Origin Hispanic/Latino Origin Non Hispanic/Latino Hispanic origin not available
Do You monitor fidelity Yes No Yes No Yes No Yes No for this service?
IF YES,
What fidelity measure do you use? Who measures fidelity?
How often is fidelity measured?
Yes No Yes No Yes No Yes No Is the SAMHSA EBP Toolkit used to guide EBP Implementation?
Have staff been specifically trained to implement the EBP?
* Hispanic is part of the total served.
Comments on Data (overall):
Comments on Data (Family Psychoeducation):
Comments on Data (Integrated Treatment for Co-occurring Disorders): Comments on Data (Illness Self Management):
Comments on Data (Medication Management):
* Hispanic: Only use the "Hispanic" row under Race if data for Hispanic as a Ethnic Origin are not available
Table 18A (URS Table 4) Profile of Adult Clients by Employment Status
This table describes the status of adults clients served in the report year by the public mental health system in terms of employment status. The focus is on employment for the working age population, recognizing, however, that there are clients who are disabled, retired or who are homemakers, care-givers, etc and not a part of the workforce. These persons should be reported in the “Not in Labor Force” category. This category has two subcategories: retired and other. (The totals of these two categories should equal the number in the row for “Not in Labor Force”). Unemployed refers to persons who are looking for work but have not found employment. Data should be reported for clients in non-institutional
settings at time of discharge or last evaluation.
PLEASE DO NOT ADD, DELETE OR MOVE ROWS, COLUMNS AND/OR CELLS!
Table 18A
Report Year:
State Identifier:
18-20 21-64 65+ Age Not Available Total
Adults Served Female Male
Not
Available Female Male
Not
Available Female Male
Not
Available Female Male
Not
Available Female Male
Not
Available Total Employed:
Competitively Employed Full or Part Time (includes Supported
Employment)
Unemployed
Not In Labor Force: Retired, Sheltered Employment, Sheltered
Workshops, Other (homemaker, student, volunteer,
disabled, etc.)
Not Available
Total
How Often Does your State Measure Employment Status?
What populations are included:
Comments on Data (for Age): Comments on Data (for Gender): Comments on Data (Overall):
Table 18B (URS Table 4A) Optional Profile of Adult Clients by Employment Status: by Primary Diagnosis Reported
The workgroup exploring employment found that the primary diagnosis of consumers results in major differences in employment status. The workgroup has recommended that we explore the ability of states to report employment by primary diagnosis and the impact of diagnosis on employment. The workgroup recommended 5 diagnostic clusters for reporting.
PLEASE DO NOT ADD, DELETE OR MOVE ROWS, COLUMNS AND/OR
CELLS!
Table 18B
Report Year:
State Identifier:
Clients
Primary Diagnosis
Employed: Competitively Employed Full or Part
Time (includes Supported
Employment) Unemployed
Not In Labor Force: Retired, Sheltered
Employment, Sheltered Workshops,
Other (homemaker, student, volunteer,
disabled, etc.)
Employment Status
Not Available Total Schizophrenia & Related Disorders
(295)
Bipolar and Mood Disorders (296,
300.4, 301.11, 301.13, 311)
Other Psychoses (297, 298)
All Other Diagnoses
No Dx and Deferred DX (799.9,
V71.09)
Diagnosis Total
Table 19 (URS Table 15). Living Situation Profile:
Number of Clients in Each Living Situation as Collected by the Most Recent Assessment in the Reporting Period All Mental Health Programs by Age, Gender, and Race/Ethnicity
Please provide unduplicated counts, if possible. This table provides an aggregate profile of persons served in the reporting year. The reporting year should be the latest state fiscal year for which data are available. This profile is based on a client's last known Living Situation.
PLEASE DO NOT ADD, DELETE OR MOVE ROWS, COLUMNS AND/OR CELLS!
Table 18
Report Year:
State Identifier:
Private Residence
Foster Home
Residential Care
Crisis Residence
Children's Residential
Treatment
Institutional Setting
Jail/ Correctional
Facility
Homeless/
Shelter Other NA Total 0-17
18-64 65 +
Not Available TOTAL
Female Male Not Available TOTAL
American Indian/Alaska Native Asian
Black/African American Hawaiian/Pacific Islander White/Caucasian Hispanic *
More than One Race Reported Race/Ethnicity Not Available TOTAL
Table 19 (cont.) Living Situation Profile:
Number of Clients in Each Living Situation as Collected by the Most Recent Assessment in the Reporting Period All Mental Health Programs by Age, Gender, and Race/Ethnicity
Please provide unduplicated counts, if possible. This table provides an aggregate profile of persons served in the reporting year. The reporting year should be the latest state fiscal year for which data are available. This profile is based on a client's last known Living Situation.
PLEASE DO NOT ADD, DELETE OR MOVE ROWS, COLUMNS AND/OR CELLS!
Please report the data under the Living Situation categories listed - "Total" are calculated automatically. Table 18
Report Year:
State Identifier:
Private Residence
Foster Home
Residential Care
Crisis Residence
Children's Residential
Treatment
Institutional Setting
Jail/ Correctional
Facility
Homeless/
Shelter Other NA Total Hispanic or Latino Origin
Non Hispanic or Latino Origin
Hispanic or Latino Origin Not Available TOTAL
Comments on Data: How Often Does your State Measure Living
Situation?
Table 20 (URS Table 19B). Profile of Change in School Attendance
PLEASE DO NOT ADD, DELETE OR MOVE ROWS, COLUMNS AND/OR CELLS!
1. This is a developmental measure. To assist in the development process, we are asking states to report information on the school attendance outcomes of mental health consumers with their December 2007 MHBG submission.
2. The SAMHSA National Outcome Measure for School Attendance measures the change in days attended over time. The DIG Outcomes Workgroup pilot tested 3 consumer self-report items that can be used to provide this information. If your state has used the 3 Consumer Self-Report items on School Attendance, you may report them here.
3. If your SMHA has data on School Attendance from alternatives sources, you may also report that here. If you only have data for School attendance for consumers in this year, please report that in the T2 columns. If you can calculate the change in Attendance from T1 to T2, please use all these columns. 4. Please complete the check boxes at the bottom of the table to help explain the data sources that you used to complete this table.
5. Please tell us anything else that would help us to understand your indicator (e.g., list survey or MIS questions; describe linking methodology and data sources; specify time period for criminal justice involvement; explain whether treatment data are collected).
Table 19b. Profile of Change in School Attendance
State: Time period in which services were received:
For Consumers in Service for at least 12 months
T1 T2 T1 to T2 Change Impact of Services
"T1" Prior 12 months (more than 1 year
ago)
"T2" Most Recent 12 months (this year)
If Suspended at T1 (Prior 12 Months)
If Not Suspended at T1 (Prior 12 Months)
Over the last 12 months, the number of days my child was in school have # Susp ende d or Expe lled # Not Susp ende d or Expel led No Res pon se # Susp ende d or Expe lled # Not Suspe nded or Expell ed No Res pons e # with an Expell ed or Susp ended in T2 # with No Susp ensio n or Expul sion at T2 No Resp onse # with an Expel led or Susp ende d in T2 # with No Susp ensio n or Expu lsion at T2 No Resp onse # Gre ater (Imp rove d) # Sta yed the Sa me # Few er days (gott en wors e) # Not Appl icabl e No resp ons e Total Resp onse s Total Gender Male Female Gender NA Age Under 18
Table 20. Profile of Change in School Attendance (Con’t) –
For Consumers Who Began Mental Health Services during the past 12 months
T1 T2 T1 to T2 Change Impact of Services
"T1" 12 months prior to beginning services
"T2" Since Beginning Services (this year)
If Suspended at T1 (Prior 12 Months)
If Not Suspended at T1 (Prior 12 Months)
Since starting to receive MH Services, the number of days my child was in school have # Susp ende d or Expe lled # Not Susp ende d or Expel led No Res pon se # Susp ende d or Expe lled # Not Suspe nded or Expell ed No Res pons e # with an Expell ed or Susp ended in T2 # with No Susp ensio n or Expul sion at T2 No Resp onse # with an Expel led or Susp ende d in T2 # with No Susp ensio n or Expu lsion at T2 No Resp onse # Gre ater (Imp rove d) # Sta yed the Sa me # Few er days (gott en wors e) # Not Appl icabl e No resp ons e Total Resp onse s
Total 0 0 0 0 0 0 0 0 0 0 0 0 0 0 0 0 0 0
Gender
Male 0
Female 0
Gender NA 0
Age
Under 18 0
See Page 2 for additional Questions about the source of this data.
Source of School Attendance Information
1) Consumer survey (recommended items)
2) Other Survey: Please send us items 3) Mental health MIS 4) State Education Department 5) Local Schools/Education Agencies 6) Other (specify) Measure of School
Attendance
1) School Attendance 2) Other: (Specify)
Mental health programs include:
1) Children with SED only
2) Other Children (specify) 3) Both. Region for which data are
reported:
1) The whole state 2) Less than the whole state (please describe)
What is the Total Number of Persons Surveyed or for whom School Attendance Data Are Reported
Child/Adolescents
1. If data is from a survey, What is the total Number of people from which the sample was drawn? 2. What was your sample size? (How many individuals were selected for the sample)?
3. How many survey Contacts were made? (surveys to valid phone numbers or addresses)
4. How many surveys were completed? (survey forms returned or calls completed) If data source was not a Survey, How many persons were data available for? 5. What was your response rate? (number of Completed surveys divided by number of Contacts):
Table 21 (URS Table 9): SAMHSA NOMs: SOCIAL CONNECTEDNESS AND IMPROVED FUNCTIONING
PLEASE DO NOT ADD, DELETE OR MOVE ROWS, COLUMNS
AND/OR CELLS!
Table 9: NOMS Social Connectedness & Functioning Report Year (Year Survey was Conducted):
State Identifier:
Adult Consumer Survey Results: Number of Positive Responses
Responses Percent Positive (calculated) 1. Social Connectedness
2. Functioning
Child/Adolescent Consumer Survey Results: Number of Positive Responses
Responses Percent Positive (calculated)
3. Social Connectedness
4. Functioning
Comments on Data:
Adult Social Connectedness and Functioning Measures
1. Did you use the recommended new Social Connectedness Questions? Yes No Measure used
2: Did you use the recommended new Functioning Domain Questions? Yes No Measure used
3. Did you collect these as part of your MHSIP Adult Consumer Survey? Yes No
If No, what source did you use?
Child/Family Social Connectedness and Functioning Measures
4: Did you use the recommended new Social Connectedness Questions? Yes No Measure used
5: Did you use the recommended new Functioning Domain Questions? Yes No Measure used
6. Did you collect these as part of your YSS-F Survey? Yes No
If No, what source did you use?
Recommended Scoring Rules