November 2015
Fixed-Income
Market Liquidity:
Issues and Implications
Thomas Brennan, CFA
Fixed-Income Specialist
Liquidity Defi ned
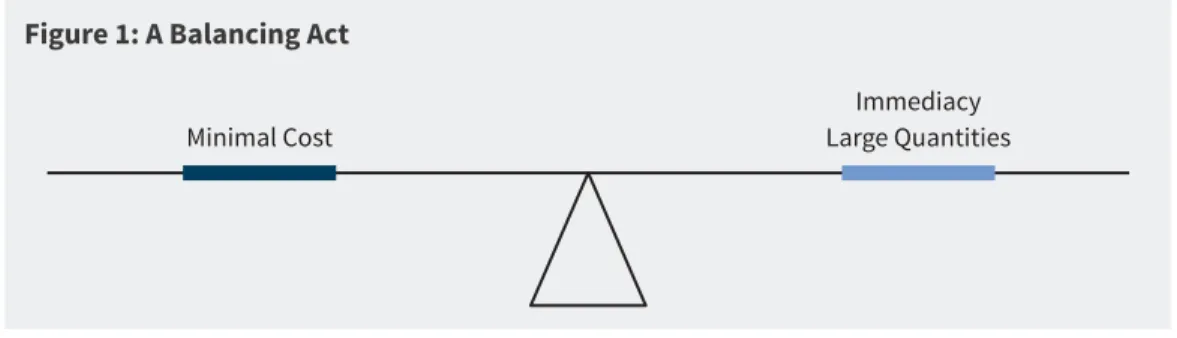
To understand the issue of fi xed-income market liquidity, it is fi rst important to defi ne liquidity and review the integral role of dealers. A security’s liquidity profi le is considered strong when a market participant can trade large quantities of the security quickly and with minimal cost. Fixed-income securities are traded over the counter, and therefore dealers stand willing to act as the counterparty for a trade using their fi rm’s capital. Ultimately, dealers desire to match buyers and sellers. However, the dealer assumes the risk that orderly markets dissipate while it holds the security.
Because dealers play an essential role in providing liquidity, it is useful to think about how a dealer considers each of the aforementioned factors when establishing the price at which it is willing to trade.
• Ability to trade large quantities. At very large quantities, a dealer is concerned that a small disruption in orderly markets can result in a large nominal loss. Therefore, the larger the order, the larger the risk, all else equal.
• Ability to trade quickly. If immediacy is required, the dealer must adjust the price to protect against the possibility of adverse conditions while the dealer seeks other buyers or sellers for the security. Therefore, a party that demands immediacy must be willing to accept a disadvantageous price.
• Ability to trade at minimal cost. For fi xed-income securities, the cost is best measured by the bid-ask spread. Dealers provide the prices at which they will trade a security given the quantity and immediacy desired by a counterparty. A dealer is willing to trade at a lower cost if the counterparty is willing to sacrifi ce one of the two aforementioned factors (smaller quantities and/or longer time to trade execution).
Therefore, a fi xed-income investor balances the desire to minimize trading assets against the desire to trade large quantities and trade quickly, as fi gure 1 shows.
The topic of liquidity in the fi xed-income market has garnered a
lot of attention from the media, academia, and asset managers.
This paper presents William Blair’s fi xed-income team’s thoughts
on the topic of bond-market liquidity.
Figure 1: A Balancing Act
Immediacy Large Quantities Minimal Cost
What Is the Issue?
Fixed-income market liquidity has become a concern because of the confl uence of three factors.
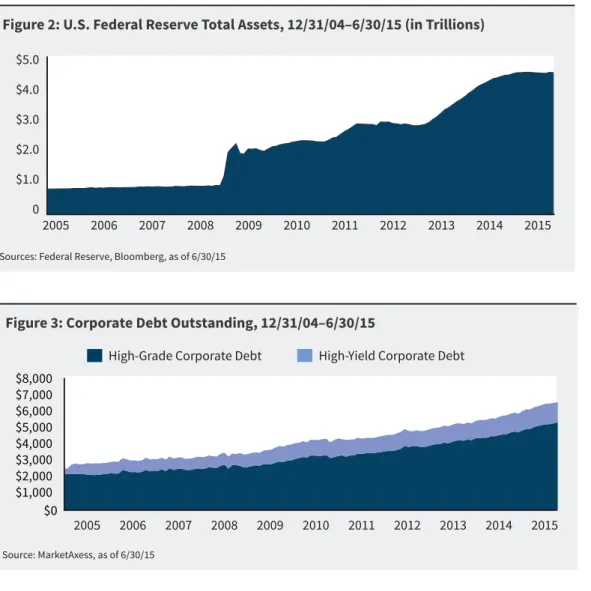
The Fixed-Income Market Has Grown Signifi cantly
Figures 2 and 3 illustrate the growth of the fi xed-income market over the past decade. These fi gures show that multiple segments of the fi xed-income market experienced growth. U.S. Treasuries and agency mortgage-backed securities have grown as the Federal Reserve has targeted those instruments in its large-scale asset purchase programs (quantitative easing). The Federal Reserve’s balance sheet totaled $4.5 trillion as of June 30, 2015, a stark increase from the $0.9 trillion at the end of 2007.
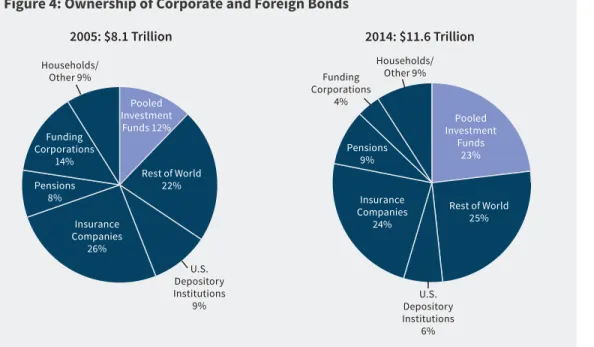
Corporate bonds have also grown as issuers have sought to lock in longer-term fi nancing at low nominal yields. At the end of 2007, there were $3.3 trillion of corporate bonds outstanding. As of June 30, 2015, the corporate bond market had $6.7 trillion outstanding As a result of this growth, there are more potential investors that may want to trade large quantities of fi xed-income securities. When dealers believe large quantities of these securities may trade, trading costs will rise through dealers setting bid prices lower.
Th
ere are more
potential investors
that may want to trade
large quantities of
fi xed-income securities.
Sources: Federal Reserve, Bloomberg, as of 6/30/15
Figure 2: U.S. Federal Reserve Total Assets, 12/31/04–6/30/15 (in Trillions)
0 $1.0 $2.0 $3.0 $4.0 $5.0
2015 2014 2013 2012 2011 2010 2009 2008 2007 2006 2005
Figure 3: Corporate Debt Outstanding, 12/31/04–6/30/15
High-Yield Corporate Debt High-Grade Corporate Debt
$2,000 $3,000 $4,000 $5,000 $6,000 $7,000 $8,000
Pooled Investment Vehicles Have Grown in Prominence
Figure 4 shows how pooled investment vehicles (mutual funds and exchange-traded funds) have grown in prominence as holders of fi xed-income securities. In addition, there are many fi xed-income mutual funds that have assets in excess of $25 billion, with some funds having more than $50 billion and some more than $100 billion. In those funds, it is common to see position sizes in excess of $200 million. Therefore, pooled investment vehicles may incur larger trading costs because of the potential that they will need to trade large quantities with immediacy, as the pooled vehicles promise a liquidity profi le of either daily (for a mutual fund) or second by second (for an exchange-traded fund) to investors within those funds
Regulation Has Constrained the Risk-Taking Activities of Dealers
Regulation enacted in the aftermath of the global fi nancial crisis has sought to constrain the risk-taking activities of banks. Capital requirements have risen, and as a result dealers have less access to their companies’ balance sheets to facilitate trades.
This does not mean that dealers do not facilitate trades. Many large banks have reported robust performance from their Fixed Income, Commodities, and Currency (FICC) divisions over the past few years.
Rather, the role that dealers play when facilitating trades has changed. Dealers have less ability to use their fi rms’ balance sheets to absorb potential losses. To mitigate that risk, dealers set prices in an eff ort to better match buyers and sellers. If dealers predict large selling activity, dealers will set prices lower to lure prospective buyers.
If dealers predict
large selling activity,
dealers will set
prices lower to lure
prospective buyers.
Source: U.S. Federal Reserve Flow of Funds, Balance Sheets, and Integrated Macroeconomic Accounts, dated 9/11/15.
Figure 4: Ownership of Corporate and Foreign Bonds
2005: $8.1 Trillion
Households/ Other 9%
Funding Corporations
14% Pensions
8%
Insurance Companies
26%
U.S. Depository Institutions
9%
Rest of World 22% Pooled Investment Funds 12%
2014: $11.6 Trillion
Pooled Investment
Funds 23%
Rest of World 25% Insurance
Companies 24% Pensions
9%
Funding Corporations
4%
Households/ Other 9%
U.S. Depository Institutions
Price volatility
will be the mechanism
by which dealers
match sellers and
buyers, and there will
continue to be bouts
of heightened volatility.
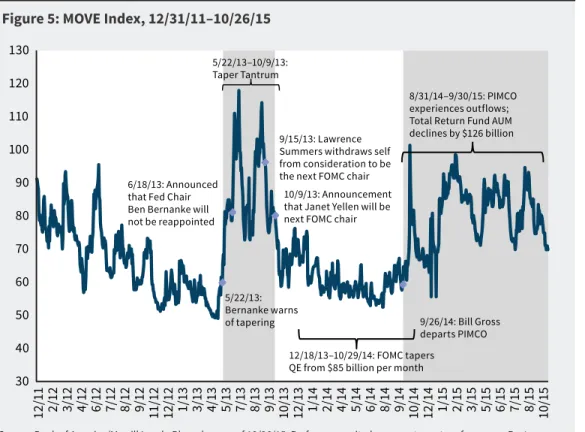
Source: Bank of America/Merrill Lynch, Bloomberg as of 10/26/15. Performance cited represents past performance. Past performance does not guarantee future results and current performance may be lower or higher than the data quoted. The Merrill Lynch Option Volatility Estimate (MOVE) Index measures the implied volatility of U.S. Treasury markets. A direct investment in an unmanaged index is not possible. Shaded areas represent 2013 “taper tantrum” and 2014-2015 mutual fund outflows.
Figure 5: MOVE Index, 12/31/11–10/26/15
12/
1
1
2/
12
3/12 4/12 6/12 7/12 8/12 9/12 11/12 12/12 1/13 3/13 4/13 5/13 7/13 8/13 9/13 10/13 12/13 1/14 2/14 4/14 5/14 6/14 8/14 9/14 10/14 12/14 1/15 2/15 3/15 5/15 6/15 7/15 8/15 10/15 6/18/13: Announced
that Fed Chair Ben Bernanke will not be reappointed
5/22/13: Bernanke warns of tapering 5/22/13–10/9/13: Taper Tantrum
9/15/13: Lawrence Summers withdraws self from consideration to be the next FOMC chair
10/9/13: Announcement that Janet Yellen will be next FOMC chair
12/18/13–10/29/14: FOMC tapers QE from $85 billion per month
9/26/14: Bill Gross departs PIMCO 8/31/14–9/30/15: PIMCO experiences outflows; Total Return Fund AUM declines by $126 billion
30 40 50 60 70 80 90 100 110 120 130
What Are the Implications?
We believe the factors described above are unlikely to change in the short term. As a result, William Blair’s fi xed-income team believes the following implications are important for fi xed-income investors to consider.
The Role of Price Volatility
The fi rst implication for fi xed-income investors to consider is that price volatility will be the mechanism by which dealers match sellers and buyers, and there will continue to be bouts of heightened volatility.
We contend that the fear of large selling activity will spur bouts of fi xed-income market volatility, and we believe that two events that occurred over the past three calendar years exemplify how such volatility will manifest: the “taper tantrum” of 2013 and heavy outfl ows from a large fi xed-income mutual fund in 2014 and 2015. Figure 5 shows how fi xed-income market volatility spiked during these periods, and fi gures 6 and 7 illustrate how interest rates and spread sectors performed during these periods.
We contend that the
fear of large selling
activity will spur
bouts of fi xed-income
market volatility.
Source: Barclays, Bloomberg, as of 10/26/15. Performance cited represents past performance. Past performance does not guarantee future results and current performance may be lower or higher than the data quoted. A direct investment in an unmanaged index is not possible. Shaded areas represent 2013 “taper tantrum” and 2014-2015 mutual fund outflows.
Figure 7: Barclays U.S. Aggregate Index Excess Returns, 12/31/11–10/26/15
-0.80% -0.60% -0.40% -0.20% 0.00% 0.20% 0.40% 0.60% 0.80%
1/00 3/12 5/12 7/12 9/12 11/12 1/13 3/13 5/13 7/13 9/13 11/13 1/14 3/14 5/14 7/14 9/14 11/14 1/15 3/15 5/15 7/15 9/15 Source: Bloomberg, as of 10/26/15. Performance cited represents past performance. Past performance does not guarantee future results and current performance may be lower or higher than the data quoted. Shaded areas represent 2013 “taper tantrum” and 2014-2015 mutual fund outflows.
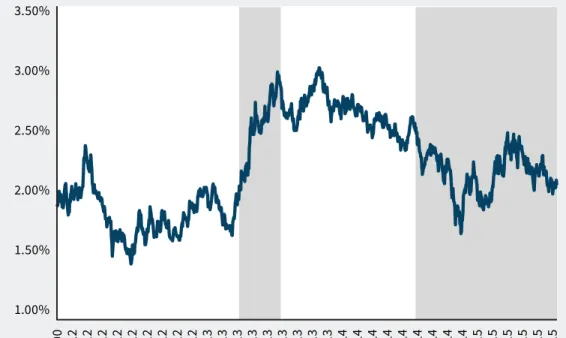
Figure 6: 10-Year U.S. Treasury Note Yield, 12/31/11–10/26/15
1/ 0 0 2/ 12 3/1 2 5/1 2 6/ 1 2 7/ 1 2 8/ 1 2 10/1 2 11 /1 2 12/ 1 2 2/ 1 3 3/1 3 5/1 3 6/ 1 3 7/ 1 3 8/ 1 3 10/1 3 11 /1 3 12/ 1 3 2/ 1 4 3/1 4 5/1 4 6/ 1 4 7/ 1 4 9/ 1 4 10/1 4 11 /1 4 12/ 1 4 2/ 1 5 3/1 5 5/1 5 6/ 1 5 7/ 1 5 9/ 1 5 1.00% 1.50% 2.00% 2.50% 3.00% 3.50%
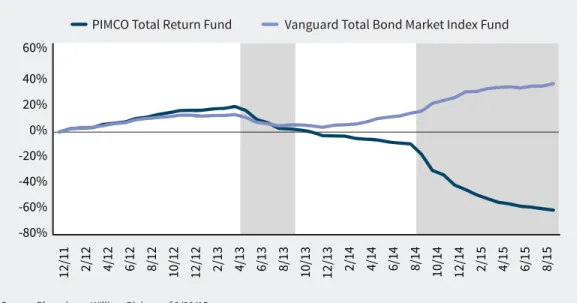
PIMCO Total
Return Fund
experienced signifi cant
outfl ows. ...
Vanguard Total
Bond Market Index
Fund ... appears to
have been a
notable benefi ciary.
In May 2013, Ben Bernanke, then chair of the Federal Reserve, warned that the Fed might begin to taper the pace of its asset-purchase program. A few weeks later, it was announced that Bernanke would not be reappointed chair of the Federal Reserve. This created uncertainty over who would lead the Fed and what “taper” would mean to the new leader. We believe that marketmakers set prices with the fear that the Federal Reserve would begin to sell from its portfolio of U.S. Treasury and mortgage-backed securities, and those segments of the market were hardest hit. At the same time, outfl ows occurred from fi xed-income funds. The corporate bond market performed well during this period on a relative basis, as risk spreads narrowed, the new-issue market remained robust, and high-yield corporate bonds generated robust gains.
Volatility remained elevated until it was announced that Janet Yellen would be the Federal Reserve’s new chair, and volatility subdued to more normal levels as the Fed embarked on its program of tapering its large-scale asset-purchase program.
In September 2014, Bill Gross, the renowned portfolio manager of PIMCO Total Return Fund, announced that he was leaving PIMCO. At the time, PIMCO Total Return Fund was the largest fi xed-income mutual fund, with assets under management of $221.6 million on August 30, 2014. In the months that followed, PIMCO Total Return Fund experienced signifi cant outfl ows. While many actively managed funds received the proceeds to reinvest, we observed that the Vanguard Total Bond Market Index Fund, a passively managed mutual fund, appears to have been a notable benefi ciary, as shown in fi gure 8.
This created a seller and buyer mismatch; the buyer wanted to buy U.S. Treasuries
Source: Bloomberg, William Blair, as of 9/30/15.
Figure 8: Notable Bond Fund Flows, 12/31/11–9/30/15 (% of 12/31/11 AUM)
Vanguard Total Bond Market Index Fund PIMCO Total Return Fund
-80% -60% -40% -20% 0% 20% 40% 60% 12/ 1 1 2/ 12 4/ 1 2 6/ 1 2 8/ 1 2 10/1 2 12/ 1 2 2/ 1 3 4/ 1 3 6/ 1 3 8/ 1 3 10/1 3 12/ 1 3 2/ 1 4 4/ 1 4 6/ 1 4 8/ 1 4 10/1 4 12/ 1 4 2/ 1 5 4/ 1 5 6/ 1 5 8/ 1 5
Fixed-income investors
with reasonable
asset bases are well
positioned to manage
through periods of
lessened liquidity.
We believe that these events illustrate how the fi xed-income market will function during future periods when demand to sell securities is high. The fi xed-income investor must adapt to consider the following points:
• Volatility that used to be absorbed by dealers is now being imposed upon end investors. • It is important for investors to distinguish whether price volatility is due to a change in the security’s fundamental risk profi le or trading dynamics. It may be a behavioral bias that investors try to attribute all price movements to changes in fundamental variables. Distinguishing whether prices change due to fundamental factors or liquidity dynamics is critical for optimal decision making.
• Markets continued to function despite increased volatility and selling. During both periods, issuers were able to access the new-issue market and several large-cap banks reported robust performance from fi xed-income trading activity.
Fixed-Income Investors With Reasonable Asset Bases Are Well Positioned The second implication is that fi xed-income investors with reasonable asset bases are well positioned to manage through periods of lessened liquidity. We believe this to be the case for two reasons.
First, total position sizes matter. It is easier for dealers to queue up buyers on a $10 million trade than it is for trades of $100 million in secondary markets.
Second, electronic trading platforms provide an alternative to dealers when trading reasonable amounts. Electronic trading platforms have grown in prominence as a tool that links asset managers anonymously to dealers and other asset managers. We consider the growth in platforms since the global fi nancial crisis to be innovation that attempts to solve the liquidity puzzle mentioned above. However, electronic trading platforms cannot accommodate the scale on which larger fi xed-income managers transact.
Fears of Sustained Illiquidity May Be Overblown
The third implication is that while there are reasons for concern, fears of sustained illiquidity may be overblown. There are several investors with strategic demand for fi xed-income securities that stand willing to purchase fi xed-income securities and provide liquidity when other parties wish to sell, including:
• Corporate pension funds seeking to de-risk their pension obligations;
• Foreign investors, as U.S. rates are higher than those found in other developed economies;
• Older investors, as the demographic composition in the developed world increases demand for less volatile investment instruments; and
• Insurance companies, as they demonstrate consistent demand for fi xed-income securities.
About the Author
Tom Brennan joined William Blair as a product specialist in September 2010. Tom was previously a consultant at Ennis Knupp & Associates in Chicago, where his primary responsibility was researching fi xed-income investment managers. He began his career in 2005 as a consulting group analyst with Smith Barney. Tom is a member of the CFA Institute and CFA Society of Chicago. Education: B.S., economics, magna cum laude, Bradley University; M.B.A., with honors, University of Chicago's Booth School of Business.
About William Blair
William Blair is committed to building enduring relationships with our clients and providing expertise and solutions to meet their evolving needs. We work closely with private and public pension funds, insurance companies, endowments, foundations, and sovereign wealth funds, as well as fi nancial advisors. We are 100% active-employee-owned with broad-based ownership. Our investment teams are solely focused on active management and employ disciplined, analytical research processes across a wide range of strategies, including U.S. equity, non-U.S. equity, fi xed income, multi-asset, and alterna-tives. As of September 30, 2015, William Blair manages $62.6 billion in assets. William Blair is based in Chicago with investment management offi ces in London and Wilmington and service offi ces in Zurich and Sydney.
William Blair Investment Management, LLC and the investment management division of William Blair & Company, L.L.C. are collectively referred to as "William Blair."
Disclosures
This material is provided for information purposes only and is not intended as investment advice or a recommendation to buy or sell any particular security. Any discussion of particular topics is not meant to be comprehensive and may be subject to change. Data shown does not represent the performance or char-acteristics of any William Blair product or strategy. Any investment or strategy mentioned herein may not be suitable for every investor. Factual information has been taken from sources we believe to be reliable, but its accuracy, completeness or interpretation cannot be guaranteed. Past performance is not indicative of future results. Information and opinions expressed are those of the author and may not refl ect the opinions of other investment teams within William Blair Investment Management, LLC or the investment management division of William Blair & Company, L.L.C. Information is current as of the date appearing in this material only and subject to change without notice.
This material is distributed in the United Kingdom and European Economic Area (EEA) by William Blair International, Ltd., authorised and regulated by the Financial Conduct Authority (FCA), and is directed only at, and is only made available to, persons falling within Article 9, 38, 47, and 49 of the Financial Services and Markets Act 2000 (Financial Promotion) Order 2005 (all such persons being referred to as “relevant persons”). This document is intended for persons regarded as professional investors (or equivalent) and is not to be distributed or passed on to any “retail clients.” No persons other than persons to whom this document is directed should rely on it or its contents or use it as the basis to make an investment decision.
This document is distributed in Australia by William Blair & Company, LLC ("William Blair"), which is exempt from the requirement to hold an Australian fi nancial services license under Australia’s Corpora-tions Act 2001 (Cth) pursuant to ASIC Class Order 03/1100. William Blair is registered as an investment advisor with the U.S. Securities and Exchange Commission ("SEC") and regulated by the SEC under the U.S. Investment Advisers Act of 1940, which diff ers from Australian laws. This document is distributed only to wholesale clients as that term is defi ned under Australia’s Corporations Act 2001 (Cth). This document is not intended for distribution or dissemination, directly or indirectly, to any other class of persons. It is being supplied to you solely for your information and may not be reproduced, forwarded to any other person or published, in whole or in part, for any purpose.
![Operating Margin [in %] Gross Margin [in %] Deferred Revenue [in $ Millions] Cash, Equivalents & Investments [in $ Millions]](data:image/gif;base64,R0lGODlhAQABAIAAAP///wAAACH5BAEAAAAALAAAAAABAAEAAAICRAEAOw==)