Table Of Contents
Overview ... 1
User Guide Structure ... 2
ReportsNow Company Information ... 3
Office Locations ... 3
Trademarks ... 3
Getting Started ... 4
Sign into Data Access Studio ... 4
Main Window ... 6
Run Reports Published to You ... 8
Subscriber-only users ... 8
Run Reports Published to You ... 9
Change Parameters and Data Selection ... 10
Run the Report ... 11
Export and Print ... 12
Drill Down ... 13
Drill Down ... 13
Account Ledger drill downs ... 14
User-defined Drill Down ... 15
Design a Quick Report ... 17
Create a Financial Balances Report ... 18
Specify Type of Financial Report ... 19
Specify Financial Periods ... 20
Specify Financial Row Rollup ... 22
Financial Column Rollup - Optional ... 25
Special Settings ... 26
Create a Fixed Assets Report ... 28
Specify Type of Financial Report ... 29
Specify Financial Periods ... 30
Specify Fixed Asset Row Rollup ... 32
Special Settings ... 34
Design Reports ... 35
Get the Data You Need ... 36
Open a Table for First Time ... 37
Open a Table for the Second Time ... 37
See Sample Data... 38
Filter Your Data ... 39
Filter a Range ... 40
Filter a Range Relative to Today's Date ... 41
Filter with Form (advanced) ... 42
Manage Your Report ... 43
Access Your Reports... 44
Publish Your Report to Others ... 45
Manage Report Subscribers ... 47
Format Your Report ... 48
Show Only the Columns You Need ... 49
Place Columns in the Positions You Need ... 50
Get Description for Cryptic JDE Data ... 51
Get Totals by Column... 52
Show Data in Any Order ... 53
Customize the Look and Colors of Your Layout ... 54
Table Of Contents
iii
Perform Math Operations on Your Data ... 74
Calculate the Date Difference between Two Dates ... 75
Calculate a Date Relative to a Given Date ... 76
Extract Date Information from a Date Column ... 77
Rollup an Amount based on a Sliding Calendar Date ... 78
Make Multiple Period Amounts Appear as One Period Amount Column ... 79
Show Account Balances by Any Period, Quarter, or Year ... 80
Get Related Data from Another Table ... 82
Conditionally Rollup a Value ... 83
Filter on a Summary Value ... 84
Compare String Values ... 85
Substitute Patterns of Text with a Label ... 86
Convert Fiscal Date to Calendar Date ... 87
Combine Several Columns into One Column ... 88
JD Edwards Specific Calculations ... 89
Find Trends in Your Data ... 98
Common Trend Options ... 98
Show Your Top Ten and Bottom Ten Performers ... 99
Organize Date Information ... 100
Show Month Trends ... 102
Show Day Trends ... 103
Show Year Trends ... 104
Organize Your Data into Aging Ranges ... 105
Turn Row Values into Column Values ... 106
Export and Print Results ... 107
Set Default Printing Preferences ... 108
Define Basic Header and Footer ... 109
Specify an Area to Print ... 110
Set export options ... 111
Document Your Report ... 112
Make Your Report Run Faster ... 115
Index Assistant ... 115
Design Advanced Reports ... 117
Fine Tune Grouping and Summarization ... 118
Create a Table Join from Scratch ... 119
Select Tables to Join ... 120
Select Join ... 121
Define a Join Manually ... 122
Select Columns ... 123
Working with Your Custom Table Join ... 124
Edit Calculations with the Editor ... 125
Connect a Report Parameter to a Calculation ... 127
Troubleshoot Calculation Errors ... 128
Perform Advanced Calculations ... 129
System Calculations ... 130
Text Calculations ... 133
Show Additional Table Information ... 134
Access Non-JDE Data ... 135
Method 2: Access Non-JDE Data ... 136
Schedule Your Reports ... 137
Create a New Scheduled Task ... 138
Specify What You Want to Run ... 139
Specify When You Want to Run it ... 144
Work with Scheduled Tasks ... 148
1
Overview
Data Access Studio is the premium reporting solution for JD Edwards customers. Whether you are a business analyst, end-user, or power user, Data Access Studio empowers you to create the reports you need when you need them:
• Create and distribute dashboards • Schedule and email reports
• Automate data selection and burst reports • Create Alerts over your JDE system
• Provide the easiest way to visualize and report over JDE data
• Report over every module, table, business view, and custom JDE object • Support a wide spectrum of users
• Access real time JDE data with the best performance • Apply all native JDE security and formatting
• Provide the easiest install and ongoing software maintenance • Work on all JDE EnterpriseOne releases and JDE World releases
The software empowers you to handle the majority of your business reporting challenges.
User Guide Structure
This User Guide organizes its chapters by the following user spectrum:
User level JDE Knowledge Can Design
Reports
Technical Knowledge
Subscriber Not needed No Minimal
Quick Report Designer Minimal Yes Minimal
Ad Hoc Designer Yes Yes Some
Advanced Designer Yes Yes High
The user spectrum ranges from less technical (Subscriber) to the most technical (Administrator). Refer to the chapters of the manual that best fit your level of JDE knowledge and technical expertise. Refer to the user chapter that best fits your level of JDE knowledge.
Each user section teaches you how to use the software by showing:
• Problems you can solve
• How to solve those problems with Data Access Studio • Screen shots
• Links to video examples
Overview
3
ReportsNow Company Information
ReportsNow is an Oracle Partner that provides the high quality JDE reporting software. As you use Data Access Studio, please utilize the following resources from the ReportsNow web site: www.ReportsNow.com
Link Information
ReportsNow.com See upcoming events and WebCasts. See what's new and access all resources on the ReportsNow web site.
Video Training 24/7 access to skills-based video training.
Email support Email to send support questions or suggestions for future enhancements. Information Ask about online or on-site training. Find out more information about
ReportsNow or Data Access Studio.
Partner Information Find a quality ReportsNow business partner in your area.
Also look for ReportsNow® at your local user groups and Quest Events.
Office Locations
North America
ReportsNow, Inc.
Denver Office (Headquarters) 5299 DTC Blvd
Suite 760
Greenwood Village, CO 80111, USA Toll Free: 1-877-777-0655
Fax: 1-303-693-6995
EMEA
Zuidzijde 124
2411 RX Bodegraven The Netherlands
Phone: +31 (0) 653 899 736 Email: [email protected]
Trademarks
• Data Access Studio and ReportsNow are trademarks of ReportsNow, Inc.
• JDE, JD Edwards, EnterpriseOne, World Software are registered trademarks of Oracle Corporation. • .NET, Excel, Office, Word are registered trademarks of Microsoft Corporation.
Getting Started
Sign into Data Access Studio
JDE EnterpriseOne
Your JDE Administrator will provide you a shortcut or web page address to run Data Access Studio. Typically, this is a link to DASWeb.exe.
Once you run the link, you will sign into Data Access Studio with your EnterpriseOne credentials: User,
Password, Environment, and Role (Role is applicable to E1 versions 8.9 and higher). You can usually put *ALL in the Role field, unless you have been instructed otherwise.
If you have any issues logging in please consult your JDE administrator.
JDE World
Your JDE Administrator will provide you a shortcut or web page address to run Data Access Studio. Typically this is a link to DASWeb.exe.
Once you run the link, you will sign into Data Access Studio with your World credentials: User and Password. Data Access Studio will automatically provide the default library list for you.
Overview
5
:
Main Window
To Do this
Create a new report from a table or existing view
Click the New Report link.
Create a new report by defining a custom join
Overview
7 Work with tables external to JD Edwards Click the Non-JDE Data link.
Search for an application, report, view or table
Type text in the Search window. As you type, the search window will show JDE applications, views, tables, and reports that contain the text you type. This is a very effective way to see what the data is behind any JDE application or report. To open the data, double-click the row in the search window. Alternately, you can highlight the row and click .
The Search window includes Templates. Templates are pre-written documented reports pre-written by ReportsNow. You can use Templates directly or as a starting point for your own reports.
Access online help Click the Help button.
Access online video training Click the Video Training button.
Run Reports Published to You
User level JDE Knowledge Can Design
Reports
Technical Knowledge
Subscriber Not needed No None required
Quick Report Designer Minimal Yes Minimal
Ad Hoc Designer Yes Yes Some
Advanced Designer Yes Yes High
Data Access Studio lets Report Designers publish reports to Subscribers. Once a report is published to you, you are a Subscriber to that report. As a Subscriber:
• You see the list of reports published to you. • You can run the reports as you need.
• You can change the report data selection if the Publisher of the report allowed it. • You cannot modify and save the report.
• You cannot show columns that were hidden.
Subscriber-only users
If you are a subscriber-only user, then you:
• Need no JDE knowledge.
• Choose from reports that were published to you. • Change report parameters (if applicable). • Run reports.
• Export or print the results.
This section shows you how to run reports that are published to you in the following topics:
• Run reports published to you
• Change parameters and data selection • Run the report
• Export and print
Run Reports Published to You
9
Run Reports Published to You
Once you have signed in to Data Access Studio:
• If you are a subscriber only user, you will see the report selection screen below:
• If you are a designer, click File | Open | Reports Published to me... to see the report selection screen:
You will see one line for each report that is published to you. This form presents the report folder, report name and date the report was published to you.
To Do this
Open a report without running it Left-click the report and click Open. Alternately, you may double-click the row.
Close the Select Reports window Click Close or click the X in the upper right-hand corner of the window.
Refresh the list of reports published to you
Click Find.
Un-publish a report If you have this permission, left-click the report and click Delete.
Note: if you are not authorized to do this operation, this button will not appear on this screen.
Change the subscribers for reports If you have this permission, click the Manage Subscribers
button.
Run a report Left-click the report and click Run. The report will run with the default data selection and parameters and present you with the final result.
Save the published report to a private report which you can modify
Left-click the report and click Save To Layout. Once saved, Data Access Studio will notify you that the save was complete. You will now have a private report named the same thing as the report you copied. Note: if you are not authorized to do this operation, this button will not appear on this screen.
Change Parameters and Data Selection
If you chose to Open a report, you will have the opportunity to change the data selection (if allowed) and report parameters for that report before you run it. You can then run the report and see the result.
Here is a sample report:
To Do this
Enter a parameter Click on the box next to the parameter. Use the visual assist button to assist you in selecting valid values. User the filter helper button for advanced selection such as lists, not in list, ranges, etc.
Change the filter value of a column You may want to restrict the values you see in a certain column. If the column is visible and the change filter criteria permission is allowed, you can click the gray box below the column label to enter filter criteria. See Filter Your Data for more information.
Note: If the publisher disallowed filter changing, you will not be able to modify the column filter.
Run Reports Published to You
11
Run the Report
Once you have entered report parameters and filters, you can get sample data or run the full report. As the report runs you will see the progress bar fill.
To Do this
See a small preview of the data without
actually running the entire report Click the Get Sample Data button.
Run the report over all the data Once you entered the necessary parameters and are ready to run the report, click Run Report.
Stop an in process report
Click the Cancel button. Note: you may only the click the
Cancel button if it is enabled.
Export and Print
Once your run completes, you will see the progress bar completely filled. You will also see the results of your report. From here you can print or export your data.
To Do this
Print your report Click File | Print. Data Access Studio will format your output to PDF and show you a preview. You can then print from the resulting PDF document.
Export your report data to Excel
Click on the main toolbar.
Once you export, Data Access Studio will export, format, and save the report data to your default export directory. Data Access Studio will then, by default, open the result of the export for you to review, save, etc.
If you have the Export menu on the main menu bar for the report you are running, then you may export the data in the report as follows:
To Do this
Export your report data to Excel Click Export | All Grid Data | To Excel...
Export your report data to a web page format
Click Export | All Grid Data | HTML...
Export your report data to a PDF (Adobe Acrobat) format
Click Export | All Grid Data | PDF...
Export your report data to Access or
other similar third party software
Click Export | All Grid Data | To Tab Separated Values...
Export you report data to Oracle BI Publisher or similar third party software
Click Export | All Grid Data | XML...
Export your report data to Access or other similar third party software requiring CSV format
Click Export | All Grid Data | To CSV...
Export your report data to fixed format Use the Pad calculation to make all export columns a fixed width. Then Click Export | All Grid Data | To Fixed Format...
Export only selected rows or columns Select the columns or rows you want to export. Click Export | Selected Grid Data | and select your output format.
Run Reports Published to You
13
Drill Down
Drill Down
Drill downs are links between cells in one table to another table. For instance, an account balance can drill down into a set of General Ledger entries. Data Access Studio supports drill downs as follows:
• Master file drill downs • General Ledger drill downs • User-defined drill downs
Drills downs support multiple rows and drill down on summary values as well. E.g., if you want to drill into a rollup up summary value on a Balance Sheet, right-click the summary value and select Drill Down -> Account Ledger. DAS will show all the transactions that rolled up into that summary value automatically.
Master file drill downs
For any cell that has a master file behind it (for instance, address book number, item number, etc.), you can right-click the cell. On the popup menu, you will see Drill Down. When you click the drill down selection, DAS will open the master file and show you the details for the item you selected. If you select multiple rows in the source table, when you click the drill down option, DAS will show you master file records for all the items you selected.
General Ledger drill downs
See Account Ledger Drill Down.
User-defined drill downs
See User-Defined Drill Down
Account Ledger drill downs
These drill downs are automatically available on any new or pre-existing report over the above tables.
DAS provides the following pre-defined General Ledger Drill Downs:
• Account Balances (F0902) -> GL over any Net Posting column, Relative Period, or Period Amount column
• Asset Balances (F1201) -> GL over any Net Posting column, Relative Period, or Period Amount column • Purchase Orders (F4311) -> GL over Order Number and Amount Received columns
Account Balances Drill Down(F0902)
For any report that runs over the Account Balances table (F0902)--which includes Financial Quick Reports, you can drill into amounts. To Drill down into an amount, right-click the amount and select Drill down -> Account Ledger:
DAS will open the account ledger and show you the transactions and transaction totals for the item you drilled into. Note: you can drill into a summary as shown above or into a detail cell.
Asset Balances Drill Down(F1202)
For any report that runs over the Asset Balances table (F1202)--which includes Fixed Asset Quick Reports, you can drill into amounts. To Drill down into an amount, right-click the amount and select Drill down -> Account Ledger.
Run Reports Published to You
15
User-defined Drill Down
You can connect any report to any other report with the Burst calculation. This allows you to create any row-level drill down you need.
When designing a drill down you need two DAS Reports:
• A driver report • A target report
DAS drills down from the driver report to the target report.
• Create a target report that will show the details for a driver. For example, re-ordering items for a business unit. The target report takes a business unit as its input and shows if any items need to be re-ordered for that business unit.
• Open a driver report. In our running example, this would be a list of business units. This will be the business units for which we want to drill into the target.
• Click Design | Edit Calculations.
• Select Burst.
• For Report enter the name of the report that will show the drill down information for your source report.
• Connect your source report to the target report by passing values from source to target. In our example, connect the business unit from the driver to the business unit of the target.
• Save your calculations.
You can now right click any row in your source report and you will see:
When you click Run target report for row, DAS will launch the target report and pass the values for the selected row automatically. The result is a Drill Down for the driver row.
NOTE: You will only see the other menu item Burst selected rows if you enabled multiple row security for your user profile. Consult your DAS administrator to set up this permission if you need multi-row bursting.
17
Design a Quick Report
User level JDE Knowledge Can Design
Reports
Technical Knowledge
Subscriber Not needed No Minimal
Quick Report Designer Minimal Yes Minimal
Ad Hoc Designer Yes Yes Some
Advanced Designer Yes Yes High
Data Access Studio version 5.0+ empowers users with limited JDE knowledge to create a wide variety of practical business reports. The Quick Report user typically possesses finance, payroll, sales, etc. knowledge, but does not necessarily know where JDE stores this information.
The Quick Report system guides you through business language and options so that you can create the reports you need.
You can access the Quick Report menu as follows:
1. Select File | Quick Report.
2. Select from the available Quick Reports, e.g., Financials.
Create a Financial Balances Report
The Financials Quick Report allows a finance user to create reports such as:
• Balance Sheet • Income Statement • Trial Balance • Budget vs Actual
• Business Unit comparison
• Period, quarter, yearly comparison • and more
To get started, sign in then:
• Click File | Quick Report | Financials.
The Quick Report lets you specify what kind of report you want and how you want to create it.
To Do this
Enter information on a particular tab Click the tab or click Previous and Next navigate the tab control. See topics that follow.
Create the financial report with the
parameters you specified Click Ok. Exit the designer
Design a Quick Report
19
Specify Type of Financial Report
The first step of defining your report is to select what type financial report you want. Enter this information on the Main tab:
In this version, all reports are based on the Posted balances file in JDE.
To Do this
Type of your report (Required) Select the type of financial report that you want to create. After selecting the basic types, you can use the rest of the wizard to customize it further (for example, you can split an Income Statement into multiple periods or compare actual vs. budget). Name your report (Required) Click on the edit box next to Report name and type a
descriptive name for your report. This is a mandatory step. If your business organizes accounts with
the category code information in the JDE Chart of Accounts
Click the check box labeled: I need category codes from the chart of accounts.
If you need to access category codes in the JDE Business Unit table
Click the check box labeled: I need category codes from the business unit master information.
Once you are finished, click the Periods tab.
Specify Financial Periods
You can show amounts by period, quarter, year, or Year-To-Date period. You can also compare period amounts to amounts in previous periods or years.
To Do this
Select how to organize the periods in your report
Click the Organize by option box. Select Fiscal Period, Fiscal Quarter, Fiscal Year, and/or YTD Period.
Compare a period to previous periods Change the Compare to previous number to the number of periods you want to compare against. Set the option box next to the number to Fiscal Period.
Compare a period to the same period in previous years
Change the Compare to previous number to the number of years you want to compare against. Set the option box next to the number to Fiscal Year.
Compare a quarter to previous quarters Click the Organize by option box. Select Fiscal Quarter. Change the Compare to previous number to the number of quarters you want to compare against. Set the option box next to the number to Fiscal Quarter.
Compare a quarter to the same quarter in previous years
Click the Organize by option box. Select Fiscal Quarter. Change the Compare to previous number to the number of years you want to compare against. Set the option box next to the number to Fiscal Year.
Design a Quick Report
21 as Budget vs Actuals) Financial Column Rollup to specify how to split the period
values. If you want to change the Caption for the
period columns
Specify Financial Row Rollup
The next step is to define how you want to organize your row information. You have three choices depending on your needs:
• User Defined List - Manually define each account rollup
• Chart of Accounts - Use the JDE Chart of Accounts to define the account hierarchy • Account Group - Rollup accounts by the object accounts
User Defined List
The User Defined List option gives you a flexible way to define manually how you want your financial
information displayed. Each row in the grid below represents how to rollup detailed information into one line. Initially you must add each row your need. Once you are finished, you can save your list so that you and others may re-use the work you did.
The editor in this grid lets you:
• Define as many rows as you want • Define the criteria you need for each row
Sample screen shot showing a user-defined list
Design a Quick Report
23 If you use the JD Edwards chart of accounts for your financials, this option is a powerful way to represent your numbers. Select the Level of detail (1 = least detailed, 2 = more detailed, 3 = more, etc.). Select how you want to see the roll-ups labeled (Display rows as). Check the Dynamic level of detail if you want the ability to change the level of detail on-the-fly when you work with your report. Enter a Model business unit if you want to use the chart of account structure for a particular business unit.
Account Group
Use this option if you want to roll up simply by the object account. Select how you want to see the roll-ups labeled (Display rows as).
Design a Quick Report
25
Financial Column Rollup - Optional
The Columns tab lets you show side-by-side comparisons of financial information. For instance, suppose you wanted to show a side-by-side comparison of Actual amounts and Budget amounts. In this example, you would enter two lines in the grid: one for Actual and one for Budget.
The editor lets you:
• Define as many side-by-side categories as you want • Define the criteria you need for each category
To show side-by-side comparisons of Do this
Business units Add a line for each business unit you want to compare.
Companies Add a line for each company.
Ledger types Add a line for each ledger type.
Category code Add a line for each category code criteria.
etc...
Special Settings
The Special Settings tab lets you set preferences for your financial report.
To Do this
Change how you want to prompt for date Select By date or By period from the pull down box. Change the text for prompting date
information
Select one of the pre-defined prompts: As of or For the period ending from the pull down box. Or you may type in your own date prompt text.
Define the accounts to reverse sign For financial statements to balance in JDE, one must negate the values of the Revenue accounts. Define the revenue accounts in your system here by any criteria you choose (object range, category code, etc.). Once set, DAS will remember the setting as you create new financial reports.
Define the balance sheet accounts For balance sheet accounts, one must add the beginning balance to get the cumulative actual amount of the account. Define the balance sheet accounts in your system here by any criteria you choose (object range, category code, etc.). Once set, DAS will remember the setting as you create new financial
Design a Quick Report
27
Create a Fixed Assets Report
The Capital Asset Management Quick Report allows a user to create reports over fixed assets.
To get started, sign in then:
• Click File | Quick Report | Capital Asset Management.
The Quick Report lets you specify what kind of report you want and how you want to create it.
To Do this
Enter information on a particular tab Click the tab or click Previous and Next navigate the tab control. See topics that follow.
Create the financial report with the
parameters you specified Click Ok.
Exit the designer Click Cancel.
Design a Quick Report
29
Specify Type of Financial Report
The first step of defining your report is to select what type financial report you want. Enter this information on the Main tab:
In this version, all reports are based on the Posted balances file in JDE.
To Do this
Name your report (Required) Click on the edit box next to Report name and type a descriptive name for your report. This is a mandatory step. If you need to asset master information
in your report
Click the check box labeled: I need information from the asset master.
If you need to access category codes in the JDE Business Unit table
Click the check box labeled: I need category codes from the business unit master information.
Once you are finished, click the Periods tab.
Specify Financial Periods
You can show amounts by period, quarter, year, or Year-To-Date period. You can also compare period amounts to amounts in previous periods or years.
To Do this
Select how to organize the periods in your report
Click the Organize by option box. Select Fiscal Period, Fiscal Quarter, Fiscal Year, and/or YTD Period.
Compare a period to previous periods Change the Compare to previous number to the number of periods you want to compare against. Set the option box next to the number to Fiscal Period.
Compare a period to the same period in previous years
Change the Compare to previous number to the number of years you want to compare against. Set the option box next to the number to Fiscal Year.
Compare a quarter to previous quarters Click the Organize by option box. Select Fiscal Quarter. Change the Compare to previous number to the number of quarters you want to compare against. Set the option box next to the number to Fiscal Quarter.
Compare a quarter to the same quarter in previous years
Click the Organize by option box. Select Fiscal Quarter. Change the Compare to previous number to the number of years you want to compare against. Set the option box next to the number to Fiscal Year.
Design a Quick Report
31 Split period values (such as Budget vs
Actuals)
Check the Split column values by criteria. Once checked, see Financial Column Rollup to specify how to split the period values.
Change the Caption for the period columns
Specify Fixed Asset Row Rollup
The next step is to define how you want to organize your row information. You have two choices depending on your needs:
• User Defined List - Manually define each asset rollup • Asset Group - Rollup accounts by the object accounts
User Defined List
The User Defined List option gives you a flexible way to define manually how you want your information displayed. Each row in the grid below represents how to rollup detailed information into one line. Initially, you must add each row your need. Once you are finished, you can save your list so that you and others may re-use the work you did.
The editor in this grid lets you:
• Define as many rows as you want
• Define the criteria and formulas you need for each row
Sample screen shot showing a user-defined list
Design a Quick Report
33
Special Settings
The Special Settings tab lets you set preferences for your financial report.
To Do this
Change how you want to prompt for date Select By date or By period from the pull down box. Change the text for prompting date
information
Select one of the pre-defined prompts: As of or For the period ending from the pull down box. Or you may type in your own date prompt text.
Define the balance sheet accounts For balance sheet accounts, one must add the beginning balance to get the cumulative actual amount of the account. Define the balance sheet accounts in your system here by any criteria you choose (object range, category code, etc.). Once set, DAS will remember the setting as you create new financial reports.
Limit which object accounts your financial report shows
Enter a begin object account (OBJ) value and end object account value that define the inclusive range that you want to display in your report.
35
Design Reports
User level JDE Knowledge Can Design
Reports
Technical Knowledge
Subscriber Not needed No Minimal
Quick Report Designer Minimal Yes Minimal
Report Designer Yes Yes Some
Advanced Designer Yes Yes High
Ad Hoc Report Design is one of the strengths of Data Access Studio. Data Access Studio empowers you to deliver a large variety of reports in a timely manner by:
• Allowing you to visually create your report with sample data • Presenting real-time data exactly as you see it in JDE • Applying automatic performance improvements
• Enforcing read-only queries so you can design with confidence
To create Ad Hoc Reports in Data Access Studio you need to know how to:
• Get the Data You Need • See Sample Data • Edit Your Report • Format Your Layout
• Calculate Values Over Your Data • Find Trends in Your Data
• Export and Print Results • Publish Your Report to Others
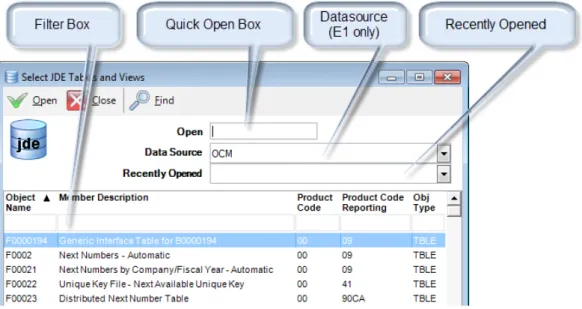
Get the Data You Need
Data Access Studio can open any JDE table, business view, or logical for which you have access. From the main menu, click:
File | Open | EnterpriseOne Data... or File | Open | World Data...
To Do this
Search by Name Click on the Filter box under Object Name. Type in a JDE table or business view name. Click Find on the toolbar. Browse the list of results in the grid. Highlight the row(s) you want to open and click Open.
Search by Description Click on the Filter box under Member Description. Click the Filter helper button . Choose any of the Filter Helper options such as Begins with, Contains, etc. Type in the search text. Click Find on the toolbar. Browse the list of results in the grid. Highlight the row(s) you want to open and click
Open.
Open by Quick Open Type the Object Name of the table or view you want to open in the Quick Open box. Click Open.
Change the data source where you open the table (EnterpriseOne only)
Click the Data Source option box. Select from the list of available data sources. Note: if the administrator revokes this permission, you will not see the Data Source option box. Open a recently opened table Click the Recently Opened option box. Click any item in the
Design Reports
37
Open a Table for First Time
When you open a table or business view, Data Access Studio will close the form above and open a new window for the item you want to query.
For example, let's say you opened the JDE Work Order Master File (F4801). You would see a form that resembles the following:
When Data Access Studio opens a table for the first time, notice the following:
• The description, object, and data source appear in the title of the window.
• The quick menu with Run Report, Get Sample Data, etc. shows at the top of the grid.
• All columns are shown with the default Description style. The column descriptions come from the JDE data dictionary. E.g., you see the column header Order Number instead of the cryptic DOCO. See the Customize the Look and Colors of Your Report topic for more information on how to change the column caption and other styles.
• The grid in the form initially has no data in it. Add filter criteria and click Get Sample Data.
Open a Table for the Second Time
When you open a table for the second time, Data Access Studio will open the last layout your were working on for that table. See Manage Your Report for more information.
See Sample Data
Once you open the JDE table, the second step is to get some sample data. Data Access Studio is a visual report writing system. Getting sample data helps users visualize the report as they design it. Refer to the following Data Access Studio main tool bars:
Find and Find Progress toolbar:
Quick menu toolbar:
To Do this
See sample data with no filter
Click the Get Sample Data button.
See sample data with a filter Enter filter information in the Filter Boxes underneath each Column Header. Click the Get Sample Data button. See sample data with count of total
records
Enter filter information in the Filter Boxes underneath each Column Header. Click the Find with Count button.
Note: if the administrator restricts this capability, you will not see the Find with Count button. Note: if you do not specify filter information prior to pressing the Find with Count button, Data Access Studio will issue a performance warning.
Load another page of records
Click the Get More Data button. Go to previous page of records in grid Scroll to the top using the vertical scroll bar. Load all records for query
Click the Run Report button . As the report runs, you will see Counting Records, Selecting Records, and then the progress bar loading the records. When the load is done the Progress Indicator will show a full progress bar.
Go to the first row Scroll to the top using the vertical scroll bar or click CTRL-Home on your keyboard.
Cancel a large row load
When you load records, the Cancel button on the toolbar will be enabled. When enabled, you may click the Cancel
button to stop the record load. The status bar will indicate that the grid is partially loaded.
Design Reports
39
Filter Your Data
Data Access Studio provides a robust and simple way to get the data you need. When you open a table, each column has a Filter Box directly beneath the column caption:
When you click on the filter box, you will see the Filter Helper button. If the column has a Visual Assist, you will also see the Visual Assist button.
To filter for Do this
Direct text Click the Filter Box and type in the number, string, or date you need to find.
Values in the Visual Assist Click the Visual Assist button. Select from the valid values. Click Ok.
A list of values Click and select List. In the list form, type the values you need on each line and click Ok.
Values you want to exclude from your
query Click and select Not in list. In the list form, type the values you want to exclude on each line and click Ok.
Items that begin with specific text Click and select Begins with. In the list form, type the "begins with" text on each line and click Ok.
Items that contain specific text Click and select Contains. In the list form, type the "contains" text on each line and click Ok.
Items that end with specific text Click and select Ends with. In the list form, type the "end with" text on each line and click Ok.
Items that fall into a range Click and select Range. See Filter a Range topic. Items that fall into a range relative to
today Click Today's Date topic. and select Today. See Filter a Range Relative to Items that are blank Click and select Blank.
Items that are not blank Click and select Not Blank.
Report Parameter value If your report has Report Parameters, you can filter using these values. Click | Report Parameters and select the parameter you want to apply.
Filter a Range
When you select the Range filter option, Data Access Studio will prompt you with the following form:
To filter Do this
From a specific value Check the box next to From. Uncheck the box next to
Through. Select From option. Type in the value in the edit box. Click Ok.
From and excluding a specific value Check the box next to From. Uncheck the box next to
Through. Select From and excluding option. Type in the value in the edit box. Click Ok.
Through a specific value Check the box next to Through. Uncheck the box next to
From. Select Through option. Type in the value in the edit box. Click Ok.
Through and excluding a specific value Check the box next to Through. Uncheck the box next to
From. Select Through and excluding option. Type in the value in the edit box. Click Ok.
Between two values Check the box next to From. Check the box next to Through. Select From option. Select Through option. Type values in both edit boxes. Click Ok.
Design Reports
41
Filter a Range Relative to Today's Date
The Today Range Filter lets you specify date ranges relative to today's date. This is very useful if you want your report to always run on a set time window relative to today's date. For example, you can setup a range that runs between today and three months ago. Every time you run the report, the report will always show only the dates that fall into the window relative to the time the report was run.
When you select the Today filter option on a date column, Data Access Studio will prompt you with the following form:
To filter Do this
From a specific offset Check the box next to From. Uncheck the box next to
Through. Select From option. Enter a positive or negative offset. Select Days, Months, or Years option. Click Ok. From and excluding a specific offset Check the box next to From. Uncheck the box next to
Through. Select From and excluding option. Enter a positive or negative offset. Select Days, Months, or Years option. Click Ok.
Through a specific offset Check the box next to Through. Uncheck the box next to
From. Select Through option. Enter a positive or negative offset. Select Days, Months, or Years option. Click Ok. Through and excluding a specific offset Check the box next to Through. Uncheck the box next to
From. Select Through and excluding option. Enter a positive or negative offset. Select Days, Months, or Years option. Click Ok.
Between two offsets Check the box next to From. Check the box next to Through. Select From option. Select Through option. Enter a positive or negative offsets. Select Days, Months, or Years option. Click Ok.
Filter with Form (advanced)
On occasion, you will need more advanced filtering than can be specified by the column filters. In these rare cases, you can define filter criteria using the Additional Criteria form. On the Main Menu, click Design | Additional Criteria...
To filter Do this
Enter OR logic Enter Field and Criteria information for one row. On the next row, under
Field, select Chain or. Then Enter Field and Criteria information for the following row. E.g.:
Move a criteria row
Click the grip bar and drag row to new position. Copy a criteria row Highlight the row to copy. Click Copy Row. Delete a criteria row Highlight the row to copy. Click Delete Row. Accept changes
Click OK. Reject changes Click Cancel.
Design Reports
43
Manage Your Report
Now that you have opened a table or business view, you can edit it to create the report you need.
Data Access Studio provides a wide array of ways to format, rearrange, calculate, and group information into the format you need. As you edit your report, you will be the only one who sees your changes--hence the term
Private Report. Once you are done with your report, you may elect to publish it to others so that they may benefit from your work.
To Do this
Save your private report Click File | Save. If this is the first time you are saving your report, Data Access Studio will prompt you for the report name. Enter the name and click Ok.
Pick a report you saved from an open table
Click the List of reports option box on the tool bar. Select the report you want for the table that is open.
Pick the default report Click the Report List option box on the tool bar. Select the blank report at the top.
Copy your report Click File | Save As... Data Access Studio will prompt you to enter a new name. Once you click Ok, Data Access Studio will copy your Report to the new name.
Delete a report Click File | Delete. Data Access Studio will prompt you to confirm deleting your report. Click Ok to delete.
Restore your Report from the last time
you saved it Click restore the report from the last time you saved it. File | Restore. Data Access Studio will prompt you to Undo the last change you made Click Undo.
Redo the last thing you undid Click Redo.
Once you are finished editing your Report, you can:
• Run it privately
Access Your Reports
Once you build your collection of Reports, you can access them at any time by clicking File | Open | My Reports... Once clicked, Data Access Studio will show you all of your Reports as follows:
To Do this
Open a report by name Click on the Filter box under Report. Type in a report name or wildcard (*). Click Find on the toolbar. Browse the list of results in the grid. Highlight the row(s) you want to open and click Open.
Sort by most recently created reports Right-click Date. Select Sort Descending. Change the data source where you want
to open the report (EnterpriseOne only)
Click the Data Source option box. Select from the list of available data sources. Note: if the administrator revokes this permission, you will not see the Data Source option box. Open by selecting a report that you
recently opened
Click the Recently Opened option box. Click any item in the list to open the report with which you previously worked. Delete a report Highlight the report(s) you want to delete in the grid. Click
Delete. Data Access Studio will prompt you to confirm the delete. Click Ok.
Create a new report
Click the New button. See Create a Table Join from Scratch.
Close this form Click Close.
Design Reports
45
Publish Your Report to Others
To publish your report, open your private report and click: File | Publish... Once clicked, you will see the following form:
If the report was not previously published, the Previously published value will be No. If the report was previously published, this will say Yes and also show who published the report. By default security, only the person who published the report last can re-publish it. This prevents users from inadvertently overwriting each other's published reports.
To Do this
Change the name of the published Report
Click the edit box next to To report: and type in a new name.
Select Subscribers for your published Report
Click on the selection box under the User ID column. Pick Subscribers by their JDE User ID, Role, or Group. Add as many users, roles or groups as you need. If you select
DASUSERS then your report will be published to everyone who uses Data Access Studio.
Disallow Subscriber to change data selection in your report
For each subscriber row, uncheck the Allow user to change data selection check box.
Allow Subscriber to hide and show columns
By default, the Subscriber cannot hide and show columns in a published report. Check the Allow user to hide and show columns button to let the Subscriber hide and show columns in the published report.
To publish the report with the settings
you added Click Publish. Once published, your subscribers will be able to see and run your Report.
Delete a published Report
Click Delete. Data Access Studio will prompt you to confirm the delete. Click Ok.
Close this form Click Close.
If you present your data in Excel and want to control it
folder click the visual assist for the To folder and select a valid folder. If you do not have folder permission, then the report will go to the Unassigned folder (from which a user with rights can move it to the desired folder).
Excel Presentation Options
To Do this
Show the Excel presentation Only (and hide the Data behind it)
Check the Show Excel Presentation Only.
To make the Excel presentation unmodifiable by the subscriber
Check the Make Excel Read Only box.
Hide Excel Menus Check the Hide Excel Menus box.
Hide designated worksheets Add the names of the worksheets that you do not want to show to the subscriber under the Sheet grid.
Design Reports
47
Manage Report Subscribers
Once you have published a report, you can conveniently add to or remove subscribers from the report in mass. Example: If you have 20 reports and want to add a new subscriber to each (or remove a subscriber from each). To manage report subscribers:
1. Click File | Open | Reports Published to me.
2. If you have the permission to un-publish (Delete) published reports, you will see the Manage Subscribers button.
3. Select one or more reports (use CTRL and SHIFT keys to multi-select). 4. Click the Manage Subscribers button.
IMPORTANT: If you selected more than one report, the Subscribers list is the union or combination of the subscribers of all reports you selected. This feature makes it easy to make the subscribers for a set of reports the same.
To Do this
Remove a subscriber Highlight one or more subscribers and press Delete.
Add a subscriber Click on the blank cell in the Subscribers grid. Click the visual assist button . Select a new user from the valid users. Apply your changes Once you edit your Subscriber list, click Assign Subscribers
to Report to apply the changes to the report list. Cancel operation without making
changes Click the Close button.
Format Your Report
Now that you understand how to save, restore, and publish your report, we can address modifying your report. When you modify the report you will be transforming your data closer and closer to the final form that you need it. These transformations are the building blocks for creating any report.
The majority of formatting operations are found on the Column Menu. To access the Column Menu on any grid:
See the following sections to see how to use each of the options on this Column Menu and more.
Design Reports
49
Show Only the Columns You Need
JDE tables have many columns. In most cases, too many columns for a readable report. That's why Data Access Studio lets you easily hide and show columns as you need. Furthermore, as a performance benefit, the more columns you hide, the faster your query will run over large data sets.
You can hide and show columns in the following ways:
• Click Design | Columns in the Quick Menu above the grid
• Click Design | Hide and Show Columns...
• Right-click the columns (Column Menu): • Show Only Columns
• Hide Columns
• Hide/Show Columns
When you select Hide/Show Columns, DAS will display the following form:
To Do this
Search for a column by name Type in the name of the column in the Filter Box under Column Caption.
Hide or show a column Check to Show. Uncheck to hide.
Hide or show multiple columns Hold the CTRL key down and click the columns you need. Then right-click your selection and select Uncheck
highlighted items to hide. Select Check highlighted Items to show.
To accept your changes
Click Ok.
To cancel your changes Click Cancel.
Place Columns in the Positions You Need
Data Access Studio makes moving columns easy. Simply click the column header and drag it to where you want it. You may also multi-select columns with the CTRL or SHIFT keys and drag-and-drop columns as a whole.
To move the Item column below:
1. Click the Column Header.
2. Hold the mouse key down and move the column to the desired position. 3. Let go of mouse button to drop:
Design Reports
51
Get Description for Cryptic JDE Data
JDE Data contains many codes and numbers that are not readable in plain English. Data Access Studio solves this problem with instant Associated Descriptions. For instance, consider the data in Account ID:
Clearly the data in Account ID is not understandable in plain English. JDE however has an Associated Description for Account ID that provides its English description.
For any column that has a JDE Associated Description, simply double-click the Column Header. Alternately, you can click the Column Header and select Quick Calculation | Enterprise One (or World) | Associated Description:
Example result
The Associated Description calculation creates a new column next to the coded column. The new column shows the English-readable description- which makes your report more readable.
You may hide the original column once you get its associated description.
If a column does not have an associated
description, such as the Amount column, then you will not see the Associated Description on the Column Menu.
Get Totals by Column
With most reports you write, you will need to rollup information into a summary value. Data Access Studio provide this capability with Grouping and Summarizing.
Example
Let's say we have the account balance details, as shown on the left. We want to create a summary total for each account. Having this summary will let us know if an account is in balance or not.
The first step is to group the things we want to summarize by. To group by any column, right-click the column header to get the Column Menu. Select Group By This Column.
When we group by Account ID, notice that Data Access Studio collects all accounts with the same name and puts them together! Also, because Amount is a numeric field, DAS automatically sums the values and shows you the result. Also, notice that the summary operation puts a Grand Total at the bottom.
To change a summary, right-click the column header to get the Column Menu and select
Summarize | Sum.
Once you group a column, you can click the Group Expand button to see the detail lines. This can be a great way to double-check your information.
Also, you may group more than one column. For each column you group, Data Access Studio will create a subtotal automatically. You can control how you want to rollup your groups. For more information see Fine tune Grouping and Summarization.
You can do other summaries as well: Count, Minimum, Maximum, Average and None. You can right-click any summary on the grid and either Suppress or Un-Suppress it.
Design Reports
53
Show Data in Any Order
Data Access Studio lets you sort any column or set of columns.
To Do this
Sort a column from smallest to largest Right-click the Column Header. Click Sort Ascending. Sort a column from largest to smallest Right-click the Column Header. Click Sort Descending. Sort many columns from smallest to
largest
Hold the CTRL key down and multi-select the columns you want. The order in which you click the columns will determine which column is sorted first. Right-click the Column Header. Click Sort Ascending.
Sort many columns from largest to smallest
Hold the CTRL key down and multi-select the columns you want. The order in which you click the columns will determine which column is sorted first. Right-click the Column Header. Click Sort Descending.
Sort by both smallest to largest and largest to smallest for multiple columns
Hold the CTRL key down. Right-click the Column Header. Pick a different sort than the one it shows.
Customize the Look and Colors of Your Layout
You can change the look of your layout by clicking File | Layout | Grid Styles...
To Do this
Make your layout look like a clean white report
Click Report Look.
Make your layout look like a spreadsheet Click Spreadsheet Look. Change the Font, Font Color or
background of the available styles
Click on the Font, Font Color, or Background of any cell to modify the property.
Hide/show vertical lines in your grid Uncheck/Check Show Vertical Lines. Hide/show horizontal lines in your grid Uncheck/Check Show Horizontal Lines. Hide/Show summaries in your grid Uncheck/Check Summaries.
Design Reports
55
Customize the Look and Colors of Your Layout (continued)
To Do this
Place summaries on the same line as your group label (default)
Check Summary on group line.
Force report to sort data at the database Check Sort at Database. This option is for advanced users only. If the Administrator denies this privilege from you, this check box will have no effect.
Fit column widths automatically after each Find
Check Auto-Width On Find.
Keep your manual column widths intact Uncheck Auto-Width On Find. Let Data Access Studio automatically
control the character casing for filters
Check Auto-Uppercase Filters.
Hide/Show the row indicator column at the left
Uncheck/Check Show row indicator.
Hide/Show the calculation indicator in the column header
Uncheck/Check Show calculation indicator.
Turn off Smart Filters Certain calculations such as Relative Dates and Relative Periods can control the filters in the grid. Also, if you have a one-to-many join, checking this box will automatically correct your query. If you want to disable this behavior, uncheck this box.
Select a different Column Header type Click the Column Header options box and select the option you want to see.
Change the indicator font for Multi-Sort Uncommon. Click the Multi-Sort Font Size options box and select new size.
Add Charts and Advanced Formatting
You can present your report with all the features of Excel. With Excel Presentation, your query comes alive with Graphs, Dashboards, and pixel-perfect formatting:
To present your data in Excel, right-click a column to get the Column Menu. Select Presentation. Data Access Studio will display the following screen:
Design Reports
57
To Do this
Add additional columns to present Click on the visual assist in the From grid list. Select the columns you want.
Re-order the sequence of columns
Click on the grip bar and drag the column name to the position you want.
Map data to embed Excel but do not graphically present it (old style Embed Excel)
Set Sheet to blank or DASLink.
Change the target sheet where you want to present the grid data
Change the Sheet text box to the name of the Excel sheet you want.
Change the target cell where you want to present the grid data
Change the Cell column and row values.
Change upper limit on the number of rows for the presented data
Change the Row Padding value. The Row Padding value sets the upper limit on the number of rows Excel will present. Pick the largest number that you know will be bigger than the number of rows you expect from your query and grouping. For instance if your grid groups business units and you know that the maximum number of business units for any given query will not exceed 500, then set the Row Padding to 500. If you make this number smaller, it will be easier to format your Excel presentation later.
Only map data (and hence do not graph the values)
rows and values of the chart are the values in the grid
Chart Type and select the type of chart you want. DAS will create an array of that chart type in the Excel presentation. Create a chart for each row. X axis =
columns and values of the chart are the values in the grid
Check One chart per row. Select the visual assist for Chart Type and select the type of chart you want. DAS will create an array of that chart type in the Excel presentation.
Specify how you want the graphs to be laid out in the presentation
Click the Pattern option and select how many columns to use when laying out the resulting graphs.
Specify borders for your graphs Check the Border box for borders. Un-check the Border box to create graphs with no borders.
Specify round corners for your graphs Check the Round Corners for round corners. Un-check for square corners.
Once you have configured the options you want, click the Map Columns to Excel to complete the presentation. Whenever you Map Columns to Excel, DAS overwrites the previous mapping. Sometimes, it is a good idea to clear the target sheet before re-mapping graphs to it...