Reducing the rare event: lessons from
the implementation of a
ventilator bundle
Maryanne Matinee Chumpia,1,2 David A Ganz,1,2 Evelyn T Chang,1,2 Shelly S de Peralta3
To cite: Chumpia MM, Ganz DA,
Chang ET, et al. Reducing the rare event: lessons from the implementation of a ventilator bundle. BMJ Open Quality 2019;8:e000426. doi:10.1136/ bmjoq-2018-000426
Received 9 May 2018 Revised 2 April 2019 Accepted 20 May 2019
1Medicine, VA Greater Los
Angeles Healthcare System, Los Angeles, California, USA 2Medicine, University of
California Los Angeles, Los Angeles, California, USA 3Nursing, VA Greater Los
Angeles Healthcare System, Los Angeles, California, USA
Correspondence to
Dr Maryanne Matinee Chumpia; mchumpia@ mednet. ucla. edu © Author(s) (or their employer(s)) 2019. Re-use permitted under CC BY-NC. No commercial re-use. See rights and permissions. Published by BMJ.
AbstrAct
The ventilator-associated event (VAE) is a potentially avoidable complication of mechanical ventilation (MV) associated with poor outcomes. Although rare, VAEs and other nosocomial events are frequently targeted for quality improvement efforts consistent with the creed to ‘do no harm’. In October 2016, VA Greater Los Angeles (GLA) was in the lowest-performing decile of VA medical centres on a composite measure of quality, owing to GLA’s relatively high VAE rate. To decrease VAEs, we sought to reduce average MV duration of patients with acute respiratory failure to less than 3 days by 1 July 2017. In our first intervention (period 1), intensive care unit (ICU) attending physicians trained residents to use an existing ventilator bundle order set; in our second intervention (period 2), we updated the order set to streamline order entry and incorporate new nurse-driven and respiratory therapist (RT)-driven spontaneous awakening trial (SAT) and spontaneous breathing trial (SBT) protocols. In period 1, the proportion of eligible patients with SAT and SBT orders increased from 29.9% and 51.2% to 67.4% and 72.6%, respectively, with sustained improvements through December 2017. Mean MV duration decreased from 7.2 days at baseline to 5.5 days in period 1 and 4.7 days in period 2; statistical process control charts revealed no significant differences, but the difference between baseline and period 2 MV duration was statistically significant at p=0.049. Bedside audits showed RTs consistently performed indicated SBTs, but there were missed opportunities for SATs due to ICU staff concerns about the SAT protocol. The rarity of VAEs, small population of ventilated patients and infrequent use of sedative infusions at GLA may have decreased the opportunity to achieve staff acceptance and use of the SAT protocol. Quality improvement teams should consider frequency of targeted outcomes when planning interventions; rare events pose challenges in implementation and evaluation of change.
Problem
The U.S. Centers for Disease Control and Prevention (CDC) has stated that eliminating healthcare-associated infections (HAIs) is a ‘Winnable Battle’ because interventions exist to mitigate public health impact.1
Surveil-lance for one type of HAI, ventilator-associ-ated pneumonia (VAP), was challenging due to the absence of a consistent, objective defi-nition for VAP, so in 2013, the CDC launched
a new case definition using readily obtainable data: the ventilator-associated event (VAE). VAEs are sustained increases in oxygenation needs of a patient on mechanical ventila-tion (MV) following a period of stability or improvement and have been associated with longer intensive care unit (ICU) and hospital lengths of stay and higher mortality.2–4 VAEs
may not be completely preventable, although decreasing MV exposure with ventilator weaning practices is recommended.5 Patients
must be ventilated for at least four calendar days to fulfil VAE criteria.6
The U.S. Department of Veterans Affairs (VA) assesses performance at VA medical centres using a scorecard of measures called Strategic Analytics for Improvement and Learning (SAIL); it includes VAEs with other HAIs in the ‘avoidable adverse events’ domain of its quarterly reports.7 In October 2016, VA Greater Los Angeles (GLA) ranked in the bottom decile of all VA medical centres in overall SAIL performance, and GLA lead-ership selected HAIs as one of six targets for improvement. We focused on VAEs since their incidence (6.8 events per 1000 venti-lator days in the 18 months preceding our intervention) was worst of all HAI measures based on the VAE benchmark of zero events in all VA medical centres nationally.7
At the time of our project, all MV patients at GLA were admitted to a 22-bed combined medical/surgical ICU where they received care from multidisciplinary teams consisting of physicians, nurses and respiratory thera-pists (RTs), among others. Coordinating these providers for ventilator weaning was difficult because of frequent resident and nurse turn-over and limited RT availability. GLA is affili-ated with several residency programmes from nearby universities, so residents may have spent only 4 weeks at GLA over an academic year. Although nurses’ presence was more stable relative to residents, GLA experienced high nursing staff turnover and hired a new
on September 12, 2020 by guest. Protected by copyright.
ICU nurse manager in September 2016. RTs caring for MV patients had simultaneous assignments in other non-ICU areas of the hospital but were available by pager.
Non-personnel factors also affected ventilator processes. The ICU case severity index, a measure of illness severity with higher indices reflecting a higher proportion of more critically ill patients, was higher at GLA than other VA medical centres in southern California. Conversely, the ventilator utilisation ratio (ie, ventilator days divided by ICU bed days) of 0.27 was below the nationwide VA system average (0.34, 0.25 and 0.18 were the 50th, 25th and 10th percentiles, respectively, based on the latest avail-able national data from 2014)8 and half of MV patients on
average had sedative infusion orders. While having and sedating fewer MV patients may decrease VAE risk at the unit level, these practices reduce opportunities to stan-dardise ventilator weaning for individual MV patients.
Our specific aim was to decrease average MV duration of patients with acute respiratory failure (ARF) to less than 3 days (from a baseline of 7.2 days) by 1 July 2017.
background
Evidence for VAE prevention comes mostly from observa-tional studies. In their 2014 guideline update, the Infec-tious Diseases Society of America (IDSA) and Society for Healthcare Epidemiology of America (SHEA) recom-mended adopting VAP prevention strategies to also prevent VAEs, including daily sedation interruptions in spontaneous awakening trials (SATs) and daily assess-ments of extubation readiness in spontaneous breathing trials (SBTs) to decrease MV duration.5 Because acute
respiratory distress syndrome, fluid overload and haem-orrhage can cause VAEs, some experts suggest low tidal volume ventilation, conservative fluid management and conservative transfusion thresholds as additional preven-tion strategies.3 9 One retrospective cohort study in 2015
found significant associations between SATs, SBTs, head of bed elevation, thromboembolism prophylaxis and chlorhexidine oral care with shorter time to extubation and lower on-ventilator mortality, but only SBTs were associated with decreased VAE likelihood.10
Although IDSA/SHEA guidelines suggest bundling interventions to improve compliance with these prac-tices,5 literature on implementing ventilator bundles
is mixed.11–15 Improvement teams in two Scottish ICUs
reduced VAP rates in both hospitals using different strat-egies; one changed workflows to close communication gaps between providers, while the other used key opinion leaders and huddles to reinforce desired behaviours.16
In 2007, a systematic review of VAP prevention studies showed decreased VAP rates in several ICUs in the USA, Argentina and Pakistan through implementation of similar educational programmes combined with surveil-lance feedback.17 In these studies, however, baseline VAP
rates were fairly high, ranging from 7.5 to 51.3 infections per 1000 ventilator days. A cluster-randomised trial of 60 ICUs in the USA (with median baseline VAP rate of 2.9
infections per 1000 ventilator days) compared a toolkit with a virtual collaborative implementation strategy to reduce VAP. Although ICUs in the virtual collaborative group implemented ventilator bundles more often, there was no difference in VAP rates between the groups after 18 months.18 The gap between guidelines and effective
implementation strategies is widely recognised.13 16 19
Nonetheless, in our case, the imperative for improvement was strong enough to proceed with guideline-concordant strategies.
measuremenT
Our overall goal was to reduce VAE incidence (ie, number of VAEs divided by ventilator days); however, due to the relative rarity of VAEs, using VAE incidence as our primary measure of improvement was not ideal. We instead used MV duration as a proxy. Based on studies that used MV duration as an outcome, average MV dura-tion ranges from 1.5 to 7.9 days.20–24 Our goal MV
dura-tion of less than 3 days was based on the VAE definidura-tion since no optimal threshold exists. Patients who meet this goal effectively can only improve the VAE incidence by contributing solely to the denominator; by definition, VAEs occur only in patients intubated for at least four calendar days. However, our objective of reducing MV duration was primarily motivated by the intent to reduce HAIs by minimising exposure to devices (ie, central lines, indwelling urinary catheters and ventilators).
We defined our primary outcome, MV duration, as the number of calendar days from intubation to extubation. If a patient was intubated on the evening of 1 January and extubated on the morning of 2 January, we counted this as two calendar days. Reintubations were treated as sepa-rate episodes; if a patient was intubated from 1 January to 3 January and had to be reintubated from 11 January to 13 January, we counted this as two occurrences of three calendar days of MV. We aggregated data as monthly aver-ages on a run chart and as quarterly averaver-ages on an XbarS chart; the run chart allowed us to more quickly iden-tify special cause variation signals and the XbarS chart allowed us to smooth month-to-month variation. Theo-retically, it is possible to have the same average MV dura-tion in two different months, with 1 month having greater overall VAE risk (eg, with 100 patients each intubated for 4 days) and the other month having lower overall VAE risk (eg, with a single patient intubated for 4 days), implying that MV duration is not a direct proxy for VAE risk. We accepted this shortcoming since our interven-tions mitigated patient-level rather than unit-level VAE risk. Number of calendar days between VAEs was plotted on a t chart as a secondary outcome. Balancing measures included the monthly number of MV patients (to capture reintubations), ICU case severity index and ventilator utilisation ratio, which we plotted on XmR charts and a p chart.
For our process measures, we chose proportions of SAT-eligible and SBT-eligible patients with the
on September 12, 2020 by guest. Protected by copyright.
corresponding order for SAT or SBT present. To be eligible for an SAT order, a patient needed a sedative infu-sion (eg, midazolam, lorazepam, propofol and dexme-detomidine) ordered for at least 24 hours; to be eligible for an SBT order, a patient needed to be on MV for at least two calendar days. Orders were considered present if entered during the MV episode. We aggregated process measure data monthly on p charts.
We obtained data from monthly retrospective chart reviews of MV patients and grouped measurements into three periods: baseline (May 2015 to October 2016), period 1 (following our first intervention, November 2016 to March 2017) and period 2 (following our second intervention, April 2017 to December 2017). We used QI Macros 2017 to build and analyse our charts; for all charts, we ‘froze’ the central line (ie, median for run chart and mean for statistical process control charts) from the base-line period to more accurately detect special cause varia-tion signals according to the Westgard rules and treated periods 1 and 2 together as the intervention period.25 26
We supplemented our chart analysis with classical para-metric statistics using STATA/IC V.14.2. We excluded patients recovering postoperatively from anaesthesia or with long-term ventilator dependence (ie, did not have ARF) as they are not generally sedated or placed on SBTs for ventilator weaning.
design
The GLA Institutional Review Board determined this project to be quality improvement, non-research activity.
Our improvement team convened in October 2016 and included the medical and surgical ICU directors, chief medical/surgical nurse, ICU nurse manager, RT director, inpatient pharmacy manager, infection control staff, workgroup chairs and quality improvement fellow (author MMC). We first reviewed charts for all nine patients who had VAEs in 2016 to identify systemic issues. Documentation of worsening oxygenation in progress notes was sparse and, when present, insufficient to infer root causes. Most VAEs occurred in medical ICU patients, and all but one patient was intubated for more than 7 days before the VAE occurred. Because we did not discover a root cause from this investigation, we proceeded to determine our compliance with consensus guidelines described previously.
Nearly a decade before beginning this project, the medical ICU director and Critical Care Committee designed a ventilator bundle order set in our electronic medical record (EMR) that grouped IDSA/SHEA-recom-mended VAP prevention strategies (ie, SAT, SBT, head of bed elevation, chlorhexidine oral care, and stress ulcer and thromboembolism prophylaxis) with medication orders commonly used for intubated patients (ie, seda-tion and analgesia drips, as-needed delirium medicaseda-tions and enteral nutrition orders). A spot check of MV patients in October 2016 showed order set underutilisation. Insufficient education and lack of emphasis on bundle
compliance explained this finding; residents rotate through the ICU for short periods with brief orientations. Furthermore, we found the order set cumbersome to use; ventilator settings were featured at the end of the order set with the intention to oblige residents to order nine other ventilator care elements, including ones with less evidence or duplicates from other order sets. Technical limitations in our EMR when the order set was originally coded also disrupted the order set’s flow.
Our first intervention (period 1) was to address the residents’ knowledge gap. The medical and surgical ICU directors requested their attending physicians, when on service, to train residents on using the order set to improve bundle compliance. We expected this interven-tion to change the residents’ behaviours and improve bundle use through education and also by expecta-tion-setting and influence of authority. To address the order set’s usability, we simultaneously began revising its content and layout for our second intervention (period 2); we sought to create a convenient and streamlined ‘one-stop shop’ that would suit the needs of a heteroge-neous group of residents.
sTraTegy
We implemented the educational directive of period 1 in November 2016. Because SATs and SBTs were intermit-tently performed during daily rounds, attending physi-cians had been unaware that ventilator bundles were not being ordered. Within the first week, a follow-up spot check showed more MV patients with bundle orders.
For the period 2 intervention, we created several work-groups to individually address various components of the order set; the workgroups later met together to address all operational elements in the order set, clarifying the responsibilities of each provider (eg, physician, nurse, RT) to ensure seamless transitions. A primary goal was reorganising the order set visually with prominent display of ‘mandatory’ guideline-based practices (ie, SATs and SBTs). Once the clinical informatics team began building revisions, the order set underwent many iterations with feedback from the quality improvement fellow, the medical ICU director and a clinical informatics specialist who was formerly an ICU nurse; all tested the order set on fictitious patients in the EMR before settling on a final product (online supplemental figures 1A-1E).
While updating SAT and SBT orders in the order set, we learnt there was no standardised approach to oper-ationalise SATs and SBTs. Orders were delivered incon-sistently; some were verbal, and others were electronic. In February 2017, bedside audits showed that for 7 of 15 patients, SATs and SBTs were performed without corre-sponding electronic orders. Our medical ICU director and RTs had approved an SBT protocol in 2013; some RTs were unaware of its existence, while others felt disempowered to use it because of frequently conflicting verbal physician orders, leading them to wait for explicit approval from attending physicians to initiate the SBT
on September 12, 2020 by guest. Protected by copyright.
protocol during morning rounds. In contrast, nurses had never established an SAT protocol. These inconsisten-cies in order entry and actualisation along with differing physician practices introduced variation into the MV care process that could cause higher MV duration and thereby VAE incidence; standardising that process would be crit-ical to achieving success with the ventilator bundle. Thus, the ICU nurse manager and two bedside nurses worked together to establish a step-by-step process that would fit into their workflow and facilitate SBTs, which require sedation to be held. They adapted a protocol from another hospital and condensed the pathway to two steps: check for SAT exclusion criteria (ie, seizures, drug with-drawal, high risk for ventilator-related injury, fraction of inspired oxygen greater than 0.70, vasopressor dose equal to or greater than 10 µg/kg/min, and concurrent para-lytic infusion) and hold the sedative at the appropriate time (either 6:00 or 8:00) based on its duration of effect. We simplified the SBT protocol to include only param-eters RTs routinely assessed. Contraindications for SBTs included concurrent sedative, analgesic or paralytic infu-sions; haemodynamic instability; oxygen saturation less than 92%; positive end-expiratory pressure greater than 5 mm Hg; fraction of inspired oxygen greater than 0.40; pH less than 7.3; and minute ventilation greater than 15 L/ min. We added the new SAT and updated SBT protocols to the order set.
In mapping SAT and SBT flow, we felt the configuration of RT staffing at the time would impede successful deploy-ment of the ventilator bundle and therefore facilitated around-the-clock RT staffing in the ICU. Because RTs had not been physically present in the ICU at all hours, physicians were adjusting ventilator settings, making streamlining of ventilator weaning more challenging. To transition to the new staffing model of around-the-clock in-unit coverage, GLA’s chief of staff negotiated the addi-tion of contractual RT staff, although several full-time RTs ultimately volunteered for ICU shifts.
Thus, to our planned order set revision, we added corre-sponding nurse-driven and RT-driven SAT and SBT proto-cols and stationing RTs in the ICU for 24-hour coverage for our period 2 intervention. All components were ready for implementation in April 2017. Our primary imple-mentation strategy for these changes was education, with all ICU staff receiving education on the revised order set and protocols from their respective leaders (ie, the medical and surgical ICU directors, ICU nurse educator and RT director) on our improvement team. We designed and distributed badge and pocket cards to illustrate and remind providers of the process changes (online supple-mentary figures 2 and 3). The quality improvement fellow attended a resident orientation to demonstrate use of the order set; she also went to a nurse huddle to review the new SAT protocol.
resulTs
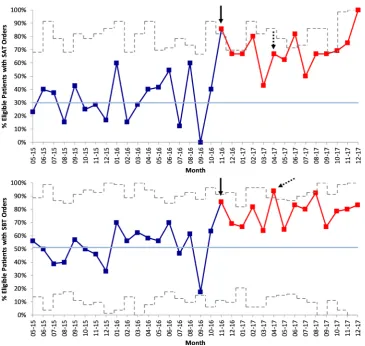
There was a shift of 14 data points above the central line in both p charts of SAT and SBT order entry that began in
November 2016, corresponding with period 1 (figure 1). At baseline, SAT and SBT order entry (ie, percentage of eligible patients with orders) averaged 29.9% and 51.2%, respectively; after the shift in November 2016, they aver-aged 67.9% and 77.7%, respectively. Improvement was sustained for both measures at the end of December 2017.
There were no special cause variation signals on the run chart of monthly MV duration, although the run chart over its entire period (May 2015 to December 2017) exhibits a general downward trend (figure 2). During the baseline period, the median monthly MV duration was 6.5 days (range 4.1–15.1 days); during periods 1 and 2, it was 4.8 days (range 3.7–8.9 days) at the end of December 2017. Similarly, on the XbarS chart of quarterly MV duration, which spans October 2013 to December 2017, there are no special cause signals corresponding with our interventions, but there is an 8-point downward shift that begins in the first quarter of 2016 (ie, October 2015 to December 2015) a year before our intervention began (online supplementary figure 4). There are several special cause signals suggesting decreased variation on the S portion of the XbarS chart corresponding with period 1.
From October 2016 to December 2017, there were six VAEs with no systemic issues found after chart review. There was a statistically non-significant decrease in VAE rate from 6.8 events per 1000 ventilator days (5.2 events per 100 ventilated patients) at baseline to 1.3 events per 1000 ventilator days (0.7 events per 100 ventilated patients) during period 2. There were no special cause signals on the t chart of calendar days between VAEs (online supplementary figure 5). During the baseline period, the time between VAEs averaged 31.4 days (range 0 to 109 days); during periods 1 and 2, it averaged 73.4 days (range 8 to 198 days) at the end of December 2017.
On the XmR chart of number of MV patients per month, there is one data point (June 2017) that is above the upper control limit; however, there are no other special cause signals (see online supplementary figure 6). The number of MV patients per month averaged 16.2 patients (range 6–27 patients) between May 2015 and December 2017. There were no special cause signals on the XmR chart of ICU case severity index (online supple-mentary figure 7). There were special cause signals (data points below or above lower or upper control limits) on the p chart of ventilator utilisation ratio, but none were sustained or clearly attributable to our intervention (online supplementary figure 8).
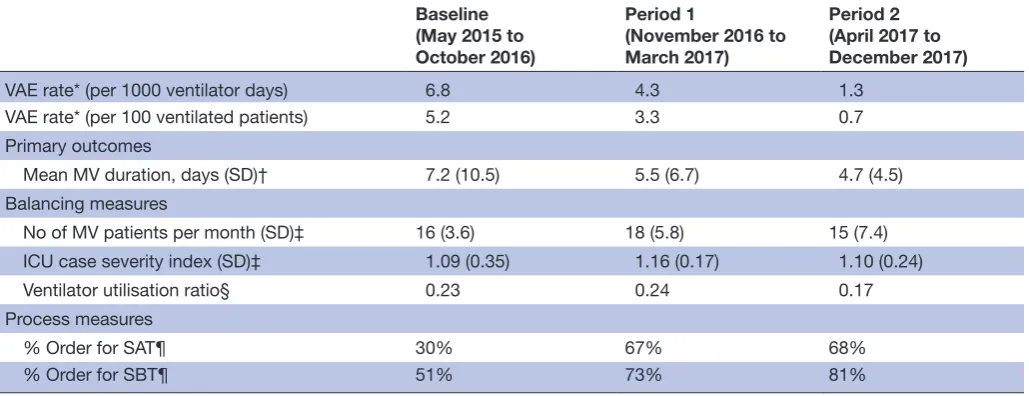
Results based on classical parametric statistics are presented in table 1. Findings are overall similar to chart analysis, showing statistically significant increases in SAT and SBT order entry in periods 1 and 2 and a decrease in ventilator utilisation ratio in period 2, with the additional finding of a statistically significant difference in MV dura-tion between baseline and period 2 (p=0.049).
Feedback on usability of the revised order set and proto-cols was mixed. Most residents had such little firsthand experience with the previous order set that it was nearly impossible to compare with the new order set, but none
on September 12, 2020 by guest. Protected by copyright.
Figure 1 P chart of percentage of eligible patients with spontaneous awakening trial (SAT) and spontaneous breathing trial (SBT) orders. Data plotted in dark blue with shift following intervention (11–16) highlighted in red. Central line (mean) in light blue. Upper and lower control limits in grey (dashed). Start of period 1 at solid arrow. Start of period 2 at dashed arrow. Interrupted time-series analysis comparison of baseline with periods 1 and 2 significant at p=0.002 for SAT order entry and p=0.013 for SBT order entry (for coefficient indicating immediate effect of intervention).
Figure 2 Run chart of mechanical ventilation (MV) duration aggregated monthly. Data plotted in dark blue. Central line (median) in light blue. Goal line in green. Start of period 1 at solid arrow. Start of period 2 at dashed arrow. Interrupted time-series analysis comparison of baseline with periods 1 and 2 non-significant (p=0.590 for coefficient indicating immediate effect of intervention; p=0.588 for coefficient indicating trend following intervention).
who used the new order set reported issues. Several nurses questioned why fentanyl was not included as a sedative in the SAT protocol and voiced safety concerns, particularly
regarding management of patients who became agitated when sedation was held.
on September 12, 2020 by guest. Protected by copyright.
Table 1 Summary of findings
Baseline (May 2015 to October 2016)
Period 1
(November 2016 to March 2017)
Period 2 (April 2017 to December 2017)
VAE rate* (per 1000 ventilator days) 6.8 4.3 1.3
VAE rate* (per 100 ventilated patients) 5.2 3.3 0.7 Primary outcomes
Mean MV duration, days (SD)† 7.2 (10.5) 5.5 (6.7) 4.7 (4.5) Balancing measures
No of MV patients per month (SD)‡ 16 (3.6) 18 (5.8) 15 (7.4) ICU case severity index (SD)‡ 1.09 (0.35) 1.16 (0.17) 1.10 (0.24)
Ventilator utilisation ratio§ 0.23 0.24 0.17
Process measures
% Order for SAT¶ 30% 67% 68%
% Order for SBT¶ 51% 73% 81%
*Negative binomial regression comparison of period 1 with baseline and period 2 with baseline non-significant (p=0.468 and p=0.105, respectively, for VAE rate per 1000 ventilator days; p=0.506 and 0.059, respectively, for VAE rate per 100 ventilated patients).
†ANOVA F-test of baseline, period 1 and period 2 significant (p=0.017), post-test pairwise comparison of period 2 with baseline significant (p=0.049).
‡ANOVA F-test of baseline, period 1 and period 2 non-significant (p=0.647 for MV patients; p=0.894 for ICU case severity index).
§Pearson χ2 test of baseline, period 1 and period 2 significant (p<0.001), post-test pairwise comparison of period 2 with baseline significant (p<0.001) and comparison of period 2 with period 1 significant (p<0.001).
¶Pearson χ2 test of baseline, period 1 and period 2 significant (p<0.001), post-test pairwise comparison of period 1 with baseline significant (p<0.001) and comparison of period 2 with baseline significant (p<0.001) (for SAT and SBT orders).
ICU, intensive care unit; MV, mechanical ventilation; SAT, spontaneous awakening trial; SBT, spontaneous breathing trial.
lessons and limiTaTions
In this ventilator bundle implementation project, we found sustained improvements in processes and favour-able trends in outcomes. Increases in SAT and SBT order entry were associated with attending physicians reminding residents to order the ventilator bundle, implying the simple but substantial effect attending physicians have on resident behaviour; we believe streamlining the order set in period 2 helped sustain the initial improvement in period 1. Although we did not achieve our goal of decreasing average MV duration to less than 3 days, chart analysis exhibits a clear downward trend and a statistically significant decrease in MV duration using classical statis-tics. Because of the infrequency of VAEs and downward trend in MV duration starting before our intervention, we cannot definitively attribute decreases in VAE incidence and MV duration to our intervention. However, these changes, coupled with the significant decrease in varia-tion of MV duravaria-tion associated with our intervenvaria-tion, suggest that standardising ventilator weaning conferred some reduction in MV duration.
One reason we considered for not reaching our goal was varied actualisation of SAT and SBT orders. Prelim-inary bedside audits of processes downstream to order entry showed RTs consistently performed SBTs when indicated, but there were missed opportunities for SATs. There were far more opportunities for SBTs since all MV patients necessarily need them before extuba-tion. The RT staffing change in March 2017 enabled the SBT protocol’s success; the heightened presence
of RTs gave them more visibility to other ICU staff and confidence with the SBT protocol. The RT director also noted improvements in RT documentation and empowerment.
Conversely, transitioning from a physician-directed SAT strategy to a nurse-driven SAT protocol was chal-lenging for cultural reasons and also because only half of MV patients had sedative infusion orders and there-fore needed SATs. This affected the absolute number of patients eligible for SATs. Based on the size of our ICU (22 beds) and our average ventilator utilisation ratio (0.27), on a given day, we would expect to see six mechanically ventilated patients; furthermore, based on our sedative infusion use (50%), we would expect three of these six patients to be on continuous seda-tion. Of these three patients, any number of them may have contraindications to the SAT protocol (eg, high oxygenation or vasopressor requirements) resulting in few if any patients eligible for an SAT, in absolute terms. In response to the audit findings showing missed SATs, our ICU nurse educator repeated in-service sessions for nurses to review and answer questions about the protocol. However, many nurses nonetheless voiced safety concerns about the protocol, which ultimately led to its not being accepted. These concerns may be difficult to dispel due to the infrequency of patients needing SATs.
Safety concerns about SAT protocols are not isolated to GLA. According to a national survey of ICU providers, 37% of respondents ‘rarely’ or never use daily SATs, and
on September 12, 2020 by guest. Protected by copyright.
22% of respondents cite lack of nursing acceptance as a barrier.27 Common reasons for providers to hesitate in
using SATs include fears of causing agitation or self-ex-tubation. However, randomised trials have only shown slightly higher rates of agitation and self-extubation in MV patients undergoing SATs, with similar reintubation rates.23 28 Patients who received daily SATs had more
ventilator-free days and shorter time to discharge from the ICU and hospital.28 Clearly, safety concerns endure
despite evidence of the net benefit of SATs.
Other work has shown the benefit of empowering RTs and nurses to initiate SBTs and SATs, respectively. One randomised clinical trial assessing the impact of RT-led SBTs reduced the average MV duration from 6 to 4.5 days, similar to our findings21; our interventions,
particularly the RT staffing change and SBT protocol in period 2, likely helped contribute to this overall trend towards improvement. Another randomised clinical trial assessing the impact of nurse-led SATs reduced average MV duration from 4.9 to 2.3 days,23 but it is unclear
whether additional effort is warranted to promote SATs in GLA’s ICU. Admitting diagnosis and degree of phys-iological derangement have also been associated with MV duration,20 so with GLA’s high case severity index,
our ability to further reduce MV duration may be small.
conclusions
The ability to reduce VAEs depends on the number of ventilated patients and their MV duration. If few patients are ventilated, and among those few, only some have risks that ventilator bundles address (eg, use of sedative infusions), there may be limited oppor-tunity to decrease VAEs, and the ability to institution-alise recommended practices (eg, SATs) may be more challenging. Ultimately, our improvement team imple-mented process changes to increase usage of a venti-lator bundle, which contributed to improvement in MV duration. Because we now face diminishing marginal returns with standard evidence-based practices, our next steps are to instil broader cultural changes among the ICU staff to increase accountability and teamwork, which will improve processes that affect VAEs and also other elements of care that affect outcomes for critically ill patients.
Acknowledgements We would like to thank our improvement team (Dr Guy Soo Hoo, Dr Sumit Singh, Dr Thomas Yoshikawa, Angelo Ibanez, Miguel Toledo, Rex Monsale, Joyce Convis and Dr Frank Bertone), clinical informatics specialist (Dr Jeff Balsam), data management specialist (Manyee Gee) and VA Quality Scholars faculty (Dr Brant Oliver), and the numerous bedside ICU providers for their contributions to this project.
Contributors MMC and SSdP were members of the improvement team and planned the improvement project and implemented the interventions. MMC collected data under the supervision of SSdP. MMC and DAG analysed and interpreted data. MMC drafted the manuscript and DAG, ETC and SSdP made substantial revisions for clarity and content. All authors approved the final version of the manuscript for submission.
Funding This quality improvement project was funded by VA Quality Scholars Program support from the VA Office of Academic Affiliations.
Disclaimer The views expressed in this article are those of the authors and do not necessarily reflect the position or policy of the VA (Department of Veterans Affairs) or the United States government.
Competing interests None declared. Patient consent for publication Not required.
Provenance and peer review Not commissioned; externally peer reviewed. Open access This is an open access article distributed in accordance with the Creative Commons Attribution Non Commercial (CC BY-NC 4.0) license, which permits others to distribute, remix, adapt, build upon this work non-commercially, and license their derivative works on different terms, provided the original work is properly cited, appropriate credit is given, any changes made indicated, and the use is non-commercial. See: http:// creativecommons. org/ licenses/ by- nc/ 4. 0/.
references
1. Centers for Disease Control and Prevention. Healthcare associated infections, 2017. Available: https://www. cdc. gov/ winnablebattles/ heal thca reas soci ated infe ctions/ index. html [Accessed cited 11 Oct 2017].
2. Magill SS, Klompas M, Balk R, et al. Developing a new, national approach to surveillance for ventilator-associated events. Crit Care Med 2013;41:2467–75.
3. Magill SS, Rhodes B, Klompas M. Improving ventilator-associated event surveillance in the national healthcare safety network and addressing knowledge gaps: Update and review. Curr Opin Infect Dis 2014;27:394–400.
4. Muscedere J, Sinuff T, Heyland DK, et al. The clinical impact and preventability of ventilator-associated conditions in critically ill patients who are mechanically ventilated. Chest 2013;144:1453–60. 5. Klompas M, Branson R, Eichenwald EC, et al. Strategies to prevent
ventilator-associated pneumonia in acute care hospitals: 2014 update. Infect Control Hosp Epidemiol 2014;35:S133–S154. 6. Centers for Disease Control and Prevention. National Healthcare
Safety Network Surveillance for Ventilator-associated Events, 2018. Available: https://www. cdc. gov/ nhsn/ acute- care- hospital/ vae/ index. html [Accessed cited 2 Apr 2018].
7. U.S. Department of Veterans Affairs. Strategic Analytics for
Improvement and Learning (SAIL)—Quality of Care, 20017. Available: https://www. va. gov/ QUALITYOFCARE/ measure- up/ Strategic_ Analytics_ for_ Improvement_ and_ Learning_ SAIL. asp
8. Magill SS, Li Q, Gross C, et al. Incidence and characteristics of ventilator-associated events reported to the National Healthcare Safety Network in 2014. Crit Care Med 2016;44:2154–62. 9. Klompas M. Potential strategies to prevent ventilator-associated
events. Am J Respir Crit Care Med 2015;192:1420–30. 10. Klompas M, Li L, Kleinman K, et al. Associations between
ventilator bundle components and outcomes. JAMA Intern Med 2016;176:1277–83.
11. Rello J, Afonso E, Lisboa T, et al. A care bundle approach for prevention of ventilator-associated pneumonia. Clin Microbiol Infect 2013;19:363–9.
12. O'Horo JC, Lan H, Thongprayoon C, et al. "Bundle" practices and ventilator-associated events: not enough. Infect Control Hosp Epidemiol 2016;37:1453–7.
13. Mendez MP, Lazar MH, Digiovine B, et al. Dedicated multidisciplinary ventilator bundle team and compliance with sedation vacation. Am J Crit Care 2013;22:54–60.
14. Parisi M, Gerovasili V, Dimopoulos S, et al. Use of ventilator bundle and staff education to decrease ventilator-associated pneumonia in intensive care patients. Crit Care Nurse 2016;36:e1–7.
15. Resar R, Pronovost P, Haraden C, et al. Using a bundle approach to improve ventilator care processes and reduce ventilator-associated pneumonia. Jt Comm J Qual Patient Saf 2005;31:243–8.
16. Daniel M, Booth M, Ellis K, et al. Details behind the dots: how different intensive care units used common and contrasting methods to prevent ventilator associated pneumonia. BMJ Qual Improv Rep 2015;4.
17. Gastmeier P, Geffers C. Prevention of ventilator-associated pneumonia: analysis of studies published since 2004. J Hosp Infect 2007;67:1–8.
18. Speroff T, Ely EW, Greevy R, et al. Quality improvement projects targeting health care-associated infections: comparing virtual collaborative and toolkit approaches. J Hosp Med 2011;6:271–8. 19. Sundaram R, Rooney KD. Reliable critical care: making it easy to do
the right thing. Br J Anaesth 2015;115:161–3.
on September 12, 2020 by guest. Protected by copyright.
20. Seneff MG, Zimmerman JE, Knaus WA, et al. Predicting the duration of mechanical ventilation. The importance of disease and patient characteristics. Chest 1996;110:469–79.
21. Ely EW, Baker AM, Dunagan DP, et al. Effect on the duration of mechanical ventilation of identifying patients capable of breathing spontaneously. N Engl J Med 1996;335:1864–9.
22. Esteban A, Anzueto A, Frutos F, et al. Characteristics and outcomes in adult patients receiving mechanical ventilation: a 28-day international study. JAMA 2002;287:345–55.
23. Brook AD, Ahrens TS, Schaiff R, et al. Effect of a nursing-implemented sedation protocol on the duration of mechanical ventilation. Crit Care Med 1999;27:2609–15.
24. Kollef MH, Shapiro SD, Silver P, et al. A randomized, controlled trial of protocol-directed versus physician-directed weaning from mechanical ventilation. Crit Care Med 1997;25:567–74.
25. Perla RJ, Provost LP, Murray SK. The run chart: a simple analytical tool for learning from variation in healthcare processes. BMJ Qual Saf 2011;20:46–51.
26. Provost LP. The health care data guide: learning from data for improvement. 1st edn. San Francisco, CA: Jossey-Bass, 2011: 480.
27. Tanios MA, de Wit M, Epstein SK, et al. Perceived barriers to the use of sedation protocols and daily sedation interruption: a multidisciplinary survey. J Crit Care 2009;24:66–73.
28. Girard TD, Kress JP, Fuchs BD, et al. Efficacy and safety of a paired sedation and ventilator weaning protocol for mechanically ventilated patients in intensive care (awakening and breathing controlled trial): a randomised controlled trial. The Lancet 2008;371:126–34.
on September 12, 2020 by guest. Protected by copyright.