Prediction models for exacerbations in
patients with COPD
Beniamino Guerra, Violeta Gaveikaite, Camilla Bianchi and Milo A. Puhan
Affiliation: Epidemiology, Biostatistics and Prevention Institute, University of Zurich, Zurich, Switzerland. Correspondence: Beniamino Guerra, Epidemiology, Biostatistics and Prevention Institute, Hirschengraben 84, 8001 Zurich, Switzerland. E-mail: beniamino.guerra@uzh.ch
@ERSpublications
None of the 27 prediction models for COPD exacerbations appears to be ready to support personalised COPD treatmenthttp://ow.ly/Lq2b302IWRx
Cite this article as: Guerra B, Gaveikaite V, Bianchi C, et al. Prediction models for exacerbations in patients with COPD.Eur Respir Rev2017; 26: 160061 [https://doi.org/10.1183/16000617.0061-2016].
ABSTRACT Personalised medicine aims to tailor medical decisions to the individual patient. A possible approach is to stratify patients according to the risk of adverse outcomes such as exacerbations in chronic obstructive pulmonary disease (COPD). Risk-stratified approaches are particularly attractive for drugs like inhaled corticosteroids or phosphodiesterase-4 inhibitors that reduce exacerbations but are associated with harms. However, it is currently not clear which models are best to predict exacerbations in patients with COPD. Therefore, our aim was to identify and critically appraise studies on models that predict exacerbations in COPD patients. Out of 1382 studies, 25 studies with 27 prediction models were included. The prediction models showed great heterogeneity in terms of number and type of predictors, time horizon, statistical methods and measures of prediction model performance. Only two out of 25 studies validated the developed model, and only one out of 27 models provided estimates of individual exacerbation risk, only three out of 27 prediction models used high-quality statistical approaches for model development and evaluation. Overall, none of the existing models fulfilled the requirements for risk-stratified treatment to personalise COPD care. A more harmonised approach to develop and validate high-quality prediction models is needed to move personalised COPD medicine forward.
Introduction
Personalised medicine aims to tailor medical decisions to the individual patient [1, 2]. The interest in personalised respiratory medicine has risen recently but it has not been introduced much into practice yet [3, 4]. For patients with chronic obstructive pulmonary disease (COPD) [5], a possible approach for personalising medical treatments is to stratify patients according to the risk of exacerbations, in order to prescribe treatments such as inhaled corticosteroids or phosphodiesterase-4 inhibitors only if their benefits in terms of reduced risk of exacerbations [6] are expected to outweigh the harms [7–9]. For example, a recent benefit–harm assessment of the phosphodiesterase-4 inhibitor roflumilast suggested that the risk for severe exacerbations requiring hospital admissions needs to be at least 20% over 1 year so that the expected benefits (in terms of reducing severe exacerbations) overcome the gastrointestinal, psychiatric and neurological side effects of roflumilast [7].
Copyright ©ERS 2017. ERR articles are open access and distributed under the terms of the Creative Commons Attribution Non-Commercial Licence 4.0.
This article has supplementary material available from err.ersjournals.com Received: May 23 2016 | Accepted after revision: July 25 2016
Support statement: This study was supported by a grant from the University of Zurich (Zurich, Switzerland). Funding information for this article has been deposited with Open Funder Registry.
Conflict of interest: None declared. Provenance: Submitted article, peer reviewed.
https://doi.org/10.1183/16000617.0061-2016 Eur Respir Rev 2017; 26: 160061
Exacerbations are an ideal target for risk-stratified treatment since it is one of the most important outcomes for COPD patients and avoiding them is likely to lead to a higher health-related quality of life, longer life and less healthcare cost. However, a prerequisite for risk-stratified treatment is that the risk of exacerbations can be accurately predicted by a prediction model [10–12] that has been thoroughly developed and validated [13–16]. A number of models predicting exacerbations in COPD patients have been published reporting on combinations of information from patient history, clinical characteristics and test results including biomarkers to predict exacerbations. It is still not clear yet, though, which prediction model predicts exacerbations most accurately and is applicable in daily practice. For this reason, along with the lack of other systematic reviews, the aim of this systematic review was to identify and critically appraise studies presenting models predicting exacerbations in COPD patients that may support risk-stratified and personalised treatment.
Materials and methods
The authors followed the Center for Reviews and Dissemination guidance for the methodology [17] and the Preferred Reporting Items for Systematic Reviews and Meta-Analyses (PRISMA) statement for the reporting [18, 19].
Protocol
We wrote a detailed study protocol in advance (supplementary material). We carefully followed the protocol and recorded any deviations from it.
Search methods
We identified eligible papers through a search of the databases Medline (from 1949), Embase (from 1974) and Scopus (from 1996). The search was performed by an information specialist of the University of Zurich (Zurich, Switzerland). Additional studies were identified through the Pubmed-related articles function and reference list of included studies, author contacts, narrative reviews or the “grey” literature (reports, dissertation, conference abstracts or papers).
Participants
To be eligible for inclusion, patients were required to have a COPD diagnosis according to Global Initiative for Chronic Obstructive Lung Disease (GOLD) criteria (i.e.the ratio between forced expiratory volume in 1 s (FEV1) and forced volume capacity (FVC) had to be <0.7 after bronchodilation).
Outcome definition
The outcome of interest was exacerbation. Exacerbations could be event based (e.g.course of antibiotics and/or oral corticosteroids or admission to hospital) or symptom based ( patient-reported change in symptoms with or without use of diary charts).
General selection criteria
Publication status, year of publication and language were not subject to exclusion criteria.
Study design
We included studies with a longitudinal design ( prospective or retrospective cohorts) or control arms of randomised control trials (that can be regarded as cohort studies). Length of follow-up was not subject to exclusion criteria.
Selection criteria for prediction models
For inclusion, the analysis section of the paper had to refer to a prediction model [10] or multivariable association [20, 21] of a set of predictors with the outcome exacerbation. By also including multivariable models without explicit reference to prediction models, we broadened the eligibility of models substantially in order to learn as much from the literature as possible. But in order to foresee the use of such multivariable models, which often focused on a single predictor of interest (e.g. a biomarker), while adjusting for other predictors (e.g.previous exacerbations or FEV1% predicted), a requirement for inclusion was that the model also included four commonly used and easily available predictors (i.e. previous exacerbations, smoking, age, and FEV1 % pred) beside the predictor of interest. Indeed, analyses not accounting for these four common predictors may over-estimate the predictive value of a particular single predictor (such as a biomarker) and there is general consensus that the use of more sophisticated predictors is justified only if they provide additional value when added to commonly available predictors. A further requirement for the inclusion in the systematic review was the presence of at least one performance of the prediction model (e.g.area under the curve (AUC) for discrimination). If information needed to decide on
https://doi.org/10.1183/16000617.0061-2016 2
inclusion was not available from the papers we contacted the authors up to two times to obtain them. The studies could also be included if exacerbation was not the only outcome of the study.
Procedure
Two review authors (B. Guerra and C. Bianchi) independently assessed titles and abstracts of all references retrieved. Two review authors (B. Guerra and V. Gaveikaite) independently reviewed full-text versions of potentially relevant studies, and selected the studies. Disagreement was resolved by discussion between the two review authors. If consensus was not reached, a third review author was consulted (M.A. Puhan).
Data extraction and management
Two review authors (B. Guerra and V. Gaveikaite) independently extracted the following data from included studies: demographic characteristics of the study population, disease severity, clinical settings, definition of the outcome, duration of the follow-up, details of the statistical method as well as of the predictors of the final model. All missing information was searched for in the references indicated in the papers (if available), or asked for by email to the authors. Some missing information was retrieved from pharmaceutical companies involved in the studies (if needed, by formal requests).
Quality assessment concerned six categories of potential bias (participant selection as shown in the study flow, measurement of predictors, measurement of outcome (i.e. exacerbation), statistical analysis for model development, performance measures and validation, based on guidance from Cochrane [22], an early version of the prediction study risk of bias assessment tool (PROBAST) guidelines (www.systematic-reviews.com/probast) and the needs of this particular systematic review. The criteria for rating studies at low, high or unclear risk of bias as well as a description for each bias category of each included study are shown in the supplementary material.
Some studies reported on small variations of the same prediction model. Since these models performed in general very similarly, we considered one prediction model per study for the main analysis (supplementary material). We only considered more than one prediction model per study if they were substantially different, as in ALMAGRO et al. [23], where the predictive performance of the CODEX (comorbidity, obstruction, dyspnoea and severe exacerbations), ADO (age, dyspnoea and airflow obstruction) and BODEX (body mass index, airflow obstruction, dyspnoea and severe exacerbations) indices were assessed (thus, we will speak in this systematic review of 25 studies and 27 prediction models).
In order to evaluate the readiness of the prediction models for practice we defineda priorithree criteria for the clinical applicability of the models. 1) Availability predictors. We deemed the set predictors in each prediction model to be easily (E) available if most of them were based on questions or information from medical charts, to be moderately (M) available if some (at least two) were based on tests routinely done in non-specialised and specialised settings and to be difficult (D) to be available if at least one of the predictor was based on a test usually performed in specialised settings only (details concerning the assessment are explained later in the text and in the supplementary material). 2) External validation. In order to be confidently used in practice, prediction models require validations in populations other than the populations in which it was developed [13, 14, 24]. We had high confidence in the performance if the model had been validated (with a small decrease of performance between derivation and validation cohort) in an external cohort of COPD patients and, accordingly, low confidence if an external validation was lacking. 3) Practical applicability. To be useful for risk-stratified treatment in practice we deemed models to be useful if they provided a simple point system like the BODE (body mass index, airflow obstruction, dyspnoea and exercise capacity) or ADO indices (e.g. [25, 26]) with corresponding risks of exacerbations (e.g. 4 points=25% probability of exacerbation for a specified time horizon), an online calculator or other means to easily derive the risk of exacerbations for an individual patient. We deemed prediction models not ready for risk-stratified treatment yet if only the statistical methods (e.g.regression coefficients) were reported.
Statistical analysis
Given the heterogeneity of the studies we deemed meta-analyses not a sensible approach and reported the findings using descriptive summary statistics.
Results
Selection of studies
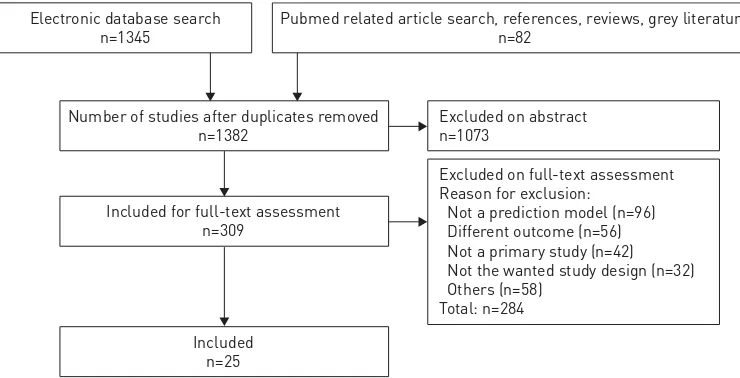
Figure 1 shows the study selection process and the main reasons for exclusion at the different stages. From the database searches, we included 20 from a total of 1345 studies. From additional searches we included another five studies and thus a total of 25 papers [23, 27–50] reporting on 27 prediction models (supplementary material for details concerning each stage of the selection process).
https://doi.org/10.1183/16000617.0061-2016 3
Study characteristics
The included studies were conducted in countries around the world (table 1). They are ordered according to categories of exacerbation incidence. Acknowledging the lack of standard in literature for the individual cut-off value (or more cut-off values) for the frequent exacerbator phenotype, and given the commonly used cut-off of 2 exacerbations per person-year [36, 53] we categorised each cohort as low (<1 exacerbation per person-year), moderate (1–2 exacerbations per person-year) or high (⩾2 exacerbations per person-year) incidence of exacerbations. Three cohorts with high incidence of exacerbations, four cohorts with moderate incidence of exacerbations and 19 cohorts with low incidence of exacerbations were included (for one of the 27 cohorts, the related data were not retrieved). Sample sizes ranged from 109 to 8020. The definition and measurement of exacerbations was symptom-based in seven (out of 27 cohorts: 25 derivation cohorts plus two validation cohorts), event-based in 17 and unclear definition in three cases. Exacerbations were not adjudicated by a committee in any study. The prediction models were mainly based on prospective cohort studies (control arm of a randomised controlled trial for one model [30]), while two prediction models were based on retrospective cohort studies [28, 46]). Follow-up periods ranged from 14 days to up to 9 years (the most common follow-up was up to 1 year). 21 out of the 25 included studies had the explicit aim to find a combination of predictors strongly associated with exacerbations, while four studies [35, 37, 49, 50] focused on a particular predictor but adjusted for age, FEV1 % predicted, smoking and previous exacerbation (making them eligible for the inclusion in this review).
Predictors included in the prediction models
More than 50 different predictors were used across the included prediction models (supplementary material). Airways obstruction (FEV1 % predicted or FEV1 or GOLD stage) was the most common
predictor (12 times out of 27 models). The next most common predictors were previous exacerbations (nine times), age (nine times), smoking (eight times) and health-related quality of life (eight times). More than half of predictors were included only once.
Quality assessment
21 out of 25 studies reported with low risk of bias on the study flow and the selection of participants (figure 2), 23 out of 25 studies were deemed at low risk of bias for how they measured the predictors and 22 out of 25 studies were deemed at low risk of bias for how they measured exacerbations (given our broad definition of exacerbation). 14 studies were at low risk of bias for how the prediction models were developed statistically and how the statistical analysis was performed (the remaining 11 were at high risk). Six studies were at low risk of bias in terms of the performance measures used (while 19 studies were at high risk). 19 studies out of 25 were of good quality concerning the clinical data (i.e. the three bias categories selection, definition and measurement of predictors and outcomes and in terms of how patients were selected). Three out of 25 models were of good quality from a statistical point of view (i.e. the two categories statistical method and performance evaluation). Finally, two studies [28, 30] performed an internal validation [54] and two studies [23, 29] an external validation (other studies had a validation cohort, but they made a prediction for other outcomes or they did not provide any performance measure for the outcome exacerbation).
Electronic database search n=1345
Pubmed related article search, references, reviews, grey literature n=82
Number of studies after duplicates removed n=1382
Excluded on abstract n=1073
Included for full-text assessment n=309
Included n=25
Excluded on full-text assessment Reason for exclusion:
Not a prediction model (n=96) Different outcome (n=56) Not a primary study (n=42) Not the wanted study design (n=32) Others (n=58)
Total: n=284
FIGURE 1Prediction models or multivariable association of a set of predictors with the outcome exacerbation.
https://doi.org/10.1183/16000617.0061-2016 4
TABLE 1Study characteristics Studies by incidence of
exacerbation
Country Care setting Cohort study Patients#
Mean age years
Mean FEV1 % pred
Males % Definition of exacerbation
Follow-up years
Events in the analysis
Person-years of follow-up
Incidence exacerbations
per year per person
Low
BERTENS[29] Netherlands Outpatient primary care
Prospective 243/240 73 71 68 Event-based up to 2 >70 (70 patients with
⩾1 event)
480 >0.15
BERTENS[29] (validation) Netherlands Outpatient primary care
Prospective 793/793 67 71 53 Event-based up to 2 >222 (222 patients with⩾1 event)
1586 >0.14
PARSHALL[47] UK Outpatient primary care
Prospective 309/127 70 50 56 Symptom-based¶ up to 1 >98 (98 patients with ⩾1 event)
127 >0.77
MOTEGI[43] Japan Outpatient secondary care
Prospective 232/183 71 56 93 Symptom- and event-based
up to 2 193 366 0.53
ALMAGRO[23] Spain Outpatient secondary care
Prospective 679/606 73 45 90 Event-based up to 0.25 and 1
>98 (98 exacerbators to 3 months of follow-up period; data
from [51])
139.3 >0.70
ALMAGRO[23] (validation) Spain Outpatient secondary care
Prospective 395/377 72 41 94 Event-based 1
JONES[38] England Outpatient secondary care
Prospective 297+/
175§
67 42 71 Symptom-based up to 9 50 1575 0.03
SUETOMO[48] Japan Outpatient secondary or tertiary care
Prospective Not reported/
123
67 64 87 Symptom-basedƒ up to 1 106## 123 0.87
MÜLLEROVA[45] 12 countries Secondary and tertiary care
Prospective 2164/ 2138
63 48 65 Event-based up to 3 1452 5725¶¶ 0.25
THOMSEN[50] Denmark Outpatient tertiary care
Prospective++ 8020/
6574
67 80 47 Event-based 4 (median) 3083 26296 0.12
MOBERG[42] Denmark Outpatient tertiary care
Prospective 695/674 69 37 36 Unclear 5.5 (mean) >421 (421 patients with⩾1 event)
3822§§ >0.11
ONG[46] Singapore Outpatient tertiary care
Retrospective 127/127 71 44 91 Symptom-based 1.35 (mean)
318 (calculated using mean number of admissions (2.5))
171ƒƒ 0.08
TAKAHASHI[49] Japan Outpatient tertiary care
Prospective 109/93 73 55 100 Symptom-based up to 1 92### 93 0.88
FAGANELLO[33] Brazil Outpatient tertiary care
Prospective 120/120 65 61 71 Event-based up to 1 >95 (32 (27%) patients with 1 episode, 21 (18%) with 2 episodes, 7 (6%) with⩾3
episodes of exacerbation)
120 >0.79
GARCIA-AYMERICH[34] Spain Out- and inpatient tertiary care
Prospective 346/312 69 36 92 Symptom-based 1.1 (mean) >197 (63% of the patients (197) with⩾1
event)
343 >0.57
KO[39] China Inpatient tertiary care
Prospective 327/243 74 52 86 Event-based up to 3 >186 (186 patients with⩾1 readmission
for AECOPD)
729 0.26
BRUSSE-KEIZER[30] Netherlands Inpatient tertiary care
Control arm of RCT
121/121 65 58 84 Event-based up to 1 >62 (31 patients with
⩾2 events)
121 >0.51
ECHAVE[32] Spain Inpatient tertiary care
Prospective 120/93 71 43 89 Event-based up to 1 >61 (61 patients with
⩾1 event)
TABLE 1 Continued Studies by incidence of
exacerbation
Country Care setting Cohort study Patients# Mean age years
Mean FEV1 % pred
Males % Definition of exacerbation
Follow-up years
Events in the analysis
Person-years of follow-up
Incidence exacerbations
per year per person
GUDMUNDSSON[35] Sweden, Norway, Finland, Iceland, Denmark
Inpatient tertiary care
Prospective 416/406 69 34 49 Event-based up to 1 >246 (246 patients with⩾1 readmission;)
406 >0.61
AMALAKUHAN[28] USA Retrospective Not reported/
106
Unclear (presumably event-based)
up to 1 >100 (50 patients with
⩾2 events)
106 >0.94
Moderate
LEE[40] China, Taiwan,
Korea, Australia
Outpatient secondary or tertiary care
Prospective 545/495 69 47 88 Symptom-based up to 0.5 >338 (338 patients with⩾1 event; 226 had instead⩾1 moderate-to-severe
exacerbation)
247.5 >1.37
MOY[44] USA Outpatient secondary or tertiary care
Prospective 173/167 71 54 99 Event-based¶¶¶ 1.25 (mean)
263¶¶¶ 210 1.25
MARIN[41] Spain Outpatient tertiary care
Prospective 275/275 65 49 100 Event-based 5.1 (median)
2735 (incidence multiplied by person-years)
1402+++ 1.95
HURST[36] 12 countries Inpatient tertiary care
Prospective 2164/ 2138
63 48 65 Event-based up to 3 6927 (incidence multiplied by person-years)
5725§§§ 1.21
High
CHEN[31] Taiwan Outpatient secondary care
Prospective 150/143 72 49 73 Event-based 14 daysƒƒƒ 31 5.5 5.65 JACOB[37] Canada Outpatient
secondary or tertiary care
Prospective 115/115 67 43 47 Event-based 1.5 (mean) 683 (incidence multiplied by person-years)
207 3.30
ALMAGRO[27] Spain Inpatient tertiary care
Prospective 156/129 72 36 93 Event-based 1 335 (incidence multiplied by person-years)
129 2.60
Where data are not displayed, they were not reported and/or not straightforward to evaluate. The incidence of exacerbations category is indicated as low, moderate or high when the exacerbation rate is <1 exacerbation per person-year, between 1 and 2 exacerbations per person-year or >2 exacerbations per person-year, respectively. Age and forced expiratory volume in 1 s (FEV1) % pred refer to the mean in the study population. RCT: randomised controlled trial; AECOPD: acute exacerbations of chronic obstructive pulmonary disease. #: number of patients in cohort/number of patients in analysis;¶: slightly different data are provided for the other outcome analysed in the paper (healthcare use);+: data from [52];§: for
which dyspnoea, obstruction, smoking and exacerbation index scores were available;ƒ: the outcome hospital readmission for exacerbation was also analysed in the paper;##: obtained from the data event per patients in each of the two categories (high chronic obstructive pulmonary disease (COPD) assessment test group and low COPD assessment test group); ¶¶: proxy considering the patients included in the analysis (2138) and those completing the 3 years of follow-up (1679);++: from a population-based cohort a subgroup of individuals with COPD was randomly selected;§§: obtained multiplying the number of patients in the study by the mean follow-up;ƒƒ: calculated using the mean follow-up value;###: proxy obtained using the mean exacerbation frequency per year in the two categories (normal IgG-titer and high IgG-titer);¶¶¶: two different outcomes analysed (number of acute exacerbations and COPD-related hospitalisation), only the data for the outcome acute exacerbations are presented;+++: proxy obtained from the median value for the follow-up;§§§: proxy considering the patients included in the analysis (2138) and the ones completing the 3 years of follow-up (1679);ƒƒƒ: a follow-up of 3 months was also analysed in the paper.
https://d
oi.org/10.118
3/16000617.
0061-2016
6
C
OPD
|
B
.
GUERRA
ET
Statistical methods
Table 2 shows a description of the 27 prediction models ordered by underlying statistical method (the details of the two validation cohorts are shown as well, for a total of 29 rows); some papers included different analyses, in one case [40] different statistical methods were shown; in order to avoid confusion for the reader, we have included in table 2 only one statistical method per study, apart from those already discussed [23] (where we included the three indices as three independent prediction models). The most common statistical method was logistic regression (11 out of 25 different statistical methods analysed) followed by Cox regression (10), and correlation analysis between an index (or a multivariable regression equation) with the outcome (three). Finally, Poisson regression model, negative binomial regression model and random forest model were each used once.
Most of the prediction models (18 out of 27) were directly presenting a model with a predefined index or regression equation with predefined predictors. The remaining nine prediction models used some selection procedure of the variables (i.e.univariable selection process relying on p-values, stepwise selection process relying on p-values, combinations of both or selection process driven by the AUC).
For five prediction models (out of 27), performance related to both discrimination (e.g. AUC) and calibration (e.g. Hosmer–Lemeshow test) were reported (in [29] this is true for both derivation and validation cohort). A measure of discrimination (always AUC) was the most common performance provided (21 times out of 27 prediction models). Measures of overall performance (like R2or log-likelihood) and of calibration (Hosmer–Lemeshow p-value or Chi-squared) were less common ( provided, respectively for 12, three, six and five models). The performance measure provided for the two validation cohorts are the same than the ones for their respective derivation cohorts.
Clinical applicability of the models
The use of prediction models in practice needs to balance the clinical availability of predictors, i.e. the effort to obtain the information, the easiness with which doctors can obtain a risk for the individual patients and the predictive performance of the models. Ideally, predictors would be easily available, the model easy to obtain individual probabilities from, and the model would predict the risk of exacerbations accurately as shown by an external validation.
Table 3 shows the assessment of the readiness of the prediction models for clinical practice. The availability of predictors was based on the assessment of the availability of single predictors and how many of them were in different categories of availability (as shown in the online material,‘1’refers to a simple test or simple questions or medical charts, ‘2’refers to routine tests, ‘3’refers to specialised tests). 12 out of 27 models were deemed to have an easily available set of predictors across non-specialised and specialised
B ERTENS [29] A LMA GRO [23] T AKAHASHI [49] T HOMSEN [50] H URST [36] M ÜLLERO V A [45] M ARIN [41] O NG [46] B RUS SE-K EIZER [30] G ARCIA-A YMERICH [34] J AK OB [ [37] F A G ANELL O [ [33] G UDMUNDUS SON [ [35] Statistical analysis Performance of measures Validation of prediction model Study flow Predictors Outcome + + + + + + + + + + + + + + + + + + + + + + + + + + + + -- -- -- - - -- - - -- -+ + + + + + + + + + + + + + + + + + + +
+ x x x x x x x x x x x x x x x x x x x x x x x
+ + + + + + + + + + + + + + + + + + + + + + + + + + + + + + + + + + + ? ? ? ? + + + + K O [39] L EE [40] J ONES [38] C HEN [31] M O TEGI [43] S UET OMO [48] A LMA GRO [27] A MALAKUHAN [28] M OY [44] P ARSHALL [47] M OBERG [42] E CHA VE-S UST AET A [32]
+ Low risk of bias ? Medium risk of bias - High risk of bias x Not performed
FIGURE 2Framework for bias assessment of the studies evaluating prediction models and multivariable associations of a set of predictors with the outcome exacerbation.
https://doi.org/10.1183/16000617.0061-2016 7
TABLE 2Description of prediction models ordered by underlying statistical method First author [ref.] Statistical method Follow-up years Outcome of the
prediction model Derivation/ validation Procedure for variable selection Initial predictors n Final predictors n Measure of association
AUC (95%CI) HL Chi-squared
HL p-value R2
log2
likelihood
PARSHALL[47] Correlation analysis up to 1 Exacerbation (symptom-based) (healthcare use also
analysed)
Derivation Predefined variables# 1 0.65–0.70# 0.355–0.974#0.043–0.081#
MARIN[41] Correlation analysis 5.1 (median) Outpatient-treated exacerbation (hospitalisation also
analysed)
Derivation Predefined index 1 OR 0.78 (0.73–0.84) 0.31
JONES[38] Correlation analysis up to 9 Hospital admission for exacerbation
Derivation Predefined index 1 0.755¶
CHEN[31] Logistic regression 14 days+ Hospital readmission
for exacerbation
Derivation Predefined variables 9 OR 0.10 139.49
ALMAGRO[27] Logistic regression up to 1 Hospital readmission for exacerbation
Derivation Univariable selection 6 3 OR 1.9964 0.8496 0.146–0.194§
BRUSSE-KEIZER[30] Logistic regression up to 1 Patient with⩾2 exacerbations
Derivationƒ Univariable and stepwise selection
15 2 OR 0.717 (0.595–0.839) 7.512 0.483 0.099–0.15§
FAGANELLO[33] Logistic regression up to 1 Exacerbation Derivation Predefined index 1 OR 0.69##
SUETOMO[48] Logistic regression up to 1 Exacerbation (hospital readmission for exacerbation also
analysed)
Derivation Predefined variables 3 3 OR 0.77
TAKAHASHI[49] Logistic regression up to 1 Patient with⩾2 exacerbations
Derivation Predefined variables 11 RR 0.81 66.64 0.56 0.22
HURST[36] Logistic regression up to 1 Increased exacerbation
frequency
Derivation Stepwise selection 31 5 OR 0.22
BERTENS[29]
(derivation)
Logistic regression up to 2 Patients with⩾1 exacerbation
Derivation Backward stepwise selection
6 4 OR 0.75 (0.69–0.82) 8.66 0.37 0.26
BERTENS[29]
(validation)
Not expected up to 2 Patients with⩾1 exacerbation
Validation Not expected Not expected Not expected Not expected 0.66 (0.62–0.71) 32.98 0.00 0.09
MOTEGI[43] Logistic regression up to 2 Exacerbation Derivation p-value selection 14 2 OR 0.76–0.78++ 0.15–0.18++
THOMSEN[50] Logistic regression up to 1§§ Frequent exacerbator
(⩾2 exacerbations >1 year apart)
Derivation Predefined variables 8–11ƒƒ OR 0.71–0.73ƒƒ
LEE[40] Logistic regression up to 0.5 Any exacerbation (moderate–severe exacerbation (logistic regression) and time to first exacerbation (Cox regression) also
analysed)
Derivation Predefined variables 1–9### RR 0.64–0.79###
ALMAGRO[23] (derivation; CODEX)
Cox regression up to 1¶¶¶ Hospital readmission
for exacerbation
Derivation Predefined index 1 HR 0.583
ALMAGRO[23] (derivation; ADO)
Cox regression up to 1¶¶¶ Hospital readmission
for exacerbation
Derivation+++ Predefined index 1 HR 0.533
ALMAGRO[23] (derivation; BODEX)
Cox regression up to 1¶¶¶ Hospital readmission
for exacerbation
Derivation+++ Predefined index 1 HR 0.633
ALMAGRO[23] (validation; CODEX)
Not expected up to 1 Hospital readmission for exacerbation
Validation Not expected Not expected Not expected Not expected 0.590
ECHAVE-SUSTAETA[32] Cox regression up to 1 Hospital readmission for exacerbation
Derivation Univariable and stepwise selection
6 2 HR 0.7601 0.334
GUDMUNDSSON[35] Cox regression up to 1 Hospital readmission for exacerbation
Derivation Predefined variables Unclear 5 HR 2175.6
TABLE 2 Continued
First author [ref.] Statistical method Follow-up years Outcome of the prediction model
Derivation/ validation
Procedure for variable selection
Initial predictors n
Final predictors n
Measure of association
AUC (95%CI) HL Chi-squared
HL p-value R2 log 2
likelihood
GARCIA-AYMERICH[34] Cox regression 1.1 (mean) Hospital readmission for exacerbation
Derivation Univariable selection 23 7 HR 0.71
JAKOB[37] Cox regression 1.5 (mean) Any exacerbation (outpatient-treated and inpatient treated
exacerbations also analysed)
Derivation Predefined variables 7 RR 833.372§§§
MÜLLEROVA[45] Cox regression up to 3 Hospital admission for exacerbation
Derivation Predefined variables Unclear 6 HR 0.742 (0.718–0.766)ƒƒƒ 5.57ƒƒƒ 0.696ƒƒƒ 0.15ƒƒƒ
KO[39] Cox regression up to 3 Hospital readmission for exacerbation
Derivation Predefined index 1 HR 0.58####
MOBERG[42] Cox regression 5.5 (mean) Hospital admission for exacerbation
Derivation Univariable selection Unclear 18 HR 0.62 (0.59–0.65)
ONG[46] Poisson regression 1.35 (mean) Hospital Admission for exacerbation
Derivation Predefined index 1 IRR 0.16¶¶¶¶
MOY[44] Negative binomial regression
1.25 (mean) Exacerbation (hospital readmission also
analysed)
Derivation Predefined variables 4–5++++ Rate ratio 0.59–0.62++++
AMALAKUHAN[28] Random forest up to 1 Hospital readmission for exacerbation
Derivation§§§§ Variables of
importance evaluated with AUC
60 5 0.75ƒƒƒƒ
In this table only the data and analyses related to one outcome (in general the one deemed to be closer to the definition of exacerbation) are reported, with exception of [23], for which three different rows (for the three different predefined indices: CODEX (comorbidity, obstruction, dyspnoea and severe exacerbations), ADO (age, dyspnoea and airflow obstruction) and BODEX (body mass index (BMI), airflow obstruction, dyspnoea and severe exacerbations)) are used. Where data are not displayed, they were not reported and/or not straightforward to evaluate. The number of initial predictors is often a proxy we have evaluated. AUC: area under the curve; HL: Hosmer-Lemeshow test; OR: odds ratios; RR: relative risk; HR: hazard ratios; IRR: incidence rate ratios.
#: four-domain subscales of the Medical Outcomes Study short-form health survey (36 items) (general health perceptions, mental health, role limitation-physical, correlated mental-health score) were evaluated as separated prediction models; ¶: performance refers to the DOSE (dyspnoea, obstruction, smoking and exacerbation frequency) index (a performance was also discussed for Medical Research Council Dyspnoea Scale and forced expiratory volume in 1 s % pred); +: follow-up of 3 months also analysed; §: Cox-Snell-Nagelkerke definition of R2;ƒ: to assess over-fitting jackknife cross validation technique was applied to the prediction rule;##: performance refers to the BODE (BMI, airflow
obstruction, dyspnoea and exercise capacity) index (a performance for Global Initiative for Chronic Obstructive Lung Disease (GOLD) stage is also provided) and other multivariable models are also shown but no performance was provided;++: according to the model used (four different ones are presented);§§: the supplementary material of the study reports the data for a median follow-up of 4 years (range of performances with and without the three biomarkers evaluated in the study: 0.92–0.92);ƒƒ: according to the inclusion in the final model of three inflammatory biomarkers as predictors, net reclassification index used to evaluate (40%; 22–57%) the improvement in performances with the inclusion of the three biomarkers; ###: according to if chronic obstructive pulmonary disease (COPD) assessment test was categorised or not and if there was or not adjustment for other variables (age, BMI, duration of COPD, current smoking status, number of comorbidities, history of influenza vaccination, country); ¶¶¶: for the derivation cohort the follow-up of 3 months was also analysed; +++: validation was performed but no performance was provided;§§§: Akaike information and Schwarz-Bayes criteria also provided, but not reported here;ƒƒƒ: data provided upon request
by the authors;####: performance refers to the BODE index (a performance for the BODE’s 4-component was also provided);¶¶¶¶: performance refers to the BODE index (a performance for GOLD stage was also provided);++++: different models evaluated (Step_CRP, STEP_IL-6 or BODE);§§§§: internal validation performed;ƒƒƒƒ: mean AUC for 200 runs.
https://d
oi.org/10.118
3/16000617.
0061-2016
9
C
OPD
|
B
.
GUERRA
ET
healthcare settings, four out of 27 to have an moderately easy available set of predictors and 11 out of 27 to have a set of predictors whose data is difficult to obtain across healthcare settings. Only two models [23, 29] can be confidently used in other populations because an external validation was performed to assess the transportability of the prediction model [24]. Also, only one study [27] provided a way to easily obtain an estimate of the risk of an exacerbation for an individual patient and thus a basis for risk-stratified treatment. Overall, none of the existing models fulfilled all criteria for being ready for clinical application and use for risk-stratified treatment to personalise COPD care.
Discussion
Our systematic review identified 25 studies reporting on 27 statistical prediction models for exacerbation in patients with COPD. The prediction models differ greatly in terms of how they were developed and which predictors and measures for their predictive performance were used. Most studies were of good quality concerning the clinical settings and tests (i.e. selection, definition and measurement of predictors and outcomes and in terms of how patients were selected). However, most of the prediction models were at high risk of bias because unsound statistical methods to develop prediction models, and a lack of validation. The overall assessment of readiness of the 27 prediction models for use in practice showed that none were ready for clinical application.
Strengths and limitations
The strengths of this systematic review were the adherence to rigorous systematic review methodology and reporting guidelines, apart from a thorough search strategy and a great effort for retrieving the needed information from the authors. A limitation could be considered the broad inclusion criteria concerning the
TABLE 3Readiness of prediction models for clinical practice
First author [ref.] Availability predictors External validation Practical applicability
BERTENS[29] Easy Yes No
ALMAGRO[23] Easy Yes No
ALMAGRO[23] Easy Yes No
ALMAGRO[23] Easy Yes No
ALMAGRO[27] Difficult No Yes#
BRUSSE-KEIZER[30] Easy No¶ No
AMALAKUHAN[28] Easy No+ No
JONES[38] Easy No§ No
ECHAVE-SUSTAETA[32] Easy No No
JAKOB[37] Easy No No
MOTEGI[43] Easy No No
LEE[40] Easy No No
PARSHALL[47] Easy No No
CHEN[31] Medium No No
GUDMUNDUSSON[35] Medium No No
HURST[36] Medium No No
SUETOMO[48] Medium No No
FAGANELLO[33] Difficult No No
KO[39] Difficult No No
ONG[46] Difficult No No
GARCIA-AYMERICH[34] Difficult No No
MARIN[41] Difficult No No
MOBERG[42] Difficult No No
MOY[44] Difficult No No
MÜLLEROVA[45] Difficult No No
TAKAHASHI[49] Difficult No No
THOMSEN[50] Difficult No No
Availability predictors refers to how easy it is to obtain the data related to the predictors. External validation refers to the reliability of the model in terms of comparison of performance between derivation and eventual validation cohort. Practical applicability indicates if it is easy to extract individual likelihoods of exacerbation from the model. Studies presenting different models are considered only once, with exception of ALMAGROet al. [23] for which different predefined indices are shown.#: the paper explains how to you can obtain probabilities starting from the logistic regression equation and indicates how to calculate individual probabilities starting from the predictors;¶: the jackknife cross validation was applied but no performance was indicated;+: internal validation was applied but no performance is indicated;§: validation was performed for other outcomes.
https://doi.org/10.1183/16000617.0061-2016 10
definition of exacerbation, potentially introducing heterogeneity among models. Furthermore, the adopted broad definition of prediction model could have allowed the inclusion of studies not meant to concern prediction, but only evaluating the association of an index (or a multivariable regression equation) with the outcome. Nevertheless, we deemed our broader approach suitable in order not to miss prediction models that may be useful for clinical practice. Finally, the big heterogeneity of statistical methods used in literature makes probably not valuable to overall compare all the models even if they are providing the same performance measure (e.g. AUC), since they are often too different in terms of definition of exacerbations, time horizon, statistical method and outcome of the prediction model.
Future research
In order to come up with high-quality prediction models for exacerbations in COPD patients, a standard methodology for developing the models should be adopted [55]. For instance, in certain medical fields, some indices were validated and are currently used in clinical setting for risk-stratified prevention and treatment. The cardiovascular field, for example, has a long tradition that started with the Framingham Risk Score predicting the risk of cardiovascular disease [56] and led to clinical guidelines that heavily rely on risk-stratified prevention of cardiovascular disease [57, 58]. In COPD, high-quality prediction models, for example the BODE and ADO indices, have been developed and externally validated for the outcome of mortality [25, 26, 59]. There is also a research need to better understand how prediction models could be made as attractive as possible to use in practice. The optimal balance between availability of predictors, practical applicability and predictive measurement properties is not yet well understood [60, 61]. It is paramount that prediction models are validated thoroughly in order to make sure that the risk predictions are accurate across different populations and could be used with confidence for risk-stratified treatment [14, 24]. Finally, it would be ideal if the COPD community agreed on a single or very few different exacerbation prediction models since validations and implementation research are more efficient if there is a common prediction model compared with having many different prediction models [62]. Such a prediction model can always be improved by opportunely updating it (if necessary) in new cohorts [10, 63] and by adding promising predictors, but it needs to build upon prior knowledge on other datasets. Of course, separate models are justified if the decisions they inform are distinct, for example, in terms of time horizon.
Conclusions
Overall, none of the existing prediction models fulfilled the criteria for being ready for clinical application and use for risk-stratified treatment to personalise COPD care. The available COPD cohorts contain relevant populations, predictors and exacerbation measurements but a more harmonised approach to develop and validate high-quality predictions is needed to move personalised COPD medicine forward.
Acknowledgements
We would like to thank Sarah Crook, Laura Barin, Laura Werlen and Alex Marzel (all University of Zurich, Zurich, Switzerland) for their comments.
References
1 Hamburg MA, Collins FS. The path to personalized medicine.N Engl J Med2010; 363: 301–304.
2 Weston AD, Hood L. Systems biology, proteomics, and the future of health care: toward predictive, preventative, and personalized medicine introduction: paradigm changes in health care.J Proteome Res2004; 3: 179–196.
3 Agusti A. The path to personalised medicine in COPD.Thorax2014; 1–8.
4 Agusti A, Sobradillo P, Celli B. Addressing the complexity of chronic obstructive pulmonary disease: from phenotypes and biomarkers to scale-free networks, systems biology, and P4 medicine.Am J Respir Crit Care Med 2011; 183: 1129–1137.
5 Global Initiative for Chronic Obstructive Lung Disease (GOLD). Global strategy for the diagnosis, management and prevention of COPD, 2016. Available from: http://goldcopd.org/ Date last updated: 2016.
6 Puhan MA, Bachmann LM, Kleijnen J,et al.Inhaled drugs to reduce exacerbations in patients with chronic obstructive pulmonary disease: a network meta-analysis.BMC Med2009; 7: 2.
7 Yu T, Fain K, Boyd CM,et al.Benefits and harms of roflumilast in moderate to severe COPD.Thorax2014; 69: 616–622.
8 Hingorani AD, Windt DA, Riley RD, et al. Prognosis research strategy (PROGRESS) 4: stratified medicine research.BMJ2013; 346: e5793.
9 Yu T, Vollenweider D, Varadhan R, et al.Support of personalized medicine through risk-stratified treatment recommendations–an environmental scan of clinical practice guidelines.BMC Med2013; 11: 7.
10 Steyerberg EW. Clinical Prediction Models. Berlin, Springer, 2010.
11 Moons KG, Royston P, Vergouwe Y,et al.Prognosis and prognostic research 1: what, why, and how?BMJ2009; 338: 1317–1320.
12 Steyerberg EW, Moons KG, Van Der Windt DA,et al.Prognosis research strategy (PROGRESS) 3: prognostic model research.PLoS Med2013; 10: e1001381.
13 Moons KG, Kengne AP, Grobbee DE,et al.Risk prediction models: II. External validation, model updating, and impact assessment.Heart2012; 98: 691–698.
14 Bleeker S, Moll H, Steyerberg EW,et al.External validation is necessary in prediction research: a clinical example. J Clin Epidemiol2003; 56: 826–832.
https://doi.org/10.1183/16000617.0061-2016 11
15 Altman DG, Vergouwe Y, Royston P,et al.Prognosis and prognostic research 3: validating a prognostic model. BMJ2009; 338: 1432–1435.
16 Altman DG, Royston P. What do we mean by validating a prognostic model?Stat. Med2000; 19: 453–473.
17 Systematic Reviews (CRD guidance). Center for Reviews and Dissemination, York, University of York, 2009.
18 Moher D, Liberati A, Tetzlaff J,et al. Preferred Reporting Items for Systematic Reviews and Meta-Analyses: The PRISMA statement.Annu Intern Med2009; 151: 264–269.
19 Liberati A, Altman DG, Tetzlaff J,et al.The PRISMA statement for reporting systematic reviews and meta-analyses of studies that evaluate health care interventions: explanation and elaboration.PLoS Med2009; 6: e1000100.
20 Collins GS, Reitsma JB, Altman DG, et al. Transparent Reporting of a multivariable prediction model for Individual Prognosis Or Diagnosis (TRIPOD): The TRIPOD Statement.Ann Intern Med2015; 162: 55–64.
21 Harrell FE, Lee KL, Mark DB. Multivariable prognostic models: Issues in developing models, evaluating assumptions and adequacy, and measuring and reducing errors.Stat Med1996; 15: 361–387.
22 Cochrane Statistical Methods group and Cochrane Bias Methods Group. Assessing risk of bias in included studies. Cochrane Handb Syst Rev Interv2011.
23 Almagro P, Soriano JB, Cabrera FJ,et al.Short- and medium-term prognosis in patients hospitalized for COPD exacerbation: the CODEX index.Chest2014; 145: 972–980.
24 Justice AC, Covinsky KE, Berlin JA. Assessing the generalizability of prognostic information.Ann Intern Med 1999; 130: 515–524.
25 Celli BR, Cote CG, Marin JM,et al.The body-mass index, airflow obstruction, dyspnea, and exercise capacity index in chronic obstructive pulmonary disease.N Engl J Med2004; 350: 1005–1012.
26 Puhan MA, Garcia-Aymerich J, Frey M,et al.Expansion of the prognostic assessment of patients with chronic obstructive pulmonary disease: the updated BODE index and the ADO index.Lancet2009; 374: 704–711.
27 Almagro P, Barreiro B, Ochoa de Echaguen A,et al.Risk factors for hospital readmission in patients with chronic obstructive pulmonary disease.Respiration2006; 73: 311–317.
28 Amalakuhan B, Kiljanek L, Parvathaneni A,et al. A prediction model for COPD readmissions: catching up, catching our breath, and improving a national problem.J Community Hosp Intern Med Perspect2012; 2: 9915.
29 Bertens LC, Reitsma JB, Moons KG, et al. Development and validation of a model to predict the risk of exacerbations in chronic obstructive pulmonary disease.Int J Copd2013; 8: 493–499.
30 Brusse-Keizer M, van der Palen J, van der Valk P,et al.Clinical predictors of exacerbation frequency in chronic obstructive pulmonary disease.Clin Respir J2011; 5: 227–234.
31 Chen Y. Readmission in Taiwan.West J Nurs Res2006; 28: 105–124.
32 Echave-Sustaeta J, Comeche Casanova L, Garcia Lujan R,et al.Prognosis following acute exacerbation of COPD treated with non-invasive mechanical ventilation.Arch Bronconeumol2010; 46: 405–410.
33 Faganello MM, Tanni SE, Sanchez FF,et al.BODE index and GOLD staging as predictors of 1-year exacerbation risk in chronic obstructive pulmonary disease.Am J Med Sci2010; 339: 10–14.
34 Garcia-Aymerich J, Farrero E, Félez MA,et al.Risk factors of readmission to hospital for a COPD exacerbation: a prospective study.Thorax2003; 58: 100–105.
35 Gudmundsson G, Gislason T, Janson C,et al.Risk factors for rehospitalisation in COPD: role of health status, anxiety and depression.Eur Respir J2005; 26: 414–419.
36 Hurst JR, Vestbo J, Anzueto A,et al. Susceptibility to exacerbation in chronic obstructive pulmonary disease. N Engl J Med2010; 363: 1128–1138.
37 Jacob A, Laurin C, Boudreau M,et al.The impact of body mass index on chronic obstructive pulmonary disease exacerbations.Can Respir J2013; 18: 237–242.
38 Jones RC, Donaldson GC, Chavannes NH,et al.Derivation and validation of a composite index of severity in chronic obstructive pulmonary disease: the DOSE Index.Am J Respir Crit Care Med2009; 180: 1189–1195.
39 Ko FW, Tam W, Tung AH, et al. A longitudinal study of serial BODE indices in predicting mortality and readmissions for COPD.Respir Med2011; 105: 266–273.
40 Lee SD, Huang MS, Kang J,et al.The COPD assessment test (CAT) assists prediction of COPD exacerbations in high-risk patients.Respir Med2014; 108: 600–608.
41 Marin JM, Carrizo SJ, Casanova C, et al. Prediction of risk of COPD exacerbations by the BODE index. Respir Med2009; 103: 373–378.
42 Moberg M, Vestbo J, Martinez G,et al.Validation of the i-BODE index as a predictor of hospitalization and mortality in patients with COPD Participating in pulmonary rehabilitation.COPD2014; 11: 381–387.
43 Motegi T, Jones RC, Ishii T,et al.A comparison of three multidimensional indices of COPD severity as predictors of future exacerbations.Int J COPD2013; 8: 259–271.
44 Moy ML, Teylan M, Danilack VA,et al.An index of daily step count and systemic inflammation predicts clinical outcomes in chronic obstructive pulmonary disease.Ann Am Thorac Soc2014; 11: 149–157.
45 Müllerova H, Maselli DJ, Locantore N,et al.Hospitalized Exacerbations of COPD.Chest2015; 147: 999–1007.
46 Ong KC, Earnest A, Lu SJ. A multidimensional grading system (BODE index) as predictor of hospitalization for COPD.Chest2005; 128: 3810–3816.
47 Parshall MB, Mapel DW, Rice L,et al.Predictive validity of short-form health survey 36 items scales for chronic obstructive pulmonary disease exacerbation.Hear Lung J Acute Crit Care2008; 37: 356–365.
48 Suetomo M, Kawayama T, Kinoshita T, et al. COPD assessment tests scores are associated with exacerbated chronic obstructive pulmonary disease in Japanese patients.Respir Investig2014; 52: 288–295.
49 Takahashi T, Muro S, Tanabe N, et al. Relationship between periodontitis-related antibody and frequent exacerbations in chronic obstructive pulmonary disease.PLoS One2012; 7: e40570.
50 Thomsen M, Ingebrigtsen TS, Marott JL,et al.Inflammatory biomarkers and exacerbations in chronic obstructive pulmonary disease.JAMA2013; 309: 2353–2361.
51 Almagro P, Cabrera FJ, Diez J,et al.Comorbidities and short-term prognosis in patients hospitalized for acute exacerbation of COPD: the EPOC en Servicios de medicina interna (ESMI) study.Chest2012; 142: 1126–1133.
52 Hurst JR, Donaldson GC, Quint JK,et al.Temporal clustering of exacerbations in chronic obstructive pulmonary disease.Am J Respir Crit Care Med2009; 179: 369–374.
53 Vestbo J, Hurd SS, Agustí AG,et al.Global strategy for the diagnosis, management, and prevention of chronic obstructive pulmonary disease GOLD executive summary.Am J Respir Crit Care Med2013; 187: 347–365.
https://doi.org/10.1183/16000617.0061-2016 12
54 Steyerberg EW, Harrell FE, Borsboom GJ, et al. Internal validation of predictive models: efficiency of some procedures for logistic regression analysis.J Clin Epidemiol2001; 54: 774–781.
55 Moons KG, Kengne AP, Woodward M,et al.Risk prediction models: I. Development, internal validation, and assessing the incremental value of a new (bio)marker.Heart2012; 98: 683–690.
56 Wilson PWF, D’Agostino RB, Levy D, et al. Prediction of coronary heart disease using risk factor categories. Circulation1998; 97: 1837–1847.
57 Goldstein LB, Bushnell CD, Adams RJ,et al.Guidelines for the primary prevention of stroke: a Guideline for Healthcare Professionals from the American Heart Association/American Stroke Association.Stroke 2011; 42: 517–584.
58 Expert Panel on Detection, Evaluation and T of HBC in A. Executive summary of the third report of the national cholesterol education program Expert Panel on Detection, Evaluation and Treatment of High Blood Cholesterol in Adults (Adult Treatment Panel III).JAMA2001; 285: 2486–2497.
59 Puhan MA, Hansel NN, Sobradillo P,et al.Large-scale international validation of the ADO index in subjects with COPD: an individual subject data analysis of 10 cohorts.BMJ Open2012; 2: e002152.
60 Moons KGM, Altman DG, Vergouwe Y,et al.Prognosis and prognostic research 4: application and impact of prognostic models in clinical practice. 2014; 338: 1487–1490.
61 Wyatt JC, Altman DG. Commentary: Prognostic models: clinically useful or quickly forgotten?BMJ1995; 311: 1539–1541.
62 Toll DB, Janssen KJM, Vergouwe Y,et al.Validation, updating and impact of clinical prediction rules: a review. J Clin Epidemiol2008; 61: 1085–1094.
63 Steyerberg EW, Borsboom GJJM, van Houwelingen HC,et al. Validation and updating of predictive logistic regression models: a study on sample size and shrinkage.Stat Med2004; 23: 2567–2586.
https://doi.org/10.1183/16000617.0061-2016 13