© 2019 IAU, Majlesi Branch
Multi-Objective Optimization
of the Stamping of Titanium
Bipolar Plates for Fuel Cell
Vahid Modanloo, Vali Alimirzaloo
*Department of Mechanical Engineering, Urmia University, Iran
E-mail: [email protected], [email protected] *Corresponding author
Majid Elyasi
Department of Mechanical Engineering,
Babol Noshirvani University of Technology, Iran E-mail: [email protected]
Received: 13 June 2019, Revised: 27 September 2019, Accepted: 1 November 2019
Abstract: High demands of quality development in the industry especially
automotive, necessitates multi-objective optimization of the manufacturing processes. Fuel cells are one of the most important sources of renewable energies that bipolar plates (BPPs) are their main components. Metallic BPPs are known as a suitable replacement of the graphite plates due to their lower weight and cost. Accordingly, this study employs multi-criteria decision making (MCDM) methods to determine the best forming condition in the stamping of titanium BPP. In the first step, the process is analyzed using the finite element (FE) simulation. Afterward, validation of the FE model is confirmed by performing the experiments using titanium ultra-thin sheet with a thickness of 0.1 mm. Subsequently, a set of tests with 15 experiments are assumed to be as alternatives. In addition, filling ratio, thinning ratio and forming load are considered as different criteria. In order to select the optimum condition considering three mentioned responses simultaneously, TOPSIS and VIKOR methods are applied. In addition, a weighting procedure combining AHP and Entropy approaches is used. Based on the weighting results, the highest and lowest weights were obtained for filling ratio (0.5398) and forming load (0.1632), respectively. Likewise, a Spearman’s rank equal to 0.9357 was obtained that demonstrates high compatibility between TOPSIS and VIKOR methods. Overall, the best (optimum) forming condition has obtained an experiment with a clearance of 0.2 mm, the speed of 3.5 mm/s, and friction coefficient as 0.2.
Keywords: Ranking, Titanium Bipolar Plates, Topsis, Vikor, Weighting
Reference: Modanloo, V., Alimirzaloo, V., and Elyasi, M., “Multi-Objective
Optimization of The Stamping of Titanium Bipolar Plates for Fuel Cellˮ, Int J of Advanced Design and Manufacturing Technology, Vol. 12/No. 4, 2019, pp. 1–8.
Biographical notes: Vahid Modanloo is a PhD candidate at Urmia University, Iran.
He received his BSc and MSc from the Babol Noshirvani University of Technology. He did six months visiting research under the supervision of Professor Naksoo Kim at Sogang University, Seoul, South Korea. His main research interests are metal forming and optimization of the manufacturing processes. Vali Alimirzaloo is an Assistant Professor of Mechanical Engineering at Urmia University. He received his BSc and PhD in Mechanical Engineering from Amirkabir University of Technology, Iran. His current research focuses on the die design and metal forming process.
© 2019 IAU, Majlesi Branch 1 INTRODUCTION
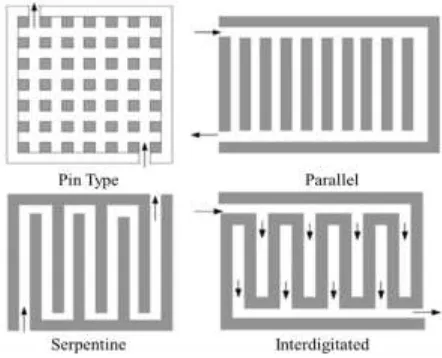
Proton Exchange Membrane Fuel Cells (PEMFCs) are a perfect alternative for internal combustion engines because of their clean energy and reduced greenhouse gas emissions. Bipolar Plates (BPPs) are the most important components of a fuel cell that dramatically reduce their weight and cost. Common types of bipolar plates are made of graphite, composite and metal. However, metallic one has become more attractive to engineers and designers due to its excellent mechanical and electrical properties, ease of production, good thermal properties and reduced production time. The flow filed design for BPPs is divided into four different types namely pin type, parallel, serpentine, and interdigitated as shown in “Fig. 1ˮ [1-5]. Titanium is a potential candidate for structural components in many industries such as automotive, aerospace, medical, electronics and etc. due to its low weight to strength ratio, high structural stiffness, excellent corrosion resistance, and high biocompatibility [6-8]. Stamping is one of the common applicable methods for forming of metallic sheets into hollow parts on a shaped punch and matrix using a press machine. This process is widely used in the aforementioned industries. Reduction of production time in mass production, low material wastage, high repeatability, and cost reduction are among the benefits of this process [9-11].
Fig. 1 Different types of flow filed design for BPPs.
Conventional design methods mainly focused on trial and error or experimental methods that cause an increase in cost and time that to get rid of this, a combination of multi-response optimization techniques with the Design of Experiments (DOE) and Finite Element (FE) methods can be effective [12]. In recent years, some significant studies have been reported on optimizing the manufacturing process and FE methods using different
DOE methods such as response surface method [13-16] and also MCDM methods in order to decide the optimum condition and the best candidate for material selection [17-21].
Since BBPs play an important role in the final cost and weight of a fuel cell stack, their manufacturing process should be optimized. There are some important requirements that BPPs should meet them to retain their performance during operationis including higher channel depth, lower thinning and lower cost of production. However, up to now, no research was found considering different criteria simultaneously in the stamping of titanium BPPs (having an initial thickness of 0.1 mm) according to the best knowledge of the authors. This study, for the first time, endeavors to select the best forming condition for manufacturing metallic BPP among a number of experiments regarding different criteria. By assimilation of process parameters i.e. clearance of die, stamping speed and die/sheet friction coefficient, 15 experiments were designed to be as alternatives. On the other hand, filling rate, thinning rate, and forming load are considered as different criteria. Overall, the best level of parameters is selected by using VIšekriterijumsko KOmpromisno Rangiranje (VIKOR) and technique for order preferences by similarity to ideal solution (TOPSIS) methods.
2 MCDM PROBLEM DEFINITION
Since BPPs are the key component of a fuel cell, they are supposed to play their roles perfectly to attain higher efficiency. Distribution of fuel flow in the anode and air or oxygen in the cathode, gathering the external flow of cathode and anode, the transmission of electrons to the cell, and cooling the fuel cell are their duties [22]. Corrosion resistance is one of the most important properties that BPPs must meet this characteristic because they work in an acidic environment. Due to the excellent corrosion resistance of titanium material and also being able to diffusion-bond with itself, commercially pure (CP) titanium thin sheet with a thickness of 0.1 mm is selected in this study.
© 2019 IAU, Majlesi Branch 2.1. FE Simulation
In order to simulate the stamping process, the ABAQUS FE software was used. The uniaxial tensile test was carried out to determine the mechanical properties of the titanium sheet according to the ASTM E8M standard. Figure 2 illustrates the true stress-strain curve (obtained from the tensile test) used in the simulation.
Fig. 2 True stress-strain curve of the titanium sheet:
(a): dimension of the tensile test sample (in mm), (b): before tension, and (c): after tension.
It should be noted that the thickness of the titanium sheet was considered as 0.1 mm. The sheet was meshed using CPE4R element that is a 4-node bilinear plane strain quadrilateral element with reduced integration and hourglass control. Mesh sensitivity analysis was performed for selecting the best number of the mesh. Eventually, 4 and 170 elements were used through the thickness direction and longitudinal direction, respectively. Furthermore, no meshing was used for die set due to the analytical rigid consideration. In order to define the interaction between the sheet and die interfaces, the Coulomb friction model was used with a coefficient of 0.1. A reference point was defined for the upper and lower dies to assign the boundary conditions. Figure 3 represents a part of the 2D FE model before starting the process.
Fig. 3 The 2D FE model before starting the process.
2.2. Experimental Procedure
A stamping die with the same geometrical dimensions of the simulation was conducted to perform the experiments. Due to excellent wear characteristics, H13 material was selected to manufacture the upper and lower dies. A parallel design with four channels and dimensions of 30×15 mm was applied. The experimental tests were implemented using a 20 tons testing machine. After performing the experiment, the formed sample was polished and then prepared to be evaluated under a microscope that the magnified image of the channel is shown in “Fig. 4ˮ.
Fig. 4 Magnified (40 times) image of the channel.
2.3. Validation of the FE Model
In order to validate the FE model, the thickness of cross-section of the formed sample at typical zones was compared to that one obtained from the experiment. Figure 5 displays the comparison between simulation and experimental results that implies a relatively acceptable agreement. Hence, the validated FE model was further used to carry out a set of tests. By a combination of the process parameters i.e. clearance of die (C), stamping speed (V), and die/sheet friction coefficient (µ), 15 FE experiments were considered as alternatives.
Fig. 5 Comparison of the thickness of the formed plates:
(a): Experiment and (b): Simulation. 0
100 200 300 400 500 600 700 800
0 0.01 0.02 0.03
Stre
ss
(
Mp
a)
© 2019 IAU, Majlesi Branch 2.4. Calculation of the Outputs
At the next step, the filling rate (FR), thinning rate (TR), and forming load (FL) were considered as different criteria. It is important to note that FR and TR are calculated by “Eqs. (1) and (2)ˮ, respectively.
100
(%)
H h ratio
Filling (1)
100 (%)
0
0
t t t ratio
Thinning f (2)
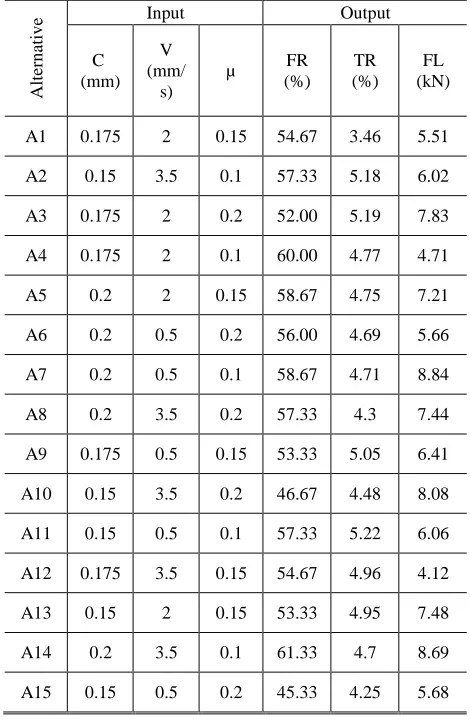
In “Eq. (1)ˮ, h and H denote obtained filling depth and real channel depth (0.75 mm), respectively. Moreover, in “Eq. (2)ˮ, t0 and tf denote the initial thickness of the sheet and final thickness of the formed BPP, respectively. In order to construct the decision matrix, the designed tests (alternatives) were numerically implemented and the outputs (criteria) were extracted that the results are given in “Table 1ˮ.
Table 1 Decision matrix
Altern
ati
v
e Input Output
C (mm)
V (mm/
s)
µ FR
(%)
TR (%)
FL (kN)
A1 0.175 2 0.15 54.67 3.46 5.51
A2 0.15 3.5 0.1 57.33 5.18 6.02
A3 0.175 2 0.2 52.00 5.19 7.83
A4 0.175 2 0.1 60.00 4.77 4.71
A5 0.2 2 0.15 58.67 4.75 7.21
A6 0.2 0.5 0.2 56.00 4.69 5.66
A7 0.2 0.5 0.1 58.67 4.71 8.84
A8 0.2 3.5 0.2 57.33 4.3 7.44
A9 0.175 0.5 0.15 53.33 5.05 6.41
A10 0.15 3.5 0.2 46.67 4.48 8.08
A11 0.15 0.5 0.1 57.33 5.22 6.06
A12 0.175 3.5 0.15 54.67 4.96 4.12
A13 0.15 2 0.15 53.33 4.95 7.48
A14 0.2 3.5 0.1 61.33 4.7 8.69
A15 0.15 0.5 0.2 45.33 4.25 5.68
3 WEIGHTING AND RANKING PROCEDURE
3.1. Weighting Methods 3.1.1. Synthesis method
In order to gain more sensible weights, it is advised to consider both subjective and objective weights of the criteria. Accordingly, a synthesis weighting method (comprises AHP and Entropy approaches) is used as “Eq. (3)ˮ in which αj and βj denote the weight of jth criteria resulted from the AHP and Entropy, respectively [23]:
n j
w n
j
j j
j j
j , 1,2,...,
1
(3)3.1.2. AHP method
AHP (Analytic Hierarchy Process) is a useful tool to solve complex MCDM problems. This method uses a pairwise comparison matrix (n×n, n is the number of the criteria) considering Saaty’s relative importance scale in which the numbers 1, 3, 5, 7, and 9 represent equal importance, moderate importance, strong importance, very strong importance, absolute importance, respectively. Moreover, the numbers 2, 4, 6, and 8 demonstrate compromise importance between the mentioned numbers. An important step in the AHP method is the calculation of the consistency index (CI) and the consistency ratio (CR) that ensures consistency of the subjective perception and the accuracy of the comparative weights [24]. “Eqs. (4) and (5)ˮ are used to calculate CI and CR, respectively as follow:
1
max
n n
CI
(4)RI CI
CR (5)
It should be pointed out that RI value for a 3×3 matrix (n=3) is 0.58. Likewise, the CR value should be less than 0.1 for consistency.
3.1.3. Entropy method
© 2019 IAU, Majlesi Branch n j m i x x P m i ij ij
ij , 1,2,..., ; 1,2,...,
1
(6)In the next step, the Entropy value of jth criteria (E j) is calculated as follow:
n j P P m E m i ij ij
j ln( ), 1,2,...,
) ln( 1 1
(7)In the last step, the degree of divergence (dj) of criteria and Entropy weight of each criterion is determined using “Eqs. (8) and (9)ˮ, respectively [25]:
n j
E
dj 1 j, 1,2,..., (8)
n j d d n j j j
j , 1,2,...,
1
(9)3.2. Ranking Methods 3.2.1. TOPSIS method
TOPSIS assigns the best rank to the alternative that has the shortest distance from the ideal solution and the longest distance from nadir solution. The first step of this method is the construction of normalized decision matrix using “Eq. (10)ˮ. In the next step, multiplying the compromised weight (wj) to the related column of the normalized decision matrix is done to form a weighted normalized decision matrix by “Eq. (11)ˮ:
n j m i x x n m i ij ij
ij , 1,2,..., ; 1,2,...,
1
(10) n j m i w nVij ij. j, 1,2,..., ; 1,2,..., (11)
Afterward, “Eq.s (12) and (13)ˮ are used to obtain the ideal and nadir solutions, respectively:
MaxV j K MinV j K i m
V V V ij i ij i n ,..., 2 , 1 ) ( ), ( ,..., , 2 1 (12)
MinV j K MaxV j K i m
V V V ij i ij i n ,..., 2 , 1 ) ( ), ( ,..., , 2 1 (13)In the last step, the distance of each alternative from the ideal and nadir solutions are computed using “Eqs. (14) and (15)ˮ. Finally, the relative closeness of each alternative to the ideal solution (Ci) is calculated by
using “Eq. (16)ˮ. It should be noted that the higher the value of Ci, the better the rank of alternative [26]:
V V
j nd
n
j
j ij
i , 1,2,...,
5 . 0 1 2
(14)
V V
j nd
n
j
j ij
i , 1,2,...,
5 . 0 1 2
(15)
i i i i d d d
C (16)
3.2.2. VIKOR ethod
VIKOR is a powerful solution for selecting the best alternatives with respect to their performance. In the first step, the best (xijmax) and the worst (xijmin) values of each
criterion should be determined from the decision matrix. In the next step, Ei and Fi values are calculated via “Eqs.
(17) and (18)ˮ, respectively:
j nx x x x w E n
j ij ij
ij ij j
i , 1,2,...,
1 min max max
(17)
j nx x x x w Max F ij ij ij ij j n
i max min , 1,2,...,
max
(18)
In the final step, “Eq. (19)ˮ is applied to calculate the Pi index that implies an that alternative with lower Pi value
has the best rank. In this equation, Ei−max and Ei−min denote the maximum and minimum values of Ei, and
Fi−max and Fi−min denote the maximum and minimum
values of Fi. Likewise, in this research, the ν value is considered as 0.5 [27]:
min max min min max min 1 i i i i i i i i i F F F F E E E EP (19)
4 RESULTS AND DISCUSSION
4.1. Weighting Analysis
© 2019 IAU, Majlesi Branch
Fig. 6 Weights of different criteria by synthesis method
(wj), AHP (αj), and Entropy (βj).
4.2. Ranking Analysis 4.2.1. TOPSIS method
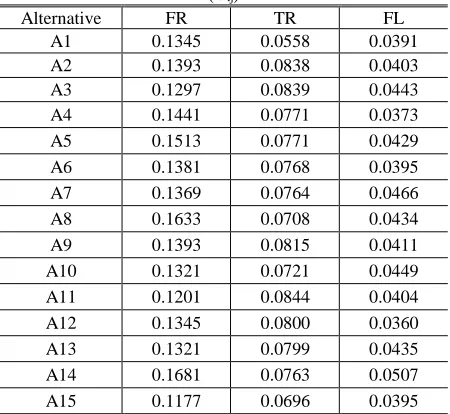
The MCDM problem was first solved by the TOPSIS method. The normalized decision matrix columns were multiplied to synthesis weights (wj) using “Eq. (11)ˮ and the weighted decision matrix was obtained in “Table 2ˮ. The ideal and nadir solutions calculated by “Eqs. (12) and (13)ˮ are given in “Table 3ˮ. At the final step, the distances from the ideal and nadir solutions (di+ and di-) and relative closeness to the ideal solution (Ci) are specified using “Eqs. (14-16)ˮ. “Table 4ˮ represents the alternative ranking. As can be seen, alternative number 8, was obtained as the best rank because of the highest Ci value.
Table 2The weighted and the normalized decision matrix
(Vij)
Alternative FR TR FL
A1 0.1345 0.0558 0.0391
A2 0.1393 0.0838 0.0403
A3 0.1297 0.0839 0.0443
A4 0.1441 0.0771 0.0373
A5 0.1513 0.0771 0.0429
A6 0.1381 0.0768 0.0395
A7 0.1369 0.0764 0.0466
A8 0.1633 0.0708 0.0434
A9 0.1393 0.0815 0.0411
A10 0.1321 0.0721 0.0449
A11 0.1201 0.0844 0.0404
A12 0.1345 0.0800 0.0360
A13 0.1321 0.0799 0.0435
A14 0.1681 0.0763 0.0507
A15 0.1177 0.0696 0.0395
Table 3 The ideal and nadir solutions
FR TR FL
+
V 0.1681 0.0558 0.0360
-V 0.1177 0.0844 0.0507
Table 4 di+, di- and Ci
Alternative Ei Fi Pi Rank
A1 0.0338 0.0352 0.5102 4
A2 0.0404 0.0240 0.3729 8
A3 0.0483 0.0136 0.2198 14
A4 0.0321 0.0305 0.4871 5
A5 0.0280 0.0353 0.5576 3
A6 0.0368 0.0245 0.4002 6
A7 0.0389 0.0212 0.3529 10
A8 0.0174 0.0482 0.7351 1
A9 0.0390 0.0238 0.3795 7
A10 0.0405 0.0199 0.3290 11
A11 0.0561 0.0106 0.1593 15
A12 0.0414 0.0228 0.3545 9
A13 0.0440 0.0167 0.2755 12
A14 0.0252 0.0511 0.6696 2
A15 0.0524 0.0186 0.2615 13
4.2.2. VIKOR Method
The VIKOR parameters i.e. Ei, Fi, and Pi were calculated by determining the best and the worst of all criteria from the decision matrix and using “Eqs. (17-19)ˮ that the results are given in “Table 5ˮ. As can be inferred, the alternative number 8 was obtained as the first rank that is one hundred percent similar to the TOPSIS result.
Table 5 Ei, Fi and Pi
Alternative Ei Fi Pi Rank
A1 0.3943 0.3597 0.3583 3
A2 0.6458 0.3085 0.5121 9
A3 0.7952 0.4112 0.7768 13
A4 0.4925 0.2570 0.3108 2
A5 0.4776 0.2211 0.2510 4
A6 0.5771 0.3212 0.4684 5
A7 0.6658 0.3341 0.5630 10
A8 0.2889 0.1553 0.0000 1
A9 0.6319 0.3085 0.4999 8
A10 0.6527 0.3856 0.6185 11
A11 0.8591 0.5140 0.9664 15
A12 0.6112 0.3597 0.5485 7
A13 0.7189 0.3856 0.6765 12
A14 0.3758 0.2126 0.1508 6
A15 0.7219 0.5398 0.8797 14
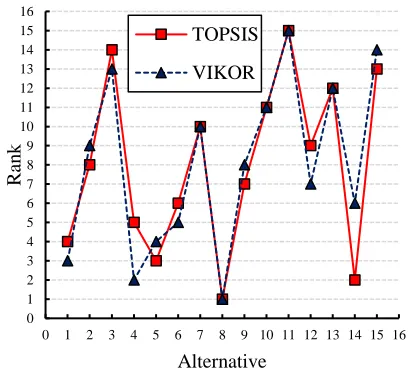
4.2.3. Comparison of the TOPSIS and VIKOR methods
Comparison of both utilized ranking methods is shown in “Fig. 7ˮ. As is depicted, alternative number 8 has the
FR TR FL
Synthesis 0.5398 0.2970 0.1632
AHP 0.5400 0.2970 0.1630
Entropy 0.3331 0.3332 0.3337
0.0 0.1 0.2 0.3 0.4 0.5 0.6
W
eig
h
© 2019 IAU, Majlesi Branch best rank in both methods. In this alternative, the values
of the process parameters are set as C= 0.2 mm, V= 3.5 mm/s, and µ=0.2. Furthermore in this experiment, the FR, TR, and FL were obtained as 57.33%, 4.30%, and 7.44 kN, respectively. On the other hand, the alternative number 11 has the worst rank in both TOPSIS and VIKOR methods. In addition, alternatives number 7, 10, and 13 have the same rank in both methods. In order to find compatibility with the used methods, Spearman’s rank correlation was implemented. The correlation coefficient was obtained equal to 0.9357. This coefficient was obtained as 0.83, 0.9471, and 0.96 in the works of Athawale et al. [28], Moradian et al. [25], and Çalışkan et al. [27], respectively.
Fig. 7 Comparison of the utilized ranking methods.
5 CONCLUSION
In this study, the selection of the best (optimum) forming condition in the stamping process of titanium bipolar plate was performed using TOPSIS and VIKOR methods. Some experiments were assumed to be as alternatives in which clearance of die, stamping speed, and die/sheet friction coefficient are chosen as the process parameters. On the other hand, filling ratio, thinning ratio, and forming load were considered as different criteria. The weighting procedure was carried out using a synthesis method that comprises AHP and Entropy approaches. The most important results of this research are listed as follow:
1- By applying the synthesis method combining AHP and Entropy approaches, the highest and lowest weights of the criteria were obtained equal to 0.5398 and 0.1632 for filling rate and forming load, respectively.
2- The optimum alternative (experiment) to manufacture the titanium bipolar plate was found in the
experiment with values as 0.2 mm clearance, 3.5 mm/s speed, and 0.2 friction coefficient in both TOPSIS and VIKOR methods.
3- The optimized condition for stamping of titanium BPP in both MCDM methods resulted in a final BPP with 57.33% of filling ratio, 4.30% of thinning and 7.44 kN.
4- The two used MCDM methods were compared using Spearman’s rank correlation coefficient. The comparison result illustrated that there is a good correlation between the methods.
6 REFERENCES
[1] Taherian, R., A Review of Composite and Metallic Bipolar Plates in Proton Exchange Membrane Fuel Cell: Materials, Fabrication, and Material Selection, Journal of Power Sources, Vol. 265, 2014, pp. 370-90, 10.1016/j.jpowsour.2014.04.081.
[2] Kolahdooz, R., Asghari, S., Rashid-Nadimi, S., and Amirfazli, A., Integration of Finite Element Analysis and Design of Experiment for the Investigation of Critical Factors in Rubber Pad Forming Of Metallic Bipolar Plates for PEM Fuel Cells, International Journal of Hydrogen Energy, Vol. 42, No. 1, 2017, pp. 575-589, 10.1016/j.ijhydene.2016.11.020.
[3] Belali-Owsia, M., Bakhshi-Jooybari, M., Hosseinipour, S. J., and Gorji, A. H., A New Process of Forming Metallic Bipolar Plates for PEM Fuel Cell with Pin-Type Pattern, The International Journal of Advanced Manufacturing Technology, Vol. 77, No. 5-8, 2015, pp. 1281-1293, 10.1007/s00170-014-6563-3.
[4] Bong, H. J., Lee, J., Kim, J. H., Barlat, F., and Lee, M. G., Two-Stage Forming Approach for Manufacturing Ferritic Stainless Steel Bipolar Plates in Pem Fuel Cell: Experiments and Numerical Simulations, International Journal of Hydrogen Energy, Vol. 42, No. 10, 2017, pp. 6965-6977, 10.1016/j.ijhydene.2016.12.094.
[5] Peng, L., Yi, P., and Lai, X., Design and Manufacturing of Stainless Steel Bipolar Plates for Proton Exchange Membrane Fuel Cells, International Journal of Hydrogen Energy, Vol. 39, No. 36, 2014, pp. 21127-21153, 10.1016/j.ijhydene.2014.08.113.
[6] Ozturk, F., Ece, R. E., Polat, N., Koksal, A., Evis, Z., and Polat, A., Mechanical and Microstructural Evaluations of Hot Formed Titanium Sheets by Electrical Resistance Heating Process, Materials Science and Engineering: A, Vol. 578, 2013, pp. 207-214, 10.1016/j.msea.2013.04.079.
[7] Badr, O. M., Rolfe, B., Hodgson, P., and Weiss, M., Forming of High Strength Titanium Sheet at Room Temperature, Materials & Design, Vol. 66, 2015, pp. 618-626, 10.1016/j.matdes.2014.03.008.
[8] Maati, A., Tabourot, L., Balland, P., Ouakdi, E. H., Vautrot, M., and Ksiksi, N., Constitutive Modeling Effect on the Numerical Prediction of Springback Due To a Stretch-Bending Test Applied on Titanium T40
0 1 2 3 4 5 6 7 8 9 10 11 12 13 14 15 16
0 1 2 3 4 5 6 7 8 9 10 11 12 13 14 15 16
R
an
k
Alternative TOPSIS
© 2019 IAU, Majlesi Branch
Alloy, Archives of Civil and Mechanical Engineering, Vol. 15, No. 4, 2015, pp. 836-846, 10.1016/j.acme.2015.05.009.
[9] Dur, E., Cora, Ö. N., and Koç, M., Effect of Manufacturing Process Sequence on the Corrosion Resistance Characteristics of Coated Metallic Bipolar Plates, Journal of Power Sources, Vol. 246, 2014, pp. 788-799, 10.1016/j.jpowsour.2013.08.036.
[10]Koo, J. Y., Jeon, Y. P., and Kang, C. G., Effect of Stamping Load Variation on Deformation Behavior of Stainless Steel Thin Plate with Microchannel, Proceedings of the Institution of Mechanical Engineers, Part B: Journal of Engineering Manufacture, Vol. 227, No. 8, 2013, pp. 1121-1128, 10.1177/0954405412462673.
[11]Jin, C. K., Koo, J. Y., and Kang, C. G., Fabrication of Stainless Steel Bipolar Plates for Fuel Cells Using Dynamic Loads for the Stamping Process and Performance Evaluation of a Single Cell, International Journal of Hydrogen Energy, Vol. 39, No. 36, 2014, pp. 21461-21469, 10.1016/j.ijhydene.2014.04.103.
[12]Alimirzaloo, V., Modanloo, V., Minimization of the Sheet Thinning in Hydraulic Deep Drawing Process Using Response Surface Methodology and Finite Element Method, International Journal of Engineering (IJE), Transactions B: Applications, Vol. 29, No. 2, 2016, pp. 264-273, 10.5829/idosi.ije.2016.29.02b.16.
[13]Moradi, M., Golchin, E., Investigation on the Effects of Process Parameters on Laser Percussion Drilling Using Finite Element Methodology; Statistical Modelling and Optimization, Latin American Journal of Solids and Structures, Vol. 14, No. 3, 2017, pp. 464-484, 10.1590/1679-78253247.
[14]Moradi, M., Ghoreishi, M., and Rahmani, A., Numerical and Experimental Study of Geometrical Dimensions on Laser-TIG Hybrid Welding of Stainless Steel 1.4418, Journal of Modern Processes in Manufacturing and Production, Vol. 5, No. 2, 2016, pp. 21-31.
[15]Moradi, M., KaramiMoghadam, M., High Power Diode Laser Surface Hardening of AISI 4130; Statistical Modelling and Optimization, Optics & Laser Technology, Vol. 111, 2019, pp. 554-570, 10.1016/j.optlastec.2018.10.043.
[16]Vahdati, M., Mahdavinejad, R. A., Amini, S., and Moradi, M., Statistical Analysis and Optimization of Factors Affecting The Surface Roughness in the UVaSPIF Process Using Response Surface Methodology, Journal of Advanced Materials and Processing, Vol. 3, No. 1, 2015, 15-28.
[17]Patel, J. D., Maniya, K. D., Application of AHP/MOORA Method to Select Wire Cut Electrical Discharge Machining Process Parameter to Cut En31 Alloys Steel with Brasswire, Materials Today: Proceedings, Vol. 2, No. (4-5), 2015, pp. 2496-2503, 10.1016/j.matpr.2015.07.193.
[18]Bhattacharjee, P., Debnath, A., Chakraborty, S., and
Mandal, U. K., Selection of Optimal Aluminum Alloy Using Topsis Method Under Fuzzy Environment, Journal of Intelligent & Fuzzy Systems, Vol. 32, No, 1, 2017, pp. 871-876, 10.3233/JIFS-161049.
[19]Mousavi-Nasab, S. H., Sotoudeh-Anvari, A., A Comprehensive MCDM-based approach using TOPSIS, COPRAS and DEA as an Auxiliary Tool for Material Selection Problems, Materials & Design, Vol. 121, 2017, pp. 237-253, 10.1016/j.matdes.2017.02.041.
[20]Yazdani, M., Payam, A. F., A Comparative Study on Material Selection of Microelectromechanical Systems Electrostatic Actuators Using Ashby, VIKOR and TOPSIS, Materials & Design, Vol. 65, pp. 328-334, 10.1016/j.matdes.2014.09.004.
[21]Govindan, K., Shankar, K. M., and Kannan, D., Sustainable Material Selection for Construction Industry-A Hybrid Multi Criteria Decision Making Industry-Approach, Renewable and Sustainable Energy Reviews, Vol. 55, 2016, pp. 1274-1288, 10.1016/j.rser.2015.07.100.
[22]Elyasi, M., Khatir, F. A., and Hosseinzadeh, M., Manufacturing Metallic Bipolar Plate Fuel Cells Through Rubber PAD Forming Process, The International Journal of Advanced Manufacturing Technology, Vol. 89, No. (9-12), 2017, pp. 3257-3269, 10.1007/s00170-016-9297-6.
[23]Chu, J., Su, Y., The Application of TOPSIS Method in Selecting Fixed Seismic Shelter for Evacuation in Cities, Systems Engineering Procedia, Vol. 3, 2012, pp. 391-397, 10.1016/j.sepro.2011.10.061.
[24]Singh, T., Patnaik, A., Chauhan, R., and Chauhan, P., Selection of Brake Friction Materials Using Hybrid Analytical Hierarchy Process and Vise Kriterijumska Optimizacija Kompromisno Resenje Approach, Polymer Composites, Vol. 39, No. 5, 2018, pp. 1655-1662, 10.1002/pc.24113.
[25]Moradian, M., Modanloo, V., and Aghaiee, S., Comparative Analysis of Multi Criteria Decision Making Techniques for Material Selection of Brake Booster Valve Body, Journal of Traffic and Transportation Engineering (English Edition). DOI: 10.1016/j.jtte.2018.02.001.
[26]Biswas, P., Pramanik, S., and Giri, B. C., TOPSIS Method for Multi-Attribute Group Decision-Making Under Single-Valued Neutrosophic Environment, Neural computing and Applications, Vol. 27, No. 3, 2016, pp. 727-737, 10.1007/s00521-015-1891-2.
[27]Çalışkan, H., Kurşuncu, B., Kurbanoğlu, C., and Güven, Ş. Y., Material Selection for the Tool Holder Working Under Hard Milling Conditions Using Different Multi Criteria Decision Making Methods, Materials & Design, Vol. 45, 2013, pp. 473-479, 10.1016/j.matdes.2012.09.042.