1
Hatem A. Emara
CORRESPONDING AUTHOR
1
Hatem A.
Emara
Department of Physical Therapy for Growth and Developmental Disorders in Children and its Surgery,
Faculty of Physical Therapy, Cairo University, Egypt.
Int J Physiother. Vol 2(5), 751-758, October (2015) ISSN: 2348 - 8336
ABSTRACT
Background: The most critical feature of motor development is the ability to balance the body in sitting
or standing. Impaired balance limits a child’s ability to recover from unexpected threats to stability. The functional reach test (FRT) defines the maximal distance an individual is able to reach forward beyond arm’s length in a standing position without loss of balance, taking a step, or touching the wall. The Purpose of this study was to establish the normal values for FRT in Saudi Arabia school children with typical development and to study the correlation of anthropometric measures with FRT values.
Methods: This cross-sectional study was conducted in Almadinah Almonawarah, Kingdom of Saudi
Arabia. A total of 280 children without disabilities aged 6 to 12 years were randomly selected. Functional reach was assessed by having subjects extend their arms to 90 degrees and reach as far forward as they could without taking a step. Reach distance was recorded by noting the beginning and final position of the subject's extended arm parallel to a yard stick attached to the wall. Three successive trials of FRT were performed and the mean of the three trials was calculated. Pearson product moment correlation was used to examine the association of FR to age, and anthropometric measures.
Results: Normal mean values of FR ranged from 24.2cm to 33.95cm. Age, height and weight
significantly correlate with FRT.
Conclusion: The FRT is a feasible test to examine the balance of 6-12 year-old children. FRT may be
useful for detecting balance impairment, change in balance performance over time.
Keywords: Functional reach, Typical development, Balance.
DOI: 10.15621/ijphy/2015/v2i5/78230 Received 01st August 2015, revised 04th September 2015, accepted 08th September 2015
INTRODUCTION
Balance is the ability to maintain the line of gravity of a body inside the base of support with least postural sway. 1 In typical development, the growth
of postural stability proceeds in a cephalocaudal direction. An infant achieves head control first, then the trunk, and finally postural stability in standing. Postural stability increases and matures by 6 to 10 years of age. 2,3 In children, balance plays
a very important role in many activities, including playing, walking, reaching, and running in different environments such as school, home, and community. These activities involve both the static and dynamic components of balance. In early childhood, balance depends mainly on the visual-vestibular system, which slowly changes to dependence on the somatosensory-vestibular system. 4 However, adult-like responses require
more than 6 years to develop. 3 With age, balance
improves in children, which allows them to perform daily activities independently. The quality of reaching also improves, which depends on the adequacy of postural stability.5
Children with developmental disabilities, such as cerebral palsy and also children with sensory impairments like visual, proprioceptive, and vestibular deficits usually have problems in postural stability and balance .4,2,6 Such problems
cause serious functional consequences: for example, falls resulting in reduced mobility and increased disability and morbidity. 7 A child with
an impairment of postural stability is more dependent on a caregiver, and as age advances, the impairment may lead to severe participation restriction in the community.6
Different tests are used to examine static and dynamic balance for children, at different ages, with and without disabilities. Some of these tests are designed specifically to evaluate balance 8,9-16and other tests evaluate more generalized gross
motor functions that include balance components
.17-21
Posturography is a commonly used technique for evaluating postural stability. It is the quantitative measurement of postural sway by means of force platform. In clinical setting, without opportunity to use posturography , assessment of postural stability involves the use of some scales like The Movement Assessment Battery for Children– Second Edition (M-ABC-2), Bruininks Oseretsky Test of Motor Proficiency (BOTMP), Pediatric balance scale (PBS), Pediatric Clinical Test of Sensory Interaction for Balance (P-CTSIB), Tilt board tip tests, and a Pediatric reach test. 22
Functional reach is one of the components of pediatric balance scale. It is quantitative measurement tool and is portable, inexpensive, reliable, precise and gives a reasonable approximation of the margin of stability. Validity for measuring dynamic balance when compared to centre of pressure excursion (Pearson correlation coefficient = 0.71). Interrater, intrarater and test-retest reliability of the FRT has been reported to be 0.98, 0.83 and 0.75 respectively. FRT may be useful in detecting balance performance overtime and in the design of environmental modification.23
The FRT has been used to study dynamic balance in children.13,15,16 and is appropriate, functional
and reliable. Variability in the FRT has been reported. The coefficient of variability for children 5 to 10 years of age ranges from 20.8% to 61.9%, and coefficient of variability for adults 41 to 104 years old ranges from 9.6% to 11.6%. 15,24
Donohoe et al. 15 performed a reliability study and
a descriptive study on 116 children of 5 through 15years of age .Two experienced pediatric physical therapists collected the data. There were five age groups, in increments of 2 years, and the group sizes varied from 10 per group (13–15 years old) to 36 per group (7– 8 years old). The investigators reported that all subjects were able to successfully perform the FRT.
Bartlett et al. 13 developed a balance test, the
Pediatric Reach Test, for children developing typically, aged 3 to 12.5 years, and for children with a diagnosis of cerebral palsy, aged 2.6 to 14.1 years. Their study evaluated the validity and reliability of testing balance in forward and side reaching directions while sitting and standing. The researchers compared the reaching data with data on the limits of stability collected using a force platform. Although Bartlett et al. 13 did not compare their data with the FRT, the standing reach forward test in the Pediatric Reach Test is similar to the FRT. A general conclusion of their study was that the Pediatric Reach Test is a “simple, valid, and reliable measure that can be used with children.”
behaviors like balance problems. Adding to that, many of the Saudi Arabia schools, primary and secondary, do not have physical fitness for children. So, the purposes of this study were determine normative values and variability of the FRT scores and to examine the effect of age and anthropometric measures on the FRT scores in Saudi Arabia children from 6 to 12years old without disabilities.
METHODS
Subjects
A cross-sectional study was performed using a multistage stratified sampling method. Almadinah Almonawarah contains 112 governmental primary schools .Initially, a sample of 368 subjects within the age range of 6 to 12 years was selected from 4 schools of Almadinah Almonawarah city during the month of November 2014. Subjects were divided into 7 subgroups depending on age, that is, 6, 7, 8, 9, 10, 11, and 12 years. Subjects in the 6-year-old group included children between their sixth birthday and 1 day before their next birthday, and the other subjects were divided into similar age groups.
Results from the early childhood screenings were not available, so a medical questionnaire was completed by a parent or legal guardian. The inclusion criteria were: (1) Right-handedness, (2) normal proprioception, (3) normal coordination and (4) normal upper and lower limbs (Table 1). Children were excluded from the study if a parent or legal guardian reported they had (1) history of any previous ankle, knee, or hip injury that required medical attention, (2)history of any neurological problems, (3)visual disorders, (4) recent ear infections, and (5) height or weight below the 10th or above the 90th percentile for
gender and age (19) (Table 1).The researcher performed further screening for upper and lower extremity range of motion and muscle strength. Subjects with ranges of motion within normal limits and strength in the good range of manual muscle test were included in the study .After exclusion of children that didn’t meet the inclusion criteria the total number of subjects became304. Ethical clearance and approval to conduct the study was obtained from the College of Medical rehabilitation sciences Ethical Committee, Ministry of Education and School Health Unit in Al Madinah Almonawarah. Confidential letters were sent to parents of the study sample from researchers and school health unit explaining in detail the purpose of the study and asking for their signed consent.
Table1: Recruitment of study participants
Age (Years)
Initially recruited
Exclusion based on
Admit ted to study
Initial criteria
Failure to perform
FRT
6 72 17 5 50
7 63 16 4 43
8 58 7 3 48
9 47 8 3 36
10 45 7 4 34
11 43 5 3 35
12 40 4 2 34
Materials
Materials used in this investigation included:(a) an aluminium meter-stick to measure FR distance,(b) a bubble level to ensure the meter-stick was level,(c) a calibrated scale for measurement of body weight, and(d) a stadiometer to measure standing height. The same equipments were used at all data collection sites.
Procedure
The classes where the target population was present were selected by lottery. The subjects were selected on the basis of inclusion and exclusion criteria.
Anthropometric measures:
Data regarding age, height and weight were collected by fourth-year students of College of Medical Rehabilitatin sciences, physical therapy department and this was supervised by the staff of the department. Height was measured to the nearest 0.5cm using a stadiometer (Hadlands Photonics, Australia).Height is the maximum distance from the floor to the highest point of the head with the participant looking straight ahead .For measuring height, the participants were asked to stand straight with back, buttocks and heels against the stadiometer with feet together and flat on the floor . The participants were asked to take and hold a deep breath whilst looking straight ahead. Height was recorded at the end of the participants deep inward breath .Trunk length was measured from the C7 spinous process to the seat of the chair with the subject sitting upright on the chair.
neutral. Weight was recorded using the (Tanita HD-384 Digital Weight Scale). Participants were asked to stand on the centre of scale, without support and with their weight distributed evenly on both feet, the weight was recorded. The distance between the 2 acromion processes of the shoulders was taken as a reference for the base of support in the standing position (distance between the 2 parallel feet). 25-27
Functional reach testing protocol
Firstly, the children’s shoes and socks were removed; Secondly, a piece of masking tape was placed on the floor perpendicular to the wall and all children were instructed to align their toes behind the tape. Subjects stood perpendicular to the wall containing the levelled meter stick which was positioned at the height of the subject's acromion process.
To measure FR distance an initial measure was taken with the child’s arm raised horizontally (approximately 90°of shoulder flexion) using the placement of the third metacarpal along the meter-stick. A second measure was taken after reaching, again using the location of the third metacarpal along the meter-stick (Figure 1). The parameter measured was the distance the child reached while standing.
The distance was measured to the nearest 0.5 cm. A trial was considered successful if the FR was performed without the child stepping, touching the wall, or receiving assistance from the investigator.
Each child was allowed to perform 3 trials that were recorded and the mean was calculated. Brief rest periods of approximately 1 minutes were allowed. All subjects received the same verbal instructions and demonstrations. Twenty six children failed to complete the test and they were excluded from the statistical analysis and the total number of subjects became 280.
(a) (b)
Figure 1:
The functional reach test: (a) starting
position, (b) end position
Data Analysis
Data analysis was performed using SPSS for Windows; Version 15.0.Descriptive statistics were obtained for normal values of the FRT for all age groups. Pearson product moment correlation was used to examine associations between age, gender, height, weight length of the trunk, length of the upper extremity (UE), length of the lower extremity (LL) and base of support. Stepwise regression analyses were performed to assess the effect of various parameters on the FRT.
RESULTS
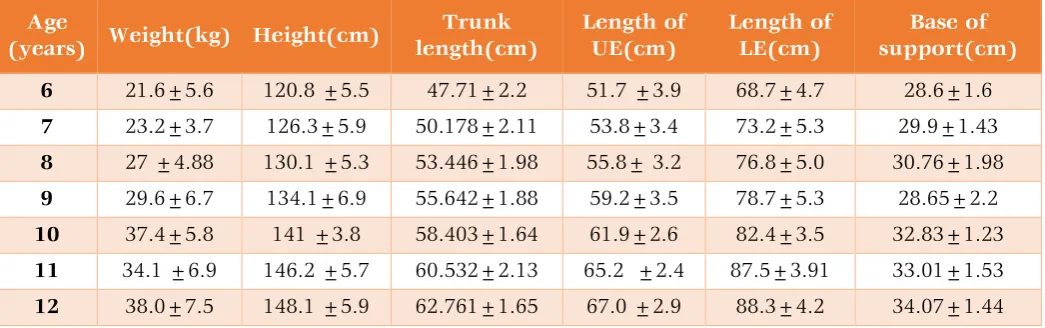
Anthropometric measures of subjects participating in this study are shown in Table 2
Table (2): anthropometric measures of participants
Age
(years) Weight(kg) Height(cm)
Trunk length(cm)
Length of UE(cm)
Length of LE(cm)
Base of support(cm)
6 21.6±5.6 120.8 ±5.5 47.71±2.2 51.7 ±3.9 68.7±4.7 28.6±1.6
7 23.2±3.7 126.3±5.9 50.178±2.11 53.8±3.4 73.2±5.3 29.9±1.43
8 27 ±4.88 130.1 ±5.3 53.446±1.98 55.8± 3.2 76.8±5.0 30.76±1.98
9 29.6±6.7 134.1±6.9 55.642±1.88 59.2±3.5 78.7±5.3 28.65±2.2
10 37.4±5.8 141 ±3.8 58.403±1.64 61.9±2.6 82.4±3.5 32.83±1.23
11 34.1 ±6.9 146.2 ±5.7 60.532±2.13 65.2 ±2.4 87.5±3.91 33.01±1.53
12 38.0±7.5 148.1 ±5.9 62.761±1.65 67.0 ±2.9 88.3±4.2 34.07±1.44
The means and standard deviations of the FR distances and their correlations with weight, height, trunk length, length of upper extremity,
Table3: The means and standard deviations of the FR distances and their correlations With anthropometric parameters
Age (year)
FRT
Mean±SD Weight(cm) Height(cm) Trunk length
(cm)
Length of U E (cm)
Length of L E (cm)
Base of support(cm)
r P r P r P r P r P r P
6 24.2±3.4 0.19 0.66 0.23 0.24 0.33 0.16 0.02 0.67 0.13 0.55 0.29 0.14
7 27.7±2.98 0.26 0.28 0.51 0.01* 0.36 0.06 0.56 0.001** 0.36 0.07 0.37 0.08
8 27.5±2.7 0.34 0.03* 0.19 0.25 0.38 0.03* 0.24 0.57 0.12 0.03* 0.37 0.04
9 31.1±4.2 0.61 0.00** 0.63 0.001** 0.61 0.04* 0.59 0.001** 0.59 0.001** 0.34 0.04*
10 31.98±5.1 0.51 0.01* 0.53 0.001** 0 .52 0.00** 0.32 0.23 -0.24 0.36 0.54 0.03*
11 31.99±3.0 0.23 0.69 0.29 0.27 0.35 0.03* 0.24 0.03* 0.44 0.01* 0.65 0.00**
12 33.95±3.8 0.24 0.01* 0.13 0.36 0.18 0.45 0.23 0.26 0.24 0.37 0.07 0.59
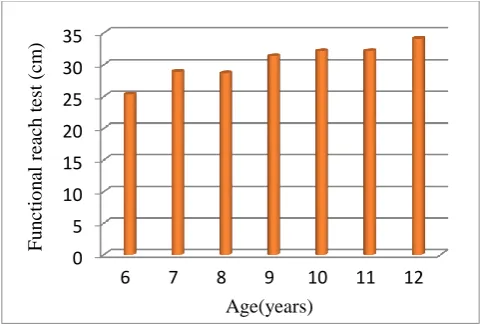
*:significant **:highly significant With reference to age, there was increase in FR
distance with age but at 8, 10, and 11years, the values were nearly similar (Figure 2). Concerning weight, The FR distance showed a highly significant correlation with weight for age 9 years and a significant correlation for age 10 years. For height, the FR distance showed a highly significant correlation with height for ages 9 and 10 years and a significant correlation for age 7 years only. For trunk length, the FR distance showed a highly significant correlation with trunk length for age 10 years and a significant correlation for age 9 years only. Regarding length of the upper extremity, the correlation between the FR distance and length of the upper extremity was a highly significant for ages 7 and 9 years only. Concerning length of the lower extremity, The FR distance showed a highly significant correlation for age 9 years and a significant correlation for age 11 years only. Concerning base of support, the FR distance showed a highly a significant correlation with base
of support for age 11 years and a significant correlation for ages 9 and 10 years(Figure2).
Figure 2: Comparison of mean values of FRT distance with age
Across the seven age groups, the significant predictors of FRT scores were age, weight and height (Table4)
Table4: Regression analysis to assess the effect of various parameters on functional reach test
Unstandardized Coefficients standardized Coefficients
B Std. Error Beta t p
Constant 9.148 2.435 6.718 0.001
Age 0.373 0.153 0.979 10.724 0.002
Weight 0.210 0.082 0.939 6.44 0.005
Height 0.121 0.033 0.970 8.927 0.003
Trunk length 0.051 1. 69 0.031 0.77 0.331
Length of UE -0. 45 0.98 -0.054 -0.44 0.648
Length of LE -0.037 0.057 -0.04 -0.357 0.633
Base of support 0.043 0.069 0.028 0.59 0.424
DISCUSSION
During recent years, the Kingdom of Saudi Arabia has witnessed a tremendous development at astounding rate. The standard of living rises and mechanization has been apparent in all aspects of
people’s life. As industrialization and modernization progress, a number of changes in physical activity are likely to occur. Indeed, physical inactivity and sedentary living with associated low level of physical fitness are
0 5 10 15 20 25 30 35
6 7 8 9 10 11 12
Fu
n
ctio
n
al
rea
ch
test
(
cm
)
increasingly becoming prevalent in Saudi society.
28In addition, with satellite television and increased
reliance on computer and telecommunication technology, further reduction in physical activity is projected in the coming years. The impact of these lifestyle changes on societal health is very considerable. Lack of physical activity is one of the common risk factors that lead to falls.29
Evaluation of the body balance is very important especially when it is related to the improvement of the individual's daily life activities. The earlier a balance disorder is detected the shorter the results of therapeutic intervention can be, avoiding problems of learning and socialization among others. The balance is an important evolutionary function that ends up being an indicator of neurological maturity, where children with immaturity of this function have more chances of experiencing learning difficulties, with interference on school issues.30
The results of our study demonstrated that the normal mean values for the FRT ranged from 24.2cm to 33.95cm. The values of FRT in a study conducted by Donahoe et al.15 on a similar age
group in United States ranged from 21.17 cm to 32.79 cm. When these values were compared with the results of our study, it was found that FRT values for the 6-year-old age group in the present study showed slightly higher mean values, but the mean difference was greater in the 12-year-old age group. This result canbe attributed to differences in growthamong differentraces.
In general, our results demonstrated that there is increase in functional reach test scores with age especially from 6 to 9 years. This comes in agreement with Shumway31 who stated that
standing balance control in children, measured as sway performance, differs from sway performance in adults. Body size proportions in children and adults differ, and the “top-heaviness of children results in a relatively higher centre of mass location. Along with the fact that children’s movements have not yet fully matured, the result is different sway performances in younger children (below the age of 10) and adults, in terms of both amplitude and velocity of sway (temporal, spatial and continuous refinements of postural strategies).31,32
The refinement of postural control strategy continues beyond 10 years of age, probably until young adult age. Also our results come in agreement with Donahoe et al.15 who found that
38% of the variance in functional reach was affected primarily by age alone, and the addition of
other variables of weight, gender, and arm length did not significantly explain more variance in FRT. Also, the results of the current study found that height was an important factor affecting FRT values in most of the age groups. Our results come in agreement with other researchers who have significantly correlated subject characteristics such as age and height with FRT scores in typical development children. Habib et al. 16 studied FRT
in Pakistani children and found that age accounted for 17% of variance in scores and that height, weight, and base of support (BOS) also accounted for an additional 15% of variance.
Results showed that weight contributed to significant change in FRT which agree with the findings of Norris et al. 33According to their study,
the only significant predictor of FRT distance was weight, which accounted for 34% of the variance in FRT results. The base of support showed a correlation with FRT results at 9,10 and 11 years, which was in accord with the findings by Volkman et al. 34wherein they found that FRT values were
affected by base of support in children aged 8 to 10 years. In the present study, the base of support was defined as shoulder width, that is, the distance between the 2 acromion processes.Variation in shoulder width could be expected with body growth. In humans, growth is cephalocaudal in direction, that is, head, neck, arms, trunk, and legs, and as age increases, the height and the width of trunk also increase. 35 Hence, it could be concluded
that shoulder width will also increase with age, and so would the base of support. The correlation of base of support with FRT results may be due to the occurrence of growth in children aged 8 to 10 years. It could be concluded that subjects using a self-selected base of support while performing the FRT will affect reach values.
Limitations and future research:
This study included boys only, there is a need for future studies to look into differences in FRT scores between genders. Children who participated in the study lived in Al-Madinah so normal values of FRT obtained in the present study may not be generalized to all Saudi Arabia Children. Another limitation is that the medical history used was subjectively reported. This may have lead to falsification of information.
ACKNOWLEDGEMENTS
The author expresses his thanks to all children and parents for their confidence and collaboration in this study.
DECLARATIONS
Funding: No funding sources Conflict of interest: None declared
REFERENCES
1. Shumway-Cook A, Anson D, Haller S.Postural sway biofeedback: its effect on reestablishing stance stability in hemiplegic patients. Arch Phys Med Rehabil 1988; 69 (6): 395-400.
2. Robinson MW, Krebs DE, Giorgetti MM. Functional reach: does it really measure dynamic balance? Arch Phys Med Rehabil 1999;80:262-269.
3. An M, Yi CW, Jeon H, Park S. Age-related changes of single-limb standing balance in children with and without deafness. Int J Paediatr Otorhinol2009;73:1539-1544.
4. Westcott SL, Lowes LP, Richardson PK. Evaluation of postural stability in children: current theories and assessment tools. Phys Ther1997;77:629-645.
5. Van der heide JC, Fock JM, Otten B, Stremmelaar E, Hadders-algra M. Kinematic characteristics of postural control during reaching in preterm children with cerebral palsy. Pediatr Res2005;58:586-593.
6. Franjoine MR, Gunther JS, Taylor MJ. Pediatric balance scale: amodified version of the berg balance scale for the school-age child with mild to moderate motor impairment. Pediatr Phys Ther.2003;15:114-128.
7. Benvenuti F, Mecacci R, Gineprari I, et al. Kinematic characteristicsof standing disequilibrium: reliability and validity of a posturographic protocol. Arch Phys Med Rehabil.1999;80:278-287.
8. Atwater S, Crowe T, Deitz J, et al. Interrater and test–retest reliability of two pediatric balance tests.Phys Ther.1990;70:79–87.
9. Casselbrant M, Furman J, Mandel E,et al. Past history of otitis media and balance in four-year-old children.Laryngoscope.2000;110:773–778. 10.Niznik T, Turner D, Worrell T. Functional
reach as a measurement of balance for children with lower extremity spasticity. Phys Occup Ther Pediatr 1995;15:1–15.
11.Pellegrino T, Buelow B, Krause M, et al. Test– retest reliability of thepediatric clinical test of sensory interactions for balance and the functional reach test in children with standing balance dysfunction. Pediatr Phys Ther 1995;7:197.
12.Richardson P, Atwater S, Crowe T, et al. Performance of preschoolers on the pediatric clinical test of sensory interaction for balance. Am J Occup Ther 1992;46:793–800.
13.Bartlett D, Birmingham T. Validity and reliability of the pediatric reach test.Pediatr Phys Ther 2003;15:84–92.
14.Franjoine M, Gunther J, Taylor M. Pediatric balance scale: a modified version of the Berg Balance Scale for the school-age child with mild to moderate motor impairments.Pediatr Phys Ther 2003;15:114–28.
15.Donohoe B, Turner D, Worrell T. The use of functional reach as ameasurement of balance in boys and girls without disabilities ages 5to 15 years.Pediatr Phys Ther 1994;6:189–193. 16.Habib Z, Westcott S. Assessment of
anthropometric factors on bal-ance tests in children. Pediatr Phys Ther1998;10:101–109. 17.Zaino C, Marchese V, Westcott S. Timed up and
down stairs test:preliminary reliability and validity of a new measure of functional mobility.Pediatr Phys Ther 2004;16:90–98. 18.Palisano R, Hanna S, Rosenbaum P, et al.
Validation of a model ofgross motor function for children with cerebral palsy.Phys Ther 2000;80:974–985.
19.Williams E, Carroll S, Reddihough D, et al. Investigation of the timed ‘Up and Go’ test in children. Dev Med Child Neurol 2005;47:518– 24.
20.Bruininks R, Bruininks D.(BOT-2)Bruininks-Oseretsky test of motor proficiency. 2nd ed. Bloomington, MN: AGS Publishing; 2005. 21.Folio M, Fewell R. Peabody Development
Motor Scales Manual.Allen,TX: DLM Teaching Resource; 1983.
22.Alexandra De Kegel, Inge Dhooge, Wim Peersman. Construct validity of assessment of balance in Children Who Are Developing Typically and in Children With Hearing Impairments. Phys Ther 2010; 90:1783-1794. 23.Duncan PW, Weiner DK, Chandler J, Studenski
S. Functional reach: a new clinical measure of balance. J Gerontol 1990;45: M192-7.
24.Rosemary A. Norris, Elaine Wilder, Jennifer Norton. The Functional reach test in 3 to 5 years old children without disabilities. Pediatric physical therapy 2008;20:47-52.
25.Nelson W.Nelson Textbook of Pediatrics.15th ed. Philadelphia, PA:WB Saunders Co.; 1996. Liao CF, Lin SI. Effects of different movement strategies on forward reach distance. Gait Posture2008;28:16-23.
reach and 2-arm reach. Arch Phys Med Rehabil 2009;90:2103-2107.
27.Kage H, Okuda M, Nakamura I, Kunitsugu I, Sugiyama S, Hobara T. Comparison of the one-arm and two-one-arm Functional reach test in young adults. J Phys Ther Sci2009;21:207-212. 28.Al-Hazzaa H. Patterns of physical activity
among Saudi children, adolescents and adults with special reference to health. In: Musaiger A, Miladi S, editors. Nutrition and Physical Activity in the Arab Countries of the Near East.Manama: BCSR 2000: 109-127.
29.Aging and Long-Term Support Administration. Retrieved from https://www.dshs.wa.gov/ altsa/ home-and-community-services/falls-prevention.14May2015.
30.Guardiola A, Ferreira LTC, Rotta NT. Associação entre desempenho das funções corticais e alfabetização em uma amostra de escolares de primeira série de Porto Alegre. Arq Neuropsiquiatr 1998;56(2):281-8.
31.Shumway-Cook A.Motor Control. Translating research into clinical practice.Motor Control. Translating Research into Clinical Practice.3rd
ed. Baltimore, USA: Lippinicott Williams & Wilkins; 2007.
32.Wu J, McKay S, Angulo-Barroso R.Center of mass control and multi-segment coordination in children during quiet stance.Exp Brain Res 2009;196(3):329–39.
33.Norris, Rosemary A., Elaine Wilder, and Jennifer Norton. "The functional reach test in 3-to 5-year-old Children without disabilities." Pediatric Physical Therapy 2008;20(1): 47-52. 34.Volkman K, Stergiou N, Stuberg W, Blanke D,
Stoner J. Factors affecting functional reach scores in youth with typical development. Pediatr Phys Ther2009;21:38-44.
35.Ledin T, Fransson PA, MagnussonM. Effects of postural disturbances with fatigued triceps surae muscles or with 20% additional body weight. Gait Posture2004;19:184-193.
Citation