Http://www.ijetmr.com©International Journal of Engineering Technologies and Management Research [101]
STOCK RETURN ANALYSIS AND IMPLICATIONS IN COMPANY
VALUE (PLASTIC AND PACKAGING COMPANIES LISTED IN IDX)
Andrie Raditya Julianto 1, Afriapollo Syafarudin 1
1 MercuBuana University, Jakarta, Indonesia
Abstract:
This study aims to analyze fundamental factors and technical factors that influence stock returns and their implications for company value in Indonesia Stock Exchange, sub sector plastic and packaging. Fundamental factors of financial ratios are return on assets (ROA), current ratio (CR), debt to equity ratio (DER), and price earnings ratio (PER) while the technical factors are the rupiah exchange rate using changes in value exchange rupiah (RP) against United States dollar (USD). This study used annual data for the observation period from 2010 to 2017. The sampling method used was Purposive Sampling, as the result 8 companies (64 samples) met the criteria and processed using E-views 9 program. The analytical method used in this study is panel data and multiple linear regression as a method of analysis and measurement of direct effect and indirect effect analysis. The results showed that ROA, CR, DER, and PER are having positive and insignificant influence on stock returns however the exchange rate has negative and significant influence on stock returns. ROA, DER, and PER are having positive and insignificant influence on company value however CR and exchange rates have a negative and insignificant effect on company value. Stock returns has positive and significant influence on company value. The examination of indirect effects showed stock return could be considered as an intervening variable to measure the influence of fundamental factors and technical factors to company value.
Keywords: Company Value; Stock Return; Internal Influence; External Influence; Financial Ratio.
Cite This Article: Andrie Raditya Julianto, and Afriapollo Syafarudin. (2019). “STOCK
RETURN ANALYSIS AND IMPLICATIONS IN COMPANY VALUE (PLASTIC AND
PACKAGING COMPANIES LISTED IN IDX).” International Journal of
Engineering Technologies and Management Research, 6(7), 101-118.
1. Introduction
Http://www.ijetmr.com©International Journal of Engineering Technologies and Management Research [102] Increased production of plastic raw materials (upstream petrochemicals) such as olefins is being sought. In total, the imported plastic raw materials reached US $ 17.6 billion in 2015. Plastic raw materials include Polyethylene (PE) resins, Polypropylene (PP) resins, Polyvinyl Chloride (PVC) resins, Polystyrene (PS) resins, SAN resin, ABS resin and PET. Although the consumption of plastic raw materials tends to increase, but until now, to meet the consumption of plastic raw materials domestically, some of them are still dependent on imports. Raw material consumption in Indonesia has increased but has not been able to be met in its entirety. Based on BPS records, in 2012, the total import value of olefin products from two polyolefin products for plastic raw materials, namely polypropylene (PP) resin and PE resin reached US $ 3.65 billion. Imports of polypropylene raw materials reached 484,000 tons out of a total requirement of 976,000 tons, naphtha imports amounted to 1.6 million tons and imports of condensate at 33 million barrels. There are no other raw materials for environmentally friendly plastics (bioplastics) and commercially produced. Most natural ingredients are still being developed during the product research and development stage. The capital invested by investors in the plantation industry is very large but the stock returns obtained are very fluctuating so it needs to be analyzed how much influence the production volume and CPO prices have on profitability and the impact on stock returns, especially capital gains, according to the purpose of this study.
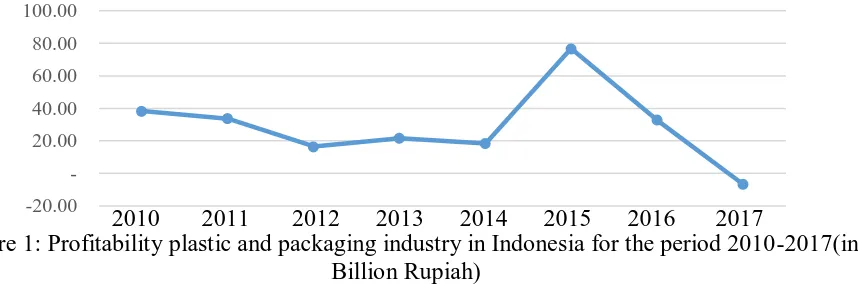
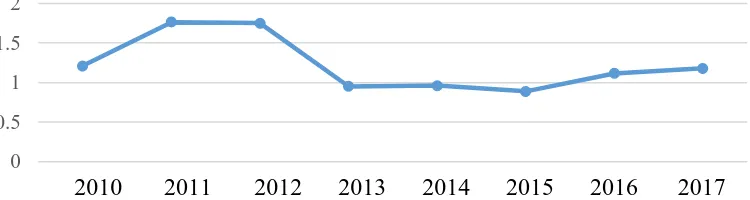
During the 2010-2017 period the average of profit in the financial report of each companies fluctuated with a downward trend, as shown in Figure 1. Meanwhile, the average of stock return and the average of company value in terms by price to book value (PBV) ratio fluctuated with an upward trend, as shown in Figure 2 and Figure 3.
Figure 1: Profitability plastic and packaging industry in Indonesia for the period 2010-2017(in Billion Rupiah)
Source: Financial Report each industry that listed in IDX
Figure 2: Average stock return plastic and packaging industry in Indonesia for the Period2010-2017
Source: processed by researcher from IDX data base -20.00
20.00 40.00 60.00 80.00 100.00
2010 2011 2012 2013 2014 2015 2016 2017
-0.5 0 0.5 1
Http://www.ijetmr.com©International Journal of Engineering Technologies and Management Research [103] Figure 3: Average PBV plastic and packaging industry in Indonesia for the period 2010-2017 Source: processed by researcher from IDX data base
Based on Figures 1, 2 and 3, it can be concluded that the stock return and company value underwent an upward trending, meanwhile company profit as one of a factor for predict the stock return and company value underwent a downward trending. It is therefore necessary to analyze other factors that affect the stock return and company value. As indicated, industrial performance is affected by external and internal factors. This study aimed to examine the influence of internal factors (profitability, liquidity, solvency and market value) and external factors (exchange rate) on stock return and its implication in company value.
Company Value
One indicator that can be used to measure company value is Price to Book Value (PBV) (Weston and Copeland, 2010). This ratio illustrates how much the market appreciates the book value of a company's stock. The higher PBV means the market believes in the prospect of the company. Price to Book Value (PBV) which is one of the variables considered by an investor in determining which shares to buy. For companies that are running well, generally this ratio reaches above one, which indicates that the stock market value is greater than the book value. The greater the PBV ratio the higher the company is valued by investors, relative to the funds invested in the company (Tandelilin, 2010).
Stock Return
Stock Return is the result of profits (capital gains) or losses (capital loss) obtained from the investment or stock trading in a certain period of time. According to Tandelilin (2010), stock return is one of the factors that motivate investors to invest and is also a reward for the courage of investors to bear the risk of the investment they make. For company management, stock returns are an investor's reaction to the company's performance, especially on financial performance. By using ratio analysis of financial statements will be able to explain or provide an overview of the good or bad state or financial performance of a company. One of the objectives of conducting financial ratio analysis is to be able to help companies identify the company's financial strengths and weaknesses, assess the performance of the company's financial statements in empowering all existing resources to achieve the targets set by the company (Sujarweni, 2017).
Financial Performance
Company performance is an illustration of the financial condition of a company that is analyzed by financial analysis tools, so that it can be known about the good or bad financial condition of a company that reflects work performance in a certain period. This is very important so that resources are used optimally in the face of environmental changes (Fahmi, 2011). Information
0 0.5 1 1.5 2
Http://www.ijetmr.com©International Journal of Engineering Technologies and Management Research [104] about the company's financial performance can be used for investors to see whether they will maintain their investment in the company or look for other alternatives. If the company's performance is good, the business value will be high. With a high business value, investors look at the company to invest so that there will be an increase in stock prices. Or it can be said that stock prices are a function of company value.
Exchange Rate
Exchange rate is the price of a country's currency relative to another country's currency, where the exchange rate balance is determined by the supply and demand side of the two currencies. Whereas according to (Fabozzi and Modigliani, 1992) exchange rates are defined as the sum of a currency that can be exchanged per unit of another currency, or the price of a currency based on another currency. This currency exchange rate can be used as a tool in the trade of goods and services between regions, the movement of capital and credit. In practice, the exchange rate can be expressed in two ways, namely the domestic currency per foreign currency or vice versa. But in general the exchange rate is more likely to be expressed in domestic currency per foreign currency, such as RP / USD. Strengthening of the exchange rate of a currency is commonly referred to as appreciation, which is characterized by a decrease in the amount of domestic currency in exchange for the same amount of foreign currency. While the weakening of the exchange rate is commonly referred to as currency depreciation.
Framework and Research Hypothesis
This study discusses to analyze the influence of company internal factors or financial performance represented by profitability proxies by return on assets (ROA) ratio, liquidity is proxies by current ratio (CR), solvency is proxies by debt to equity ratio (DER) and its market value is proxies by price earnings ratio (PER), and external factor is represented by exchange rates. The relationship between the independent variables and the dependent variable of this study is in Figure 4According to the Shintya study (2014) the growth of production or sales partially has a positive and significant effect on profitability. Badjra (2015), company growth (sales) has a negative and not significant effect on profitability. Pancawati and Indahsari (2016), selling prices do not have a significant effect on profitability. Juliyanti (2015), shows the variable operational costs, selling prices, and sales volumes simultaneously have a significant effect on profitability. Rio (2016), ROA has a positive and insignificant effect on stock returns.
Http://www.ijetmr.com©International Journal of Engineering Technologies and Management Research [105] Based on the background information, problem statement and framework, the hypothesis used in this study are:
H1: Returns on asset (ROA) has a positive effect on stock return
H2: Current ratio (CR) has a positive effect on stock return
H3: Debt to equity ratio (DER) has a positive effect on stock return
H4: Price earnings ratio (PER) has a positive effect on stock return
H5: Exchange rate has a negative effect on stock return
H6: Returns on assets (ROA) have a positive effect on company value (PBV)
H7: Current ratio (CR) has a positive effect on company value (PBV)
H8: Debt to equity ratio (DER) has a positive effect on company value (PBV)
H9: Price earnings ratio (PER) has a positive effect on company value (PBV)
H10: Exchange rate has a negative effect on company value (PBV) H11: Stock return has a positive effect on company value (PBV)
2. Materials and Methods
Research Design
The design used is descriptive quantitative research and causality. Causality research aims to analyze the influence of independent variables: internal factors (ROA, CR, DER, PER); and external factors (exchange rates); on the dependent variable company value with stock returns as an intervening variable.
Population and Samples
The population in this study was 14 companies in the Plastic and Packaging Sub-Sector listed on the Indonesia Stock Exchange (IDX) during the period 2010-2017. The purposive sampling technique was used with certain criteria. The outcome (sample size) was 8 companies that met the criteria.
Types and Data Collection
The type of data used in this study was quantitative secondary data obtained from the Indonesia Stock Exchange (IDX). The techniques of collecting data were documentation or archive techniques. Research data was presented in a panel (time series and cross section).
Data Analysis Method
Data analysis was performed through descriptive statistical tests, followed by model testing, the classic assumption tests (multicollinearity and heteroscedasticity). Other tests performed were multiple linear regression analysis, the significance of the coefficient of determination R test, simultaneous test (F test), partial test (T test).
Model Testing
Http://www.ijetmr.com©International Journal of Engineering Technologies and Management Research [106] The Classic Asumption Test
The classic assumption tests used in this study were multicollinearity test and heteroscedasticity test . Multicollinearity test checked whether there is a disturbance on data caused due to the relationships among the independent variables. Heteroscedasticity test checked whether there is a regression disturbances whose variances were not constant across observations.
Regression Analysis
Since this study was designed to examine the influence of independent variables on the dependent variable, an analysis model with the least squares equation was used with three equation as follows :
Equation 1 Y = a + b1X1 + b2X2 + b3X3 + b4X4 + b5X5 + e
Equation 2 Z = a + b1X1 + b2X2 + b3X3 + b4X4 + b5X5 + e
Equation 3 Z = a + b1Y1 + e
Y : Stock Return (RETURN)
Z : Company Value (PBV)
a : Constanta
b1-5 : Coefficient Regression
X1 : Return on asset (ROA)
X2 : Current ratio (CR)
X3 : Debt to equity ratio (DER)
X4 : Price earning ratio (PER)
X5 : Exchange rate (KURS)
e : Error
Determination Coefficient
Test Determination Coefficient Test is used to find out the amount of variation in the dependent
variable as a result of the variation of independent variables as seen from the R-square value (R²). The coefficient of determination is between zero (0) and one (1). A small value of R² suggests the ability of independent variables to explain variations in the dependent variable is very limited. A value close to 1 suggests that independent variables provide almost all information needed to predict variations in dependent variable. In general, the coefficient of determination for cross data is relatively low because of the large variation between each observation, while time series data usually has a high coefficient of determination.
Restricted F Test (F Test)
The F test is used to determine a simultaneous influence of independent variables to dependent variable. The criteria to arrive at such a decision are : if the value of F statistic is more than the value of F table, it suggests that there is an influence of independent variables to dependent variable simultaneously. Adversely, if the value of F statistic is less than the value of F Table, it suggests that there is no influence of an independent variables on dependent variable simultaneously.
T Test
Http://www.ijetmr.com©International Journal of Engineering Technologies and Management Research [107] variables to dependent variable partially; similarly, if the value of T statistic is less than the T Table (for negative number) it also suggests that there is an influence of independent variables on dependent variable partially. Adversely, if the value of T statistic is less than the value of T Table (for positive number), it will suggest that there is an influence of independent variables to dependent variable partially but if the value of T statistic is more than the value of T Table (for negative number), it will suggest that there is no influence of independent variables on dependent variable partially.
Path Analysis
Path diagrams can be used to calculate the direct and indirect effects of independent variables on a dependent variable. These influences are reflected in what is called the path coefficient, where mathematically path analysis follows structural mode.
3. Results and Discussions
The results of descriptive statistical calculations describe the mean, median, maximum, minimum and standard deviation of independent and dependent variables. The results are shown in Table 1.
Table 1: Descriptive Statistics
No Variable Mean Median Maximum Minimum Standard Deviation
1 PBV 1,22689 0,64914 6,15534 0,22071 1,72507
2 RETURN 0,20992 0,03202 1,73171 -0,74294 0,52176
3 ROA 0,03587 0,01868 0,24175 -0,08682 0,06176
4 CR 1,72153 1,22663 7,04181 0,74220 1,44798
5 DER 0,98600 0,90874 2,74803 0,16080 0,59407
6 PER 7,14931 11,69514 70,86153 -114,80050 30,67855
7 KURS 0,04109 0,01163 0,20492 -0,04444 0,07594
Source: data processed 2019 by e-views 9
Return on Asset (ROA) has an average value for the plastic and packaging sub-sector of 0.03587 or 3.587%, which means that the average return mean is 3.587% of the utilization of total assets. The highest ROA achieved was 0.24175 or 24.155%, which means that the utilization of all assets can generate returns of 24.155% of total assets. The lowest ROA occurred amounted to -0.08682 or -8.682%, this means that the utilization of all assets did not produce profits but losses of 8.682% of total assets. The middle position of the ROA is at 0.01868 or 1.868%. The standard deviation of ROA was 6.176%, which indicates that profitability had a small distribution.
Http://www.ijetmr.com©International Journal of Engineering Technologies and Management Research [108] current assets cannot cover current debt. The standard deviation of CR was 144.8%, which indicates that liquidity had a large distribution.
Debt to Equity Ratio (DER) has an average value for the plastic and packaging sub-sector of 0.98600 means that the average total debt to own capital is 0.986 or in other words the total debt of Rp. 0.986 is guaranteed with capital of Rp. 1.00. The highest DER is 2.74803, meaning that for every Rp. 2.74803 debt is secured by Rp. 1.00 capital. More corporate operations are funded by using debt. The lowest DER of 0.16079 means that for every Rp. 0.16079 debt is guaranteed to use capital of Rp. 1.00 in other words, the company's operations use capital more than debt. The position of the middle of the DER is at the number 0.90874. The standard deviation of CR was 59.4%, which indicates that solvency had a large distribution.
Price Earning Ratio (PER) has an average value for the plastic and packaging sub-sector is 7.14931 which means that investors are willing to pay Rp. 7.14931 for every Rp. 1.00 of the company's income through the sale of shares. The highest PER is 70.86153, meaning that for every Rp. 1.00 share income, investors are willing to pay Rp. 70.86153. The higher the PER ratio shows that the market is willing to pay more to the income or profit of a company, and has high expectations for the future of the company so that it is willing to appreciate it at a higher price. The lowest PER is -114,8005, because the company has a loss or negative income. For companies that experience negative losses or income, the P / E (PER) ratio is usually stated as "non-existent" or usually written with "N/A" or "Not Applicable". The position of the middle PER value is at 11.69514. The standard deviation of PER was 144.8%, which indicates that liquidity had a large distribution.
Exchange Rate has an average change in the exchange rate of the rupiah against the US dollar is 0.04109 or 4.109%, which means that each year the rupiah exchange rate against the US dollar has increased by 4.109%, with the highest change of 20.5% in 2013 and changes in exchange rates the lowest rupiah -4.4% in 2010. The standard deviation of exchange rate was 7.6%, which indicates that exchange rate had a small distribution.
Stock Return has an average value in the plastic and packaging sector is 0.20992 or 20.992%, which means that the average change in stock prices in the plastic and packaging sector has increased by 20.992%. The highest stock return is 173,171%, which means the value of the company's shares has increased by 173,171% from the previous year's stock value. The lowest stock return is -74.294%, which means that the value of the company's shares has decreased by 74.294% from the value of the previous year. The middle value of stock returns is at the position of 0.03202 or 3.2%. The standard deviation of stock return was 52.17%, which indicates that stock return had a large distribution.
Http://www.ijetmr.com©International Journal of Engineering Technologies and Management Research [109] PBV is at position 0.64914. The standard deviation of PBV was 172.5%, which indicates that company value had a large distribution.
This study is to examine the effect of ROA, CR, DER, PER and exchange rate by statistical testing in order to find out the five variables on stock return and their impact on company value for the period 2010-2017. During this period, there was 8 companies that were included in the category.
Table 2: Result of Equation 1 Data Regression Analysis
Chow Test Cross Section F Result
0,861452 Common Effect
Lagrange Multiplier Test
Prob. Breusch-Pagan Result
0,2727 Common Effect
Heteroscedasticity Test
Prob. Chi Square Result
0,3644 Not Occur
Variable Coefficient t-Statistic Prob. Multicollinearity Test
Centered VIF
Result
C 0,154670 0,875740 2,672222 NA NA
ROA 1,449973 1,145084 1,784028 2,039082 Multicoll. Free
CR 0,052566 0,920073 2,509028 2,281677 Multicoll. Free
DER 0,056438 0,491787 4,338194 1,549631 Multicoll. Free
PER 0,001150 0,596278 3,842361 1,167240 Multicoll. Free
KURS -3,677810 -4,811375 0,000000 1,123508 Multicoll. Free
F-Test F-Statistic Prob. Conclusion
6,552756 0,000068 Significant
Determination Coeff (R-Squared) 0,360979
Based on the table above, the following is an explanation of the research equation :
1) Based on the Chow Test, the value of F statistic was 0,861452 less than the value of F Chow Table was 2,386, so the preferred model was The Common Effect Model.
2) Based on the Lagrange Test, the value of Chi Square statistic was 0,2727 less than the value of Chi Square Table was 11,070, so the preferred model was Common Effect Model.
3) Based on the Multicollinearity Test, the values of Centered VIF for the five independent
variables were less than 10, It meant that there was no multicollinearity.
4) Based on the Heterocedasticity Test, the value of Prob chi-squared equal 0,3644
(36,44%) more than 0,05 (5%). It meant that there was no heteroscedasticity.
5) The Constant value (c) of 0,154670means that if the variables in this study are ROA, CR,
DER, PER and KURS worth 0, then Stock Return (Y) is obtained at 0,154670
6) The variable ROA regression coefficient value obtained at 1,449973.Positive value
Http://www.ijetmr.com©International Journal of Engineering Technologies and Management Research [110]
7) The variable CR regression coefficient value obtained at 0,052566. Positive value means
that every increase in CR is 1 unit, it will increase Stock Return by 0,052566 units, assuming other independent variables remain.
8) The variable DER regression coefficient value obtained at 0,056438.Positive value means
that every increase in DER is 1 unit, it will increase Stock Return by 0,056438 units, assuming other independent variables remain.
9) The variable PER regression coefficient value obtained at 0,001150.Positive value means
that every increase in PER is equal to 1 unit, it will increase Stock Return by 0,001150 units, assuming other independent variables remain.
10) The variable KURS regression coefficient value obtained at -3,677810.Negative value means that every increase in KURS is 1 unit, it will decrease Stock Return by 3,677810 units, assuming another independent variable remains.
11) Based on the F test, it is known that the F-Statistic value is 6,552756with a significant level of 0,000068. This shows that ROA, CR, DER, PER and Exchange Rate simultaneously influence Stock Return.
12) The determination coefficient is 0,360979. This shows the ROA, CR, DER, PER and Exchange Rate variables simultaneously able to provide an explanation on the Stock Return variable of 36.0979% while the remaining 63,9021% is explained by other factors not examined in this study.
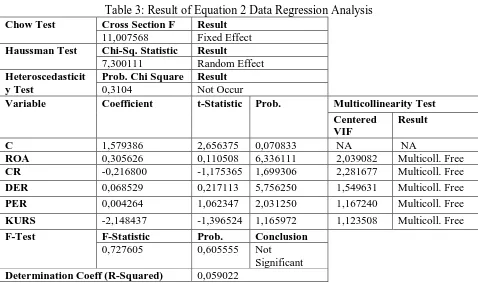
Table 3: Result of Equation 2 Data Regression Analysis
Chow Test Cross Section F Result
11,007568 Fixed Effect
Haussman Test Chi-Sq. Statistic Result
7,300111 Random Effect
Heteroscedasticit y Test
Prob. Chi Square Result
0,3104 Not Occur
Variable Coefficient t-Statistic Prob. Multicollinearity Test
Centered VIF
Result
C 1,579386 2,656375 0,070833 NA NA
ROA 0,305626 0,110508 6,336111 2,039082 Multicoll. Free
CR -0,216800 -1,175365 1,699306 2,281677 Multicoll. Free
DER 0,068529 0,217113 5,756250 1,549631 Multicoll. Free
PER 0,004264 1,062347 2,031250 1,167240 Multicoll. Free
KURS -2,148437 -1,396524 1,165972 1,123508 Multicoll. Free
F-Test F-Statistic Prob. Conclusion
0,727605 0,605555 Not
Significant
Determination Coeff (R-Squared) 0,059022
Based on the table above, the following is an explanation of the research equation :
1) Based on the Chow Test, the value of F statistic was 11.007568more than the value of F
Http://www.ijetmr.com©International Journal of Engineering Technologies and Management Research [111]
2) Based on the Haussman Test, the value of Chi Square statistic was 7.300111 less than the
value of Chi Square Table was 11.070, so the preferred model was Random Effect Model.
3) Based on the Multicollinearity Test, the values of Centered VIF for the five independent
variables were less than 10, It meant that there was no multicollinearity.
4) Based on the Heterocedasticity Test, the value of Prob chi-squared equal to 0.3104 (31,04%) more than 0,05 (5%). It meant that there was no heteroscedasticity.
5) The Constant value (c) of 1,579386means that if the variables in this study are ROA, CR,
DER, PER and KURS worth 0, then Company Value (Y) is obtained at 1,579386.
6) The variable ROA regression coefficient value obtained at0,305626.Positive value means
that every increase in ROA of 1 unit, it will increase Company Value by 0,305626 units, assuming other independent variables remain.
7) The variable CR regression coefficient value obtained at-0,2168. Negative value means that every increase in CR is 1 unit, it will decrease Company Value by 0,2186 units, assuming other independent variables remain.
8) The variable DER regression coefficient value obtained at 0,068529.Positive value means
that every increase in DER is 1 unit, it will increase Company Value by 0,068529 units, assuming other independent variables remain.
9) The variable PER regression coefficient value obtained at 0,004264.Positive value means
that every increase in PER is equal to 1 unit, it will increase Company Value by 0,004264 units, assuming other independent variables remain.
10) The variable KURS regression coefficient value obtained at -2,148437.Negative value means that every increase in KURS is 1 unit, it will decreaseCompany Value by 2,148437 units, assuming another independent variable remains.
11) Based on the F test, it is known that the F-Statistic value is 0,727605with a significant level of 0,605555. This shows that ROA, CR, DER, PER and Exchange Rate simultaneously not significant influencedCompany Value.
12) The determination coefficient is 0,059022. This shows the ROA, CR, DER, PER and Exchange Rate variables simultaneously able to provide an explanation on the Company Value variable of 5,9022% while the remaining 94,0978% is explained by other factors not examined in this study.
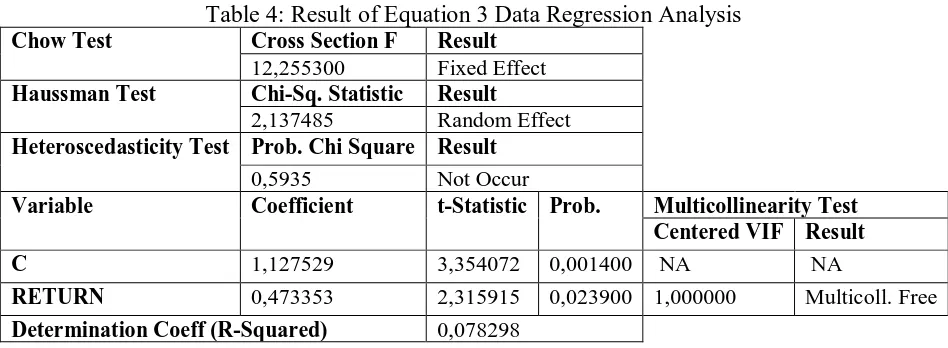
Table 4: Result of Equation 3 Data Regression Analysis
Chow Test Cross Section F Result
12,255300 Fixed Effect
Haussman Test Chi-Sq. Statistic Result
2,137485 Random Effect
Heteroscedasticity Test Prob. Chi Square Result
0,5935 Not Occur
Variable Coefficient t-Statistic Prob. Multicollinearity Test
Centered VIF Result
C 1,127529 3,354072 0,001400 NA NA
RETURN 0,473353 2,315915 0,023900 1,000000 Multicoll. Free
Http://www.ijetmr.com©International Journal of Engineering Technologies and Management Research [112] Based on the table above, the following is an explanation of the research equation :
1) Based on the Chow Test, the value of F statistic was 12,2553more than the value of F Chow Table was 3,996, so the preferred model was The Fixed Effect Model.
2) Based on the Haussman Test, the value of Chi Square statistic was 2,137485 less than the
value of Chi Square Table was 3,841, so the preferred model was Random Effect Model. 3) Based on the Multicollinearity Test, the values of Centered VIF for the independent
variablewas less than 10, It meant that there was no multicollinearity.
4) Based on the Heterocedasticity Test, the value of Prob chi-squared equal to 0.5935 (59,35%) more than 0,05 (5%). It meant that there was no heteroscedasticity.
5) The Constant value (c) of 1,127529means that if the variableStock Return worth 0, then
Company Value (Y) is obtained at 1,127529.
6) The variable Stock Returnregression coefficient value obtained at0,473353.Positive value
means that every increase in Stock Return of 1 unit, it will increase Company Value by 0,473353 units, assuming other independent variables remain.
7) The determination coefficient is 0,078298. This shows the Stock Return variable able to
provide an explanation on the Company Value variable of 7,8298% while the remaining 92,1702% is explained by other factors not examined in this study.
Figure 5: Diagram of Direct and Indirect Effects
Detailed calculations and analysis of the calculation of direct and indirect effects are attached to the table below:
Table 5: Path Analysis Results
Effect Between Variables Direct Indirect Effect Effect
Effect of ROA on Stock Return 1,449973
Http://www.ijetmr.com©International Journal of Engineering Technologies and Management Research [113]
Effect of DER on Stock Return 0,056438
Effect of PER on Stock Return 0,00115
Effect of Exchange Rate on Stock Return -3,67781
Effect of ROA on Company Value 0,305626 0,68635
Effect of CR on Company Value -0,2168 0,02488
Effect of DER on Company Value 0,068529 0,02676
Effect of PER on Company Value 0,004264 0,00054
Effect of Exchange Rate on Company Value -2,148437 -1,7409
Effect of Stock Return on Company Value 0,473353
Based on the calculation above, Stock Return variablecan strengthen the influence of ROA variableand CR, but DER variable, PER and Exchange Ratewere better done directly without going through the Stock Return variable, because the coefficient values were directly greater than through intervening variables. Based on the results of the study obtained the following discussion:
Effect of ROA on Stock Return
Based on the research results ROA has a positive effect in predicting Stock Return. This unidirectional relationship can occur because the higher the ROA value reflects that the company has succeeded in utilizing the assets it has in increasing net income. The increase in net income will increase investor confidence to invest their capital. These results supportthe research of Venkates and Taygi (2012), Tehrani (2015), Anwaar (2016), Puspitadewi (2016), and Munawaroh et.al (2014).
Effect of CR on Stock Return
Based on the results of the study, CR has a positive effect in predicting Stock Return. This unidirectional relationship can occur because the higher the value of CR reflects that the company has the ability of the company to pay off current liabilities with current assets owned. High CR is a guarantee that the company will avoid the risk of liquidation because the number of current assets is greater than its current liabilities. When CR increases, investor confidence in investing capital will increase because they assume that the company operates well. This result supportthe research of Petcharabul and Rompraset's (2012), but did not support the research of Gharaibeh(2014) and Marangu and Jagongo (2014), which concluded that the current ratio (CR) has a negative effect on stock returns
Effect of DER on Stock Return
Http://www.ijetmr.com©International Journal of Engineering Technologies and Management Research [114] Effect of PER on Stock Return
Based on the results of the study, PER has a positive effect in predicting Stock Return. This unidirectional relationship can occur because the higher the PER value indicates the higher the income per share. Investors show confidence that if stock prices are getting higher, then stock returns will also increase. These results support the research ofRadim (2012) and Puspitadewi (2016), but did not support the research of Zeytinoglu et.al (2012) which concludes that PER has a negative effect on stock returns.
Effect of Exchange Rate on Stock Return
Based on the results of the study, the exchange rate has a negative effect in predicting Stock Returns. The opposite relationship can occur because the higher the exchange rate is feared to reduce net income in the plastic and packaging industry sector because almost all of the raw materials are obtained from foreign imports, where the transaction uses USD. This shows that investors are worried that rising exchange rates will make the plastic and packaging industries unable to compete in the market.This result support the research ofSani and Hassan's (2018), but did not support the research of Barakat et al. (2015) which concluded that exchange rates have a positive effect on stock returns.
Effect of ROA on Company Value
Based on the results of research, ROA has a positive effect in predicting company value. This unidirectional relationship can occur because the higher the ROA value reflects that the company has succeeded in utilizing the assets it has in increasing net income. The increase in net income will increase investor confidence to invest their capital.These results support the research of Sudiyatno et.al (2012) and Mulyana and Rini (2017), but it did not support the research of Umaiyah and Salim (2012) which concluded that ROA has a negative influence on company value.
Effect of CR on Company Value
Based on the results of the study, CR has a negative effect in predicting company value. The opposite relationship can occur because the high current assets in the plastic and packaging industry are considered by investors as not yet widely used for company activities. This causes the company's profits to decline so that the company's value decreases. This result support the research ofMarangu and Jagongo's (2014), but did not support the research of Ayako and Wawalwa (2015) and Asif (2016), which concluded that the current ratio (CR) had a positive effect on stock returns.
Effect of DER on Company Value
Http://www.ijetmr.com©International Journal of Engineering Technologies and Management Research [115] Effect of PER on Company Value
Based on the results of the study, PER has a positive effect in predicting company value. This unidirectional relationship can occur because the higher the PER value indicates the higher the income per share. Investors show confidence that if the stock price gets higher, then the value of the company will also increase. This result support the research ofSudiyatno (2010), but did not support to Kusuma's (2016) research, which concluded that PER had a negative effect on firm value.
Effect of Exchange Rate on Company Value
Based on the results of the study, the exchange rate has a negative effect in predicting company value. The opposite relationship can occur because the higher the exchange rate is feared to reduce net income in the plastic and packaging industry sector because almost all of the raw materials are obtained from foreign imports, where the transaction uses the USD currency. This shows investors are worried that rising exchange rates will make the plastic and packaging industry unable to compete in the market. These results support the research ofKusuma (2016), but did not support to Sudiyatno's (2010) research which concluded that exchange rates have a positive effect on firm value.
Effect of Stock Return on Company Value
Based on the results of research, stock returns have a positive effect in predicting company value. This unidirectional relationship can occur because the higher the value of stock returns reflects that the company has succeeded in increasing the share price owned due to good financial performance and other factors, so that investors benefit from this investment. The greater the profit gained from the increased share price, the more investors will invest in the company, so that the overall value of the company will increase. This result support with Dewi's (2015) research, but did not supportKusuma's (2016) research which concluded that stock returns have a negative effect on company value.
4. Conclusions and Recommendation
The variable Return on Assets (ROA) has the most influence than other internal variables on increasing stock returns and company value, therefore company management is advised to make every effort to optimize the use of assets owned by the company to generate net income, because an increase in profitability can improve both stock returns and company value of plastics and packaging companies.
The external variable of exchange rate has the greatest influence in this research, both the influence on stock returns and company value. Therefore, the government is advised to be able to carry out stability and strengthen the value of the currency, so that plastic and packaging companies can increase competitiveness with the global sector.
Http://www.ijetmr.com©International Journal of Engineering Technologies and Management Research [116] Further research as an effort to improve, it is necessary to add additional variables both internal and external or macroeconomics that affect company value and stock returns for the plastic and packaging industry sector companies.
Further research is needed to add a longer and more actual research period, as well as other company objects, so that the results of the research obtained will be in accordance with the situation and conditions at the time the research was conducted.
References
[1] Acheampong, Prince., Evans Agalega, dan Albert KwabenaShibu. (2014). “The Effect of Financial Leverage and Market Size on Stock Returns on the Ghana Stock Exchange: Evidence from Selected Stocks in the Manufacturing Sector”. International Journal of Financial Research. ISSN 1923-4023, E-ISSN 1923-4031. Vol. 5, No. 1; 2014. Page:125-134.
[2] Al-Qudah, Anasdan Mahmoud Laham. (2013). “The Effect of Financial Leverage & Systematic Risk on Stock Returns in the Amman Stock Exchange (Analytical Study – Industrial Sector)”. Research Journal of Finance and Accounting. Issn 2222-1697 (Paper) Issn 2222-2847 (Online). Vol.4, No.6: 106 – 145.
[3] Al Qaisi, Fouzan; Tahtamouni, Asemdan Al-Qudah, Mustafa. (2016). Factors Affecting the Market Stock Price – The Case of the Insurance Companies Listed in Amman Stock Exchange. International Journal of Business and Social Science, Vol.7, No.10, October 2016
[4] Anwaar, Marryam. (2016). “Impact of Firms’ Performance on Stock Returns (Evidence from Listed Companies Of Ftse-100 Index London, Uk)”. Global Journal of Management and Business Research: Daccounting And Auditing. Online ISSN: 2249-4588 & Print ISSN: 0975-5853. Volume 16 Issue 1 Version 1.0 Year 2016. Page: 31-39
[5] Arifannisa, Winna and Nugraha, ArieApriadi. (2017). Effect of Fundamental Factors and Technical Factors on Stock Prices. ISSN 2252-3936, 2017
[6] Asif, Amara dan Aziz Bilal. (2016).” Impact of Capital Structure on Firm Value Creation-Evidence from the Cement Sector of Pakistan”. International Journal of Research in Finance and Marketing: Volume 6, Issue 6. ISSN: 2231-5985. pp: 231-245
[7] Asri, I GustiAyu Amanda Yulita and Suwarta, I Ketut. (2014). Effect of Fundamental Factors and Macroeconomics on Returns of Consumer Good Company Shares. Accounting E-Journal of Udayana University, ISSN 2302-8556, 2014
[8] Astuty, Pudji. (2017). The Influence of Fundamental Factors and Systematic Risk to Stock Prices on Companies Listed in the Indonesian Stock Exchange. European Research Studies Journal, Volume XX, Issue 4A, 2017
[9] Ayako, Aloys and Fidelis Wawalwa. (2015). “Determinants of Firm Value in Kenya: Case of Commercial Banks Listed at the Nairobi Securities Exchange”. Applied Finance and Accounting; Vol. 1, No. 2; August 2015
[10] Ayudya, Resi; Suwandari, Anik dan Hartadi, Rudi. (2017). The Impacts of Fundamental and Macroeconomics Factors on the Stock Price of Oil Palm Plantation Companies in Indonesia Stock Exchange. ISSN 2087-3735. Jakarta
[11] BalaSani AR and Hassan A. (2018). Exchange Rate and Stock Market Interactions: Evidence from Nigeria. Arabian Journal of Business and Management Review Volume 8.
[12] Barakat, Mahmoud Ramadan, Elgazzar, Sara H. & Hanafy, Khaled M. (2015). Impact of Macroeconomic Variables on Stock Markets: Evidence from Emerging Markets. International Journal of Economics and Finance; Vol. 8, No. 1; 2016: 195-207
Http://www.ijetmr.com©International Journal of Engineering Technologies and Management Research [117]
[14] Das, NiladridanPattanayak, J.K. (2009). Analysis of The Fundamental Factors Affecting The Market Price of Shares Constituting The Indian Index: A Study of SENSEX. Internasional Journal Accounting and Finance, Vol.1, No.3, 2009
[15] Devianasari, Ni Luh. 2015. Effect of Price Earning Ratio, Debt To Equity Ratio, and Payout Ratio Dividends on Company Values in Manufacturing Companies Listed on the Indonesia Stock Exchange. Management Journal of Unud 4 (11), pp: 3646 - 3674
[16] Emamgholipour, Milad et al. 2013. “The Effects of Performance Evaluation Market Ratios on The Stock Return: Evidence from The Tehran Stock Exchange”. International Research Journal of Applied and Basic Science, Vol. 7, No. 3, pp: 72-84.
[17] Fabozzi, Frank.Jdan Modigliani, Franco. (1992). Capital Markets:Institutions and Instruments. Prentice Hall, 1992
[18] Fahmi, Irham. (2011). Analysis of financial statements. Alfabeta. Bandung
[19] ___________. (2014). Financial and Capital Market Management. MitraWacana Media. Jakarta [20] Ghozali, Imam and Ratmono, Dwi. (2013). Multivariate Analysis and Econometrics: Theory,
Concepts, and Applications with Eviews 8. ISBN, Diponegoro University Publisher. Semarang [21] Haque, Samina and MurtazaFaruquee. (2013). Impact of Fundamental Factors on Stock Price: A
Case Based Approach on Pharmaceutical Companies Listed with Dhaka Stock Exchange. International Journal of Business and Management Invention. Vol 2 No 9, September 2013. ISSN: 2319-8028. pp: 34-41
[22] Hery. (2016). Financial Report Analysis: Integrated and Comprehensive Edition. PT. Gramedia. Jakarta
[23] Ivan. (2016). Effect Analysis of Fundamental Factors on Stock Prices (Empirical Study on Manufacturing Companies Listed on the Indonesia Stock Exchange for the 2012-2015 Period). Estuary Journal of Economics and Business, ISSN 2579-6224, Vol.2, No.1, April 2018.
[24] Jogiyanto. (2008). Portfolio Theory and Investment Analysis. Fifth edition. BPFE. Yogyakarta [25] Kusuma, JaluTeja. (2016). Analysis of the Effect of Internal Factors and External Factors of the
Company on Company Values. Description. Muhammadiyah University Surakarta.2016.
[26] Legiman, Fachreza Muhammad; Tommy, Parengkuan and Untu, Victoria. (2015). Factors Affecting Stock Returns on Agro-Industry Companies Listed on the Indonesia Stock Exchange Period 2009-2012. Journal of Emba, Vol. 3, No.3, 2015
[27] Limbong, Dita T Sampriani and Mochammad Chabachib. (2016). "Analysis of the Effect of Capital Structure, Sales Growth, and Firm Size on Firm Value with Profitability as Intervening Variables (Case Study of Real Estate Companies and Property Listed on the Stock Exchange in 2010-2014)". Diponegoro Journal of Management Volume 5, Number 4. pp 1-14.
[28] Lim Pei Fun, et al (2012). Price Earnings Ratio and Stock Return Analysis (Evidence from Liquidity 45 Listed in Indonesian Stock Exchange Stocks). Journal of Management and Entrepreneurship, Vol. 14, No. 1
[29] Marangu, Kenneth and Ambrose Jagongo. (2014). “Price to Book Value Ratio and Financial Statement Variables (An Empirical Study of Companies Quoted At Nairobi Securities Exchange, Kenya)”. Global Journal of Commerce & Management Perspective. G.J.C.M.P., Vol 3 (6): 50-56.
[30] Muhammad, Shakeeldan Ali, Gohar. (2017). The Relationship Between Fundamental Analysis and Stock Return Based on the Panel Data Analysis; Evidence from Karachi Stock Exchange. Research Journal of Finance and Accounting, ISSN 222-1697, Vol.9, No.3,2018
[31] Murni, Asfia. (2016). Macro Economics. RefikaAditama. Bandung
[32] Mulyana, Bambang and Rini, Rahmatika. (2017). The Influence of Solvency, Profitability, Company Size and Beta Stocks on Company Values and Their Impact on the Return of Company Shares in Automotive and Component Sub Sector Registered on the Indonesia Stock Exchange for the 2010-2016 Period. UniversitasMercubuana Journal, 2017. Jakarta
Http://www.ijetmr.com©International Journal of Engineering Technologies and Management Research [118]
[34] Petcharabul, PinradeedanSuppanuntaRomprasert. (2014). “Technology Industry on Financial Ratios and Stock Returns”. Journal of Business and Economics, Vol. 5, No. 5. Hal. 739-746. [35] Puspitadewi, CokordaIstri Indah, HennyRahyuda. (2016). "The Effect of DER, ROA, PER and
EVA on Stock Returns on Food and Beverage Companies on the IDX". E-Management Journal of Udayana University, Vol. 5, No. 3, pp. 1429-1456. Bali.
[36] Radim, Gottwal. (2012). The Use of the P/E Ratio Stock Valation. Grant Journal Euro Grant Projects. RepublikCeko
[37] Rusti’ani, MeilindaEka and Wiyani, Natalia Titik. (2017). Financial Ratio as an Indicator for Measuring Cement Corporate Financial Performance. Accounting Journal, Vol. 17, No.2, 2017 [38] Salim, M. Noor; SugengSuroso, Tri Wisyastuti, and Irma Setyawati. (2017). Intellectual Capital
and Corporate Governance in Financial Performance Indonesia Islamic Banking. International Journal of Economics and Financial Issues, 7(4), 96-103
[39] Samsuar, Tenriola and Akramunnas. (2016). Fundamental and Technical Influences on the Prices of Hospitality Industry Shares Listed on the Indonesia Stock Exchange. Journal of Islamic Economics, Finance and Banking, Vol.1, No.1, 2017
[40] Sudiyatno, Bambang. (2010). The Role of Corporate Performance in Determining the Effect of Fundamental Macroeconomic Factors, Systematic Risks, and Company Policies on Corporate Values. Dissertation. University of Diponegoro Semarang. 2010
[41] Sukhija, Sunita. (2014). An Explicit Model on Fundamental Factors Affecting Stock Prices of BSE Listed Companies in India: An Inter Industry Approach. European Journal of Business and Management, ISSN 222-2839, Vol.6, No.37, 2014
[42] Tandelilin, Eduardus. (2010). Portfolio and Investment. Kanisius. Yogyakarta
[43] Tehrani, AbolghasemGholamrezadanAmirabbasGholamrezaTehrani. (2015). “The Effect on Financial Ratios to Predict Company Profits and Stock Returns”. International Journal of Review in Life Sciences. Vol. 5, No. 1. Hal.891-899
[44] WBBA, Amanda and Pratomo, WahyuArio. (2013). Fundamental Analysis and Systematic Risk of Banking Stock Prices listed in the LQ45 Index. Economics and Finance Journal Vol.1, No.3, February 2013
[45] Weston, J. Feed and Thomas E. Copeland. (2010). Financial Management. Jakarta: BinarupaAksara.
[46] Zeytinoglu E, Akarim YD and Celik S. 2012. “The Impact of Market Based Ratios on Stock Return: The Evidence from Insurance Sector in Turkey”. International Research Journal of Finance and Economic, Vol. 14, No. 5, pp. 225-23
[47] Zulkarnaen, AisyahHusna; Syamsun, Muhammad danMaulana, Tb Nur Ahmad. (2016). Analysis of Fundamental and Technical Factors to Stock Price on Residential Property Sector Companies Listed in Indonesia Stock Exchange. International Journal of Scientific and Research Publications, ISSN 2250-3153, Vol.6, 2016