Open Access
Research article
Complex nature of SNP genotype effects on gene expression in
primary human leucocytes
Graham A Heap
1, Gosia Trynka
†2,3, Ritsert C Jansen
†2,4, Marcel Bruinenberg
2,
Morris A Swertz
2, Lotte C Dinesen
5, Karen A Hunt
1, Cisca Wijmenga
2,3,
David A vanHeel
1and Lude Franke*
1,2,3Address: 1Institute of Cell and Molecular Science, Barts and The London School of Medicine and Dentistry, London, E1 2AT, UK, 2Genetics Department, University Medical Centre Groningen, University of Groningen, 9700 RB Groningen, the Netherlands, 3Complex Genetics Section, DBG-Department of Medical Genetics, University Medical Centre Utrecht, 3584 CG Utrecht, the Netherlands, 4Groningen Bioinformatics Centre, Groningen Biomolecular Sciences and Biotechnology Institute, University of Groningen, Kerklaan 30, NL-9751 NN Haren, the Netherlands and 5Gastroenterology Unit, University of Oxford, Oxford OX3 7BN, UK
Email: Graham A Heap - [email protected]; Gosia Trynka - [email protected]; Ritsert C Jansen - [email protected];
Marcel Bruinenberg - [email protected]; Morris A Swertz - [email protected]; Lotte C Dinesen - [email protected]; Karen A Hunt - [email protected]; Cisca Wijmenga - [email protected]; David A vanHeel - [email protected];
Lude Franke* - [email protected]
* Corresponding author †Equal contributors
Abstract
Background: Genome wide association studies have been hugely successful in identifying disease risk variants, yet most variants do not lead to coding changes and how variants influence biological function is usually unknown.
Methods: We correlated gene expression and genetic variation in untouched primary leucocytes (n = 110) from individuals with celiac disease – a common condition with multiple risk variants identified. We compared our observations with an EBV-transformed HapMap B cell line dataset (n = 90), and performed a meta-analysis to increase power to detect non-tissue specific effects.
Results: In celiac peripheral blood, 2,315 SNP variants influenced gene expression at 765 different transcripts (< 250 kb from SNP, at FDR = 0.05, cis expression quantitative trait loci, eQTLs). 135 of the detected SNP-probe effects (reflecting 51 unique probes) were also detected in a HapMap B cell line published dataset, all with effects in the same allelic direction. Overall gene expression differences within the two datasets predominantly explain the limited overlap in observed cis -eQTLs. Celiac associated risk variants from two regions, containing genes IL18RAP and CCR3, showed significant cis genotype-expression correlations in the peripheral blood but not in the B cell line datasets. We identified 14 genes where a SNP affected the expression of different probes within the same gene, but in opposite allelic directions. By incorporating genetic variation in co-expression analyses, functional relationships between genes can be more significantly detected.
Conclusion: In conclusion, the complex nature of genotypic effects in human populations makes the use of a relevant tissue, large datasets, and analysis of different exons essential to enable the identification of the function for many genetic risk variants in common diseases.
Published: 7 January 2009
BMC Medical Genomics 2009, 2:1 doi:10.1186/1755-8794-2-1
Received: 3 June 2008 Accepted: 7 January 2009
This article is available from: http://www.biomedcentral.com/1755-8794/2/1
© 2009 Heap et al; licensee BioMed Central Ltd.
Background
Human gene expression levels have a strong heritable component [1-4]. At some genes, the variance in gene expression levels is an order of magnitude greater between unrelated individuals, than between identical twins [5]. Quantitative mRNA levels are key regulators of phenotype and represent a link between genetic variation and pheno-typic alterations. A term first introduced by Jansen & Nap [6], genetical genomics aims to identify the genetic variants that affect gene expression. By treating gene expression as a quantitative trait it is possible to correlate gene transcript expression levels with genomic locations such that expres-sion quantitative trait loci (eQTLs) can be identified [7]. In the human genome, cis associations, where a genetic variant affects a transcript that maps to the same locus, have been predominantly reported [3,8]. Trans effects, where the genetic variant is distant to the transcript loci, are much harder to convincingly identify due to inherent multiple testing problems. Analysis of trans effects involves several magnitudes more statistical tests than for
cis effects. Although individual studies have reported human trans associations, no effects have been convinc-ingly replicated in multiple studies identified for the same transcript and variant [1,9,10].
Quantitative transcript expression and genotype relation-ships can be investigated via linkage or association based methodologies. Linkage studies use a genome wide series of markers in recombinant in-bred lines or families, to fol-low the heritability of a trait, whilst association studies usually compare large number of single nucleotide poly-morphisms (SNPs) to transcript levels from unrelated individuals. Despite its extensive use in plant [11,12], mouse [13,14] and rat [15] models, transcript expression and genotype correlation studies have only recently been performed in humans [3,5,8].
Human association studies have centered on RNA obtained from leukocytes, predominantly Epstein-Barr virus (EBV) transformed B cell lines from HapMap indi-viduals [3] or unrelated trios [1]. A large scale genetical genomics linkage study has recently identified more than 1000 cis regulatory loci across the genome, in primary cry-opreserved human leukocytes [2], although these are broad genomic regions rather than variants in more pre-cisely defined LD blocks. However, the former studies are limited by their ability to assess transcripts that are signif-icantly expressed at the point of RNA isolation. Cell extraction methods, cryopreservation and EBV transfor-mation all affect individual mRNA expression levels. These variations in RNA analysis make the choice of anal-ysis tissue of paramount importance.
Here we present an association based genetical genomics study using primary cell RNA from peripheral blood sam-pled from patients in remission from an immune-mediated
disease. Immediate RNA preservation during blood sam-pling (using the PAXgene system) represents nearly in vivo
human physiological gene expression. Celiac disease is a common (1% prevalence), inflammatory condition of the small intestine induced by intake of gluten in wheat, rye and barley. A strong genetic component has been estab-lished for disease with a monozygotic concordance of 75% [16] and 90% of cases possessing the HLA haplotype HLA-DQ2.5 [17] and the remainder mostly have HLA-DQ8 [18]. Despite the role of the HLA, the risk of disease is still greater in HLA matched monozygotic twins compared to HLA matched dizygotic twins [19]. We recently performed a genome wide association and replication study using sin-gle nucleotide polymorphisms (SNPs) and identified an additional eight susceptibility loci that predispose to celiac disease [20,21]. A surprising finding from this study was that seven of the eight regions contained promising candi-date genes expressed in leucocytes of the immune system. This suggested the feasibility of genetical genomics approaches using peripheral blood to assess the biological function of the celiac disease associated risk variants. One goal of genetical genomics is to uncover previously unknown biological pathways. If genetic variation affects the expression of a gene in trans, this suggests a biological relationship exists between the two loci. To assess this, con-siderable amounts of effort have been devoted to the devel-opment and application of statistical frameworks that are capable of detecting these trans-eQTLs. However, detection of trans-eQTLs in human populations has proven less suc-cessful than in mouse, rat and plant recombinant inbred lines [13,22]. It has been suggested that the extensive genetic and environmental diversity between human indi-viduals masks many of the existing trans-effects.
We show that numerous cis-eQTLs can be identified through an expression analysis of peripheral blood RNA. We also show many of these are only detectable in periph-eral blood RNA, and not in EBV-transformed B cell lines. Through a meta-analysis of these two datasets we identi-fied numerous additional cis-eQTLs. We show that for some cis-eQTLs genetic variation does not lead to overall gene expression changes, but rather leads to shifts in the types of different splice isoforms that are produced. The complex nature of genotypic effects on gene expression limits our ability to fully elucidate the effect on RNA expression level or sequence and combined with the sig-nificant multiple testing problems prevented the accurate identification of trans effects.
Methods
Study population
(23–88), a median age at diagnosis of 42 (1–75), a male to female sex ratio of 1:3, and a median length of treat-ment on a gluten free diet of 9.4 years (1–47). Celiac indi-viduals responding to a gluten free diet typically show no detectable inflammation (which we confirmed at the mRNA level in peripheral blood). We also enrolled 22 healthy unrelated UK controls, with a male to female sex ratio of 1:1.2, but of unknown age.
PAXgene RNA Extraction
2.5 ml of peripheral blood was collected into a PAXgene tube (Becton Dickinson, UK, 762165). PAXgene vials were chosen to prevent density gradient centrifugation, immortalization or in vitro cell culture artifacts changing mRNA profiles.
PAXgene tubes were mixed gently and incubated at room temperature for two hours. After collection, tubes were frozen at -20°C for at least 24 hours followed by storage at -80°C. RNA was isolated using the PAXgene Blood RNA isolation kit (Qiagen, UK, 762174). RNA was quantified using the Nanodrop (Nanodrop Technologies, USA). Total RNA integrity was analyzed using an Agilent Bioan-alyzer (Agilent Technologies, USA).
Anti-sense RNA synthesis, amplification, purification and hybridization to Illumina expression chips
Anti-sense RNA was synthesized, amplified and purified using the Ambion Illumina TotalPrep Amplification Kit (Ambion, USA) following the manufacturers' protocol. Complementary RNA was hybridized to Illumina HumanRef-8 v2 Whole Genome BeadChips and scanned on the Illumina BeadArray Reader. Data was handled through the Illumina BeadStudio Gene Expression mod-ule v3.2. All gene expression (MIAME compliant) and genotype data has been made freely available by submis-sion to GEO under GSE11501.
Quality control
Five celiac disease samples were excluded from subse-quent analysis due to poor median probe intensity corre-lation with all other samples or incorrect sex assignment, based on an analysis of all the probes that mapped to the non-pseudoautosomal region of chromosome Y. A data-set of 110 celiac disease patients and 22 controls was then used for analysis.
Normalization
Expression probes were mapped to the cDNA sequence from Ensembl v45_36g [23] and the NCBI build 36 genome assembly if necessary. Probes that had less than 96% sequence homology or that mapped to multiple loci were removed. Subsequent analyses were confined to autosomal probes, in order to prevent sex specific effects on gene expres-sion. After removal of probes that map to sex chromosomes, data was quantile-quantile normalized [24].
Celiac disease sample genotypes
All celiac disease patients were genotyped as previously described [20] using Illumina Infinium HumanHap300v1.0 BeadChips.
Peripheral blood eQTL association analysis and false discovery rate control
257,013 autosomal SNPs were tested for association with expression levels in the 110 celiac disease samples that met analysis criteria of minor allele frequency (MAF) > 0.1, exact Hardy-Weinberg equilibrium P-Value > 0.0001 and call-rate > 0.95. Analyses were confined to those probe-SNP pairs for which the distance from probe genomic midpoint to SNP genomic location was less than 250 kb or 500 kb, depending on the analysis performed. To prevent spurious associations due to outliers, a non-parametric Spearman's rank correlation analysis was per-formed. In order to correct for multiple testing we control-led the false discovery rate (FDR) [25]. The distribution of all the observed p-values was used to calculate the FDR, by comparing this distribution to a null-distribution, obtained from an identical analysis where the expression phenotypes, relative to the genotypes had been permuted. Through 1,000 permutations the Spearman's rank correla-tion P-value threshold could be determined that corre-sponded to an FDR of 0.01 or 0.05.
Validation panel: HapMap CEU samples
We compared the identified cis-eQTLs in the celiac periph-eral blood dataset to a published human genetical genom-ics dataset [3]. We reanalyzed expression data from EBV-transformed B cell lines (further described as HapMap B cell line dataset) for 90 CEU HapMap samples [3]. Analyses were performed as described for the celiac disease samples. To enable a comparison between the celiac peripheral blood dataset and the HapMap B cell line dataset, only SNPs were tested that had been successfully called within HapMap and that were present on the Illumina HumanHap300 platform (257,013 SNPs). Although this is only a subset of all the SNPs that have been called for these HapMap samples, this subset of SNPs is known to capture most genetic Caucasian variation well [26].
Analysis of over- and underrepresented biological processes and function
We investigated over- or underrepresentation of certain biological processes or functions through an analysis of all significant cis-eQTL genes using the Panther Classifica-tion System [27] (Binomial P-Value, Bonferroni cor-rected).
Co-expression analysis
can provide valuable biological insight. If several of these were to be identified, they would allow for the reconstruc-tion of gene networks.
A different, regularly used approach for reconstructing gene networks is by systematically assessing co-expression between pairs of genes. We performed such a co-expres-sion analysis for each probe that comprised a cis-eQTL and contrasted this to an analysis where the genetic com-ponent of the cis-eQTL on the probe intensity level had been removed.
We first investigated whether the identified probe that comprised a cis-eQTLs (probe distance of 250 kb, FDR of 0.05) showed co-expression with all other probes that mapped to different chromosomes for both the celiac peripheral blood dataset and the HapMap B cell line data-set. We correlated the measured intensity levels with all other probes that mapped on different chromosomes, through a Spearman's rank correlation analysis. By apply-ing Bonferroni correction to account for multiple testapply-ing, sets of significantly correlated transcript-pairs could be identified.
Subsequently we used partial-correlations, enabling us to redo this co-expression analysis while effectively remov-ing the genotypic effect on the probe intensity level for the probes that constitute the significant cis-eQTLs. Again, by applying Bonferroni correction, sets of significantly corre-lated transcript-pairs could be identified.
Results
Celiac disease is an immune mediated disease, dominated by TH1 cytokine response. Given the importance of tissue specific RNA profiles, we felt that peripheral blood was an appropriate medium to study to investigate celiac disease associated genetic variants. Given the known genetic con-tribution to disease, we enrolled treated celiac disease individuals rather than healthy controls, leading to an enrichment for celiac disease associated genetic variants and underlying causal variants [20,28]. For 110 celiac dis-ease samples that passed quality control, both expression at 19,867 transcripts and genotype data for 257,013 SNPs, were analyzed.
Gene expression in celiac disease versus healthy control samples
To obtain the most accurate reflection of mRNA levels in peripheral blood leukocytes, whole blood RNA was immediately fixed during venepuncture in PAXgene vials, giving a reflection of in vivo RNA expression from whole blood. One hundred and fifteen treated celiac patients, all of whom were successfully treated and compliant with a gluten free diet for at least six months, were enrolled. Sev-enty percent of celiac disease patients were female,
(66.6% of adult cases diagnosed with celiac disease in the population are female [29]). In addition, 22 random healthy control samples were enrolled to obtain a back-ground RNA expression profile, enabling us to determine whether the patients indeed did not show ongoing inflammation. In a sex matched comparison no known inflammatory disease associated cytokines, including
IFNG [30] and IL2 [31] showed significantly increased expression (sex matched Wilcoxon Signed-Ranks Test P value < 0.05) in celiac versus control samples, as was expected since these patients had been treated with a glu-ten free diet.
Cis-associations of gene expression with SNPs
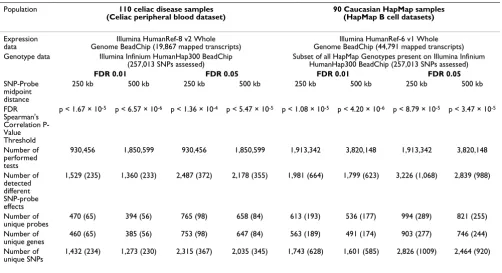
Gene expression levels for 19,867 transcripts were ana-lyzed for significant genotypic effects at 257,013 auto-somal SNPs, mapping within 500 kb of the centre of the transcript probes, resulting in 1,850,599 tests. By using a Spearman's rank correlation coefficient statistic and an FDR of 0.01 or 0.05, 1,360 and 2,178 different SNP-probe effects were detected, respectively. These reflect 394 and 658 unique probes, and 1,273 and 2,035 unique SNPs, respectively (see Table 1).
An identical analysis was performed on publicly available EBV-transformed B cell line expression and genotype data for 90 CEU HapMap individuals [3]. Using this dataset and a SNP-probe distance of 500 kb and FDR of 0.01 or 0.05, 1,799 and 2,839 different SNP-probe effects were detected, respectively. These reflect 536 and 821 unique probes, and 1,601 and 2,464 unique SNPs, respectively (see Table 1). Details of all detected individual cis-eQTLs are available in Additional file 1.
Distance between SNPs and probes that constitute the cis-eQTLs
Meta-analysis celiac peripheral blood and HapMap B cell lines data sets
4,681 Illumina expression probes had oligonucleotide sequences that are shared between the two different oligo-nucleotide arrays used (Human Ref8 v2 & Human WG-1 v1). By limiting the analysis to a window size of 250 kb and only to SNPs that had been successfully genotyped in both studies, 576 different SNP-probe effects in the celiac peripheral blood data at a FDR = 0.05 (338 at an FDR = 0.01) were detected. These reflect 573 different SNPs and 197 different probes. In the HapMap B cell line data, 573 different SNP-probe effects were identified at an FDR = 0.05 (290 at an FDR = 0.01), reflecting 573 different SNPs and 189 different probes. A combined meta-analysis of both cohorts (weighted-Z method) identified 1,133 different SNP-probe associations at an FDR = 0.05 (428 at an FDR = 0.01) (see Figure 2). These reflect 1,120 SNPs and 328 unique probes. 440 SNP-probe pairs, reflecting 217 differ-ent probes and 439 differdiffer-ent SNPs (FDR = 0.05) were not detected when either dataset was analyzed separately.
135 identical SNP-Probe effects (reflecting 135 different SNPs and 51 different probes) had been identified in both the 110 celiac disease samples and in the 90 HapMap B cell line samples (FDR = 0.05). In all cases, the combined meta-P-Value for each of these shared cis-eQTLs was more significant due to the larger sample size, indicating allelic effects in the same direction. A comparison between cis -eQTLs that had been detected in a large scale linkage
based genetical genomics study using RNA obtained from peripheral blood mononuclear cells [2], and the cis-eQTLs we detected, indicates that 57.3% (distance 250 kb, 0.05FDR) of probes, displaying a genotypic effect in the celiac peripheral blood dataset, also show a linkage
cis-eQTL signal. Of note is that CCR3 and IL18RAP are both identified as cis-eQTLs in both these datasets.
Primer Polymorphisms
While it can be assumed that for most of the detected cis -eQTLs indeed the probe expression is affected by genetic variation, it can also be that SNPs, mapping to regions to which the probe hybridizes, may affect hybridization effi-cacies and result in cis-eQTLs [32] that are not due to expression differences. For the celiac peripheral blood dataset, 10.0% of all Illumina HumanRef-8 v2 probes map to regions that contain known dbSNP polymor-phisms. For the HapMap B cell line dataset, 20.5% of all Illumina HumanRef-6 v1 probes map to known SNPs. For the probes that make up the identified cis-eQTLs (distance 250 kb, FDR = 0.05) this percentage is significantly higher for both the celiac peripheral blood analysis (12,5%, Fisher's Exact test P = 0.02) and even more pronounced for the HapMap B cell line dataset (29.1%, P = 7.76 × 10 -11). Numbers within brackets in table 1 denote the
number of cis-eQTLs, probes or genes that are potentially due to these primer polymorphisms. If these primer poly-morphisms are responsible for different hybridization efficacies, these SNPs should be in LD with the SNPs that Table 1: Summary of cis-eQTL findings from celiac peripheral blood and HapMap B cell line data sets
Population 110 celiac disease samples (Celiac peripheral blood dataset)
90 Caucasian HapMap samples (HapMap B cell datasets)
Expression
data Genome BeadChip (19,867 mapped transcripts)Illumina HumanRef-8 v2 Whole Genome BeadChip (44,791 mapped transcripts)Illumina HumanRef-6 v1 Whole Genotype data Illumina Infinium HumanHap300 BeadChip
(257,013 SNPs assessed) Subset of all HapMap Genotypes present on Illumina Infinium HumanHap300 BeadChip (257,013 SNPs assessed)
FDR 0.01 FDR 0.05 FDR 0.01 FDR 0.05
SNP-Probe midpoint distance
250 kb 500 kb 250 kb 500 kb 250 kb 500 kb 250 kb 500 kb
FDR Spearman's Correlation P-Value Threshold
p < 1.67 × 10⁻⁵ p < 6.57 × 10⁻⁶ p < 1.36 × 10⁻⁴ p < 5.47 × 10⁻⁵ p < 1.08 × 10⁻⁵ p < 4.20 × 10⁻⁶ p < 8.79 × 10⁻⁵ p < 3.47 × 10⁻⁵
Number of performed tests
930,456 1,850,599 930,456 1,850,599 1,913,342 3,820,148 1,913,342 3,820,148
Number of detected different SNP-probe effects
1,529 (235) 1,360 (233) 2,487 (372) 2,178 (355) 1,981 (664) 1,799 (623) 3,226 (1,068) 2,839 (988)
Number of
unique probes 470 (65) 394 (56) 765 (98) 658 (84) 613 (193) 536 (177) 994 (289) 821 (255) Number of
unique genes
460 (65) 385 (56) 753 (98) 647 (84) 563 (189) 491 (174) 903 (277) 746 (244)
Number of unique SNPs
1,432 (234) 1,273 (230) 2,315 (367) 2,035 (345) 1,743 (628) 1,601 (585) 2,826 (1009) 2,464 (920)
make up the cis-eQTLs. We could assess this for those cis -eQTLs where genotype data was available within HapMap Phase II for both the SNP that makes up the eQTL and for the SNPs that map within the probe that constitutes this particular eQTL. We compared the resulting distribution of r2 values to a null distribution, generated by calculating the LD between the SNP that makes up an eQTL and the SNP that mapped immediately adjacent to the primer pol-ymorphism SNP. While the mean LD (mean r2 = 0.27) in the celiac peripheral blood was not significantly higher than the mean LD in the null distribution (mean r2 = 0.25, Wilcoxon Mann-Whitney P-Value = 0.86), this was observed for the HapMap B cell line dataset (mean r2 = 0.46, mean r2 of null distribution = 0.30, Wilcoxon Mann-Whitney P-Value = 6.3 × 10⁻⁸).
Differential gene expression between tissue sample types
influences cis-eQTL detection
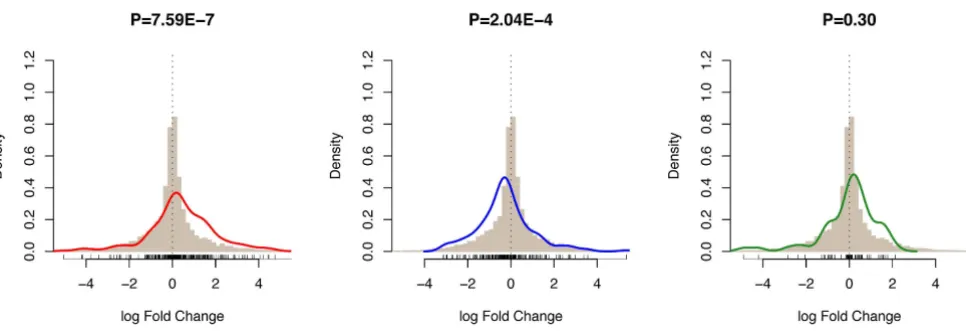
To enable a comparison of gene expression levels between the HapMap B cell line samples and the celiac peripheral blood samples, we limited our analysis to 12,401
tran-scripts that map to identical exons. The expression levels for these transcripts were quantile normalized. cis-eQTLs that have only been significantly detected in the celiac peripheral blood dataset, reflect probes that on average show higher expression in the celiac peripheral blood samples compared to HapMap B cell line samples (Wil-coxon Signed-Ranks test, P = 7.6 × 10⁻⁷) (see Figure 3). Conversely, probes that comprised HapMap B cell line specific cis-eQTLs were higher expressed than within the celiac peripheral blood dataset (P = 2.0 × 10⁻⁴). As expected, probes that comprised cis-eQTLs that were com-mon to both data sets did not show differences in expres-sion (P = 0.30). Noteworthy is that IL18RAP and CCR3, both recently identified as being genetically associated with celiac disease [21], exhibited significant cis -regula-tion in the celiac peripheral blood dataset but not in the HapMap B cell line dataset. Cis-effects for these two genes could be detected as these two genes showed markedly upregulated expression in the celiac peripheral blood dataset (expression rank order 12,072 vs. 6,431 and 11,104 vs. 3,602, respectively). These results indicate that Cumulative genomic distance distribution between SNP and probe midpoint for significant cis-eQTLs (FDR = 0.01, SNP-probe midpoint distance < 500 kb) in celiac peripheral blood samples
Figure 1
the analysis of different cell types is valuable to gain insight in the potential functional consequences of dis-ease associated genetic variants.
Overrepresented biological pathways
The genes, comprising the significant cis-eQTLs (distance 250 kb, FDR = 0.05), showed an overrepresentation of hydrolase and transferase functions for both datasets, but 'immunity and defense' cis-eQTLs genes were more pre-dominantly detected in the celiac disease peripheral blood dataset than in the HapMap B cell line dataset (see Additional file 2), as might be expected from the differen-tial RNA profiles of the cells under investigation in each dataset.
Significant opposite allelic directions for probes, mapping within the same genes
The observed concordance in allelic direction for the 135 significant SNP-probe effects, detected in both the 110
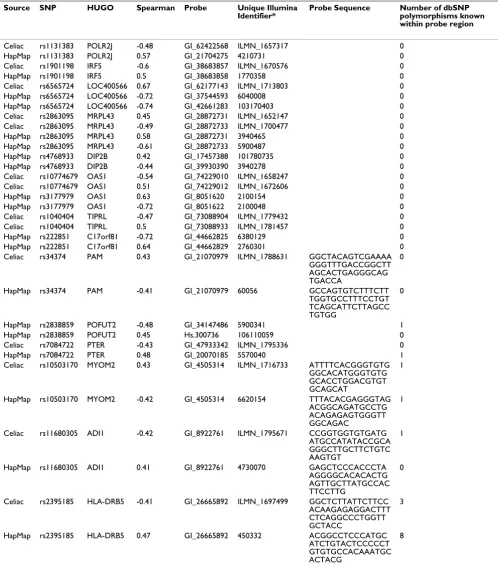
celiac peripheral blood and the 90 HapMap B cell line samples was perfect when probe sequences were identical. We also assessed whether the allelic directions for cis -eQTLs probes was the same when multiple significant cis -eQTL probes mapped within the same genes. We identi-fied 14 genes (see Table 2) where this was not the case: sig-nificant cis-eQTL probes with different oligonucleotide sequences mapped to the same genes but showed oppo-site allelic directions. For three of the genes, MRPL43, OAS1 and TIPRL, we re-sequenced the probe regions in four, four and three individuals with different genotypes, respectively, and did not discover any polymorphisms, confirming that these cis-eQTLs do not result from artifi-cial hybridization differences.
Identification of trans effects and conditioned
co-expression analysis
We used the celiac disease dataset to assess whether signif-icant trans-eQTLs could be identified (Spearman's rank Summary of meta-analysis of 4,681 identical probes between the celiac peripheral blood and HapMap B cell line data sets (at an FDR = 0.05, SNP-probe midpoint distance < 250 kb)
Figure 2
correlation test P-Value < 1 × 10-12, FDR = 0.05). Two
trans-eQTLs were detected: rs2318331 (mapping within
COL22A1) with GI_48093066 (NBPF3) and rs12634559 (mapping downstream of IL1RAP) with GI_16306505 (CASP8AP2). However, these trans-eQTLs were not detected in the HapMap B cell line dataset, even after relaxing the nominal Spearman rank correlation P-value to 0.05.
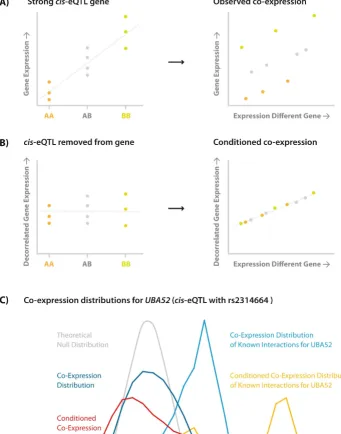
As trans-eQTLs implicate (direct or indirect) biological relationships, it is somewhat disappointing that none were clearly identified. An alternative way to identify bio-logical relationships is by using co-expression analysis (although such an analysis does not have the aim to iden-tify or explain trans-eQTLs). We conducted such a co-expression analysis and compared it to a co-co-expression analysis that also takes the genetic variation into account. First, co-expression was assessed between each of the probes that constitute cis-eQTLs (SNP-probe midpoint distance < 250 kb, FDR = 0.05) and all other probes (Fig-ure 4a) that do not map to the same chromosome, by cal-culating all pair-wise Spearman correlation coefficients. This resulted in 13,003,505 and 42,270,807 pair-wise tests for the celiac peripheral blood dataset (using 765 dif-ferent cis-probes) and the HapMap B cell line dataset (using 994 different cis-probes), respectively. Through Bonferroni correction we accounted for multiple testing, resulting in the identification of 50,821 and 168,292 sig-nificantly correlated transcript-pairs respectively (Spear-man's correlation test P-Value < 0.05 after multiple testing correction).
Subsequently, we redid this co-expression analysis after having removed the genotypic effect on the probe inten-sity level for the probes that constitute the significant cis -eQTLs (Figure 4b). We observed a considerably increased number of significantly correlated transcript-pairs: 54,773 (an increase of 7.8%) and 258,874 (an increase of 53.8%), respectively.
To validate whether this increase in co-expressed tran-scripts reflects known biology, we assessed a collection of 80,350 known biological interactions (derived on 17 April 2007 from KEGG [33], BioGrid [34], Reactome [35], BIND [36], HPRD [37] and IntAct [38]). For the celiac peripheral blood dataset 91 of the 50,821 (0.179%) significantly correlated transcript-pairs that had been identified in the unconditioned co-expression analysis are known to interact. In the conditioned co-expression analysis 106 of the 54,773 (0.194%) tran-script pairs were known to interact, indicating an 8.0% increase in the proportion of known biological interac-tions that was identified. Comparable results were obtained for the HapMap B cell line dataset: For the unconditioned co-expression analysis 334 of the 168,292 (0.195%) significant transcript-pairs are known to interact. In the conditioned co-expression analysis 634 of the 258.874 (0.245%) significant transcript-pairs are known to biologically interact, representing an increase of 23.4% in the proportion of known interac-tions among the most significantly co-expressed tran-script-pairs.
Differential Gene Expression between tissue types results in differential cis-eQTL detection Differential gene expression between the celiac dataset and the HapMap dataset is represented as a histogram of log fold change
Figure 3
Table 2: Genes containing multiple probes that are affected by SNPs that also affect other probes in the same gene, but with opposite allelic directions
Source SNP HUGO Spearman Probe Unique Illumina Identifier*
Probe Sequence Number of dbSNP polymorphisms known within probe region
Celiac rs1131383 POLR2J -0.48 GI_62422568 ILMN_1657317 0
HapMap rs1131383 POLR2J 0.57 GI_21704275 4210731 0
Celiac rs1901198 IRF5 -0.6 GI_38683857 ILMN_1670576 0
HapMap rs1901198 IRF5 0.5 GI_38683858 1770358 0
Celiac rs6565724 LOC400566 0.67 GI_62177143 ILMN_1713803 0
HapMap rs6565724 LOC400566 -0.72 GI_37544593 6040008 0
HapMap rs6565724 LOC400566 -0.74 GI_42661283 103170403 0
Celiac rs2863095 MRPL43 0.45 GI_28872731 ILMN_1652147 0
Celiac rs2863095 MRPL43 -0.49 GI_28872733 ILMN_1700477 0
HapMap rs2863095 MRPL43 0.58 GI_28872731 3940465 0
HapMap rs2863095 MRPL43 -0.61 GI_28872733 5900487 0
HapMap rs4768933 DIP2B 0.42 GI_17457388 101780735 0
HapMap rs4768933 DIP2B -0.44 GI_39930390 3940278 0
Celiac rs10774679 OAS1 -0.54 GI_74229010 ILMN_1658247 0
Celiac rs10774679 OAS1 0.51 GI_74229012 ILMN_1672606 0
HapMap rs3177979 OAS1 0.63 GI_8051620 2100154 0
HapMap rs3177979 OAS1 -0.72 GI_8051622 2100048 0
Celiac rs1040404 TIPRL -0.47 GI_73088904 ILMN_1779432 0
Celiac rs1040404 TIPRL 0.5 GI_73088933 ILMN_1781457 0
HapMap rs222851 C17orf81 -0.72 GI_44662825 6380129 0
HapMap rs222851 C17orf81 0.64 GI_44662829 2760301 0
Celiac rs34374 PAM 0.43 GI_21070979 ILMN_1788631 GGCTACAGTCGAAAA GGGTTTGACCGGCTT AGCACTGAGGGCAG TGACCA
0
HapMap rs34374 PAM -0.41 GI_21070979 60056 GCCAGTGTCTTTCTT
TGGTGCCTTTCCTGT TCAGCATTCTTAGCC TGTGG
0
HapMap rs2838859 POFUT2 -0.48 GI_34147486 5900341 1
HapMap rs2838859 POFUT2 0.45 Hs.300736 106110059 0
Celiac rs7084722 PTER -0.43 GI_47933342 ILMN_1795336 0
HapMap rs7084722 PTER 0.48 GI_20070185 5570040 1
Celiac rs10503170 MYOM2 0.43 GI_4505314 ILMN_1716733 ATTTTCACGGGTGTG GGCACATGGGTGTG GCACCTGGACGTGT GCAGCAT
1
HapMap rs10503170 MYOM2 -0.42 GI_4505314 6620154 TTTACACGAGGGTAG ACGGCAGATGCCTG ACAGAGAGTGGGTT GGCAGAC
1
Celiac rs11680305 ADI1 -0.42 GI_8922761 ILMN_1795671 CCGGTGGTGTGATG ATGCCATATACCGCA GGGCTTGCTTCTGTC AAGTGT
1
HapMap rs11680305 ADI1 0.41 GI_8922761 4730070 GAGCTCCCACCCTA
AGGGGCACACACTG AGTTGCTTATGCCAC TTCCTTG
0
Celiac rs2395185 HLA-DRB5 -0.41 GI_26665892 ILMN_1697499 GGCTCTTATTCTTCC ACAAGAGAGGACTTT CTCAGGCCCTGGTT GCTACC
3
HapMap rs2395185 HLA-DRB5 0.47 GI_26665892 450332 ACGGCCTCCCATGC ATCTGTACTCCCCCT GTGTGCCACAAATGC ACTACG
8
Figure 4c provides an example for Ubiquitin (UBA52), for
which a strong cis-eQTL was observed for probe
GI_15451941 with rs2314664 (Spearman's correlation coefficient P-Value = 1.11 × 10⁻¹⁶) in the HapMap B cell line dataset. Within this probe three other polymorphism map (rs6554, rs34040670 and rs3209501), of which rs6554 is in near perfect LD with rs2314664 (r2 = 0.98, HapMap CEU population), suggesting this cis-eQTL does not reflect a real expression difference, but rather a differ-ence in hybridization efficacy. Co-expression with other genes is already present in an unconditioned co-expres-sion analysis, because the distribution of co-expresco-expres-sion for UBA52 with all other genes differs significantly from a theoretical null-distribution (Wilcoxon-Mann Whitney P-Value < 1 × 10-12). However, in the conditioned co-expres-sion analysis, this difference is more pronounced (see fig-ure 4c). When confining this analysis to a set of 156 known interactions for UBA52, overall co-expression was significantly stronger for these pairs of genes in the condi-tioned (mean absolute Spearman's correlation coefficient = 0.39) than in the unconditioned co-expression analysis (mean absolute Spearman's correlation coefficient = 0.20, Wilcoxon-Mann Whitney P-Value < 10-50).
Discussion
We have demonstrated the use of peripheral blood RNA samples for the detection of cis-eQTLs and have shown that there is strong allelic concordance with cis-eQTLs that also had been detected in a HapMap B cell line dataset. These results indicate that a meta-analysis with larger sam-ple size and hence statistical power results in a considera-ble increase in the detected cis-eQTL even though the arrays that had been used were different. Some cis-eQTLs can be observed across multiple tissue types, in all cases in the same allelic direction, suggesting a major conserved function. However most of the detected cis-eQTLs in these datasets were only detected in one of the two tissues, sug-gesting that more insight can be gained in the functional consequences of genetic variation by performing genetical genomics studies using different types of cells and tissues. This point is particularly relevant for identifying the func-tion of risk variants for common diseases: for example study immune tissues for immune-mediated diseases, adi-pose tissue for obesity traits [8], brain tissue for neurolog-ical traits [10]. Genetneurolog-ical genomics experiments performed in outbred human populations are addition-ally complex and in addition to tissue specific RNA pro-files, care should be taken to investigate alternative RNA sequence events, primer polymorphisms that generate false eQTLs and strong cis-eQTLs that obscure weaker trans
effects.
It is attractive to assume most of the observed cis-eQTLs reflect overall gene expression level alterations. However, we did observe 14 genes (Table 2) where different probes showed significant opposite allelic effects. For at least five
out of the 14 genes (POFUT2, PTER, MYOM2, ADI1 and
HLA-DRB5) polymorphisms within the probe are known to exist in dbSNP. For each of these genes, it may be that one cis-eQTL for instance reflects a real expression differ-ence, whereas the other reflects a hybridization effect due to the presence of these SNPs within the probe. However, recently Kwan et al [39] provided another potential expla-nation, as they showed for three of the 14 genes (IRF5, MRPL43 and PTER), using Affymetrix GeneChip Human Exon 1.0 ST Arrays, that different genetic variants can result in premature 3' termination events. The SNPs that make up these cis-eQTLs are all in strong linkage disequi-librium with the SNPs Kwan et al described (IRF5: rs7808907 and rs6969930: D' = 1, R2 = 0.74 rs2863095, MRPL43: rs2863095 and rs12241232: D' = 0.89, R2 = 0.75, PTER: rs7909832 and rs1055340: D' = 1, R2 = 1), supporting our observations. Kwan et al examined differ-ent exonic effects through an independdiffer-ent validation using quantitative RT-PCR (out of a total of 25 validated genes) and estimated that only 39% of the detected
cis-eQTLs influence overall gene expression levels. For the remaining cis-eQTLs genetic variation results in prelimi-nary terminated transcripts (18%), not initiated tran-scripts (11%), trantran-scripts that are spliced differentially (26%) or a combination of these (6%). We acknowledge that our use of oligonucleotide arrays, predominantly tar-geting the 3' end of genes, gives a more limited picture of splicing since only 3' termination events can be seen. However, the data presented above and alluded to by Kwan et al [39] suggest that SNP genotypes can have a sig-nificant effect on alternatively spliced transcript isoforms. This additional layer of complexity should be examined in future genetical genomics experiments to fully elucidate the genotypic effects on RNA.
Although the two trans-effects identified (IL1RAP and
CASP8AP2) are interestingly both involved in an apopto-sis pathway, these trans-eQTLs were not detected in the HapMap B cell line dataset. These trans-eQTL results are in strong contrast to the number of cis-eQTLs we detected within the two data sets. This results primarily from the limited statistical power to detect trans-eQTLs, due to the number of statistical tests that need to be performed. Additionally, in order to cause a trans-effect, more inter-mediate biological steps are required that introduces addi-tional biological noise, lessening the correlation between genotype and trans-gene expression. Cis-eQTLs can have a significant impact on the co-expression of genes; this gen-otypic variation may hinder the identification of signifi-cant trans effects. This adds an additional layer of complexity to the analysis of genotypic effects on gene expression in outbred populations.
Cis-effects obscure detection of co-expression with other genes a) Co-expression for significant cis-eQTLs was determined; resulting in the identification of co-expression pairs with generally low absolute correlation coefficients b) Through removal of the genotypic effect on the cis-eQTL probe, for some cis-eQTLs strong co-expression can be more easily detected
Figure 4
help to uncover these: We have shown that more known biological relationships can be identified when using genetical genomics to perform co-expression analyses that have been conditioned on genotype. An explanation for this observation is that cis-eQTLs sometimes convolute co-expression, as is exemplified for UBA52, where primer polymorphisms probably affect hybridization characteris-tics.
Conclusion
This study shows that PAXgene isolated peripheral blood RNA is a powerful resource for investigating functional consequences of genetic variation. We have shown that for some of the cis-eQTLs the functional consequences are more complex than previously assumed. Additionally, these findings imply that biological relationships can be extracted in outbred populations, although in a somewhat different manner than what is commonly used to detect biological relationships through trans-eQTLs in inbred model organisms.
As this study has only combined genetics with genomics, we envision more extensive integrative approaches, incor-porating e.g. epigenetics and proteomics, will help to improve the detection of previously unknown biological pathways.
Abbreviations
SNP: Single Nucleotide Polymorphisms; eQTL: Expres-sion Quantitative Trait Locus
Competing interests
The authors declare that they have no competing interests.
Authors' contributions
LCD and DVH collected patient samples. GH extracted RNA and performed microarray experiments assisted by MB. LF, RCJ, GH, CW and DVH designed the experi-ment. KH undertook the genotyping. LF and GH per-formed the data analysis assisted by RCJ and MAS. Sequencing was carried out by GT. GH and LF drafted the manuscript. All authors read and approved the final manuscript.
Additional material
Acknowledgements
We thank UK clinicians who collected samples, and sample donors. We thank Erik Sluiters for mapping all probe identifiers. Some statistical analy-ses were performed using the Genetic Cluster Computer in Amsterdam http://www.geneticcluster.org, which is financially supported by the Neth-erlands Organization, for Scientific Organization (NWO, grant 480-05-003). We acknowledge funding from Coeliac UK (to D.A.v.H); the Nether-lands Organization for Scientific Research (NWO, VICI grant 918-66-620 to C.W.); the Celiac Disease Consortium (an innovative cluster approved by the Netherlands Genomics Initiative and partly funded by the Dutch gov-ernment (grant BSIK03009 to C.W.)); the Netherlands Genomics Initiative (grant 050-72-425 and fellowship grant to L.F.); the Wellcome Trust (GR068094MA Clinician Scientist Fellowship to D.A.v.H.)
References
1. Dixon AL, Liang L, Moffatt MF, Chen W, Heath S, Wong KC, Taylor J, Burnett E, Gut I, Farrall M, Lathrop GM, Abecasis GR, Cookson WO: A genome-wide association study of global gene expres-sion. Nature genetics 2007, 39(10):1202-1207.
2. Goring HH, Curran JE, Johnson MP, Dyer TD, Charlesworth J, Cole SA, Jowett JB, Abraham LJ, Rainwater DL, Comuzzie AG, Mahaney MC, Almasy L, MacCluer JW, Kissebah AH, Collier GR, Moses EK, Blangero J: Discovery of expression QTLs using large-scale transcriptional profiling in human lymphocytes. Nature genet-ics 2007, 39(10):1208-1216.
3. Stranger BE, Forrest MS, Clark AG, Minichiello MJ, Deutsch S, Lyle R, Hunt S, Kahl B, Antonarakis SE, Tavare S, Deloukas P, Dermitzakis ET: Genome-wide associations of gene expression variation in humans. PLoS genetics 2005, 1(6):e78.
4. Stranger BE, Forrest MS, Dunning M, Ingle CE, Beazley C, Thorne N, Redon R, Bird CP, de Grassi A, Lee C, Tyler-Smith C, Carter N, Scherer SW, Tavare S, Deloukas P, Hurles ME, Dermitzakis ET: Rel-ative impact of nucleotide and copy number variation on gene expression phenotypes. Science 2007, 315(5813):848-853. 5. Cheung VG, Conlin LK, Weber TM, Arcaro M, Jen KY, Morley M, Spielman RS: Natural variation in human gene expression assessed in lymphoblastoid cells. Nature genetics 2003, 33(3):422-425.
6. Jansen RC, Nap JP: Genetical genomics: the added value from segregation. Trends Genet 2001, 17(7):388-391.
7. Alberts R, Fu J, Swertz MA, Lubbers LA, Albers CJ, Jansen RC: Com-bining microarrays and genetic analysis. Briefings in bioinformat-ics 2005, 6(2):135-145.
8. Emilsson V, Thorleifsson G, Zhang B, Leonardson AS, Zink F, Zhu J, Carlson S, Helgason A, Walters GB, Gunnarsdottir S, Mouy M, Steinthorsdottir V, Eiriksdottir GH, Bjornsdottir G, Reynisdottir I, Gudbjartsson D, Helgadottir A, Jonasdottir A, Jonasdottir A, Sty-rkarsdottir U, Gretarsdottir S, Magnusson KP, Stefansson H, Fossdal R, Kristjansson K, Gislason HG, Stefansson T, Leifsson BG, Thorsteinsdottir U, Lamb JR: Genetics of gene expression and its effect on disease. Nature 2008, 452(7186):423-428.
9. Birney E, Stamatoyannopoulos JA, Dutta A, Guigo R, Gingeras TR, Margulies EH, Weng Z, Snyder M, Dermitzakis ET, Thurman RE, Kuehn MS, Taylor CM, Neph S, Koch CM, Asthana S, Malhotra A, Adzhubei I, Greenbaum JA, Andrews RM, Flicek P, Boyle PJ, Cao H,
Additional file 1
All detected cis-eQTLs. All detected cis-eQTLs in celiac peripheral blood and HapMap datasets 250 kb and 500 kb from the hybridiza-tion probe midpoint
Click here for file
[http://www.biomedcentral.com/content/supplementary/1755-8794-2-1-S1.xls]
Additional File 2
Biological processes and functions for the detected cis-eQTLs. Listed are significantly over- and underrepresented biological processes and func-tions for the detected cis-eQTLs (FDR = 0.05, SNP-probe midpoint dis-tance < 250 kb), derived through the Panther Classification System (Binomial test, Bonferroni corrected)
Click here for file
Carter NP, Clelland GK, Davis S, Day N, Dhami P, Dillon SC, Dor-schner MO, Fiegler H: Identification and analysis of functional elements in 1% of the human genome by the ENCODE pilot project. Nature 2007, 447(7146):799-816.
10. Myers AJ, Gibbs JR, Webster JA, Rohrer K, Zhao A, Marlowe L, Kal-eem M, Leung D, Bryden L, Nath P, Zismann VL, Joshipura K, Huen-telman MJ, Hu-Lince D, Coon KD, Craig DW, Pearson JV, Holmans P, Heward CB, Reiman EM, Stephan D, Hardy J: A survey of genetic human cortical gene expression. Nature genetics 2007, 39(12):1494-1499.
11. Keurentjes JJ, Fu J, de Vos CH, Lommen A, Hall RD, Bino RJ, Plas LH van der, Jansen RC, Vreugdenhil D, Koornneef M: The genetics of plant metabolism. Nature genetics 2006, 38(7):842-849. 12. Keurentjes JJ, Fu J, Terpstra IR, Garcia JM, Ackerveken G van den,
Snoek LB, Peeters AJ, Vreugdenhil D, Koornneef M, Jansen RC: Reg-ulatory network construction in Arabidopsis by using genome-wide gene expression quantitative trait loci. Proceed-ings of the National Academy of Sciences of the United States of America
2007, 104(5):1708-1713.
13. Petretto E, Mangion J, Dickens NJ, Cook SA, Kumaran MK, Lu H, Fischer J, Maatz H, Kren V, Pravenec M, Hubner N, Aitman TJ: Her-itability and tissue specificity of expression quantitative trait loci. PLoS genetics 2006, 2(10):e172.
14. Schadt EE, Monks SA, Drake TA, Lusis AJ, Che N, Colinayo V, Ruff TG, Milligan SB, Lamb JR, Cavet G, Linsley PS, Mao M, Stoughton RB, Friend SH: Genetics of gene expression surveyed in maize, mouse and man. Nature 2003, 422(6929):297-302.
15. Hubner N, Wallace CA, Zimdahl H, Petretto E, Schulz H, Maciver F, Mueller M, Hummel O, Monti J, Zidek V, Musilova A, Kren V, Causton H, Game L, Born G, Schmidt S, Muller A, Cook SA, Kurtz TW, Whit-taker J, Pravenec M, Aitman TJ: Integrated transcriptional profil-ing and linkage analysis for identification of genes underlyprofil-ing disease. Nature genetics 2005, 37(3):243-253.
16. Greco L, Romino R, Coto I, Di Cosmo N, Percopo S, Maglio M, Paparo F, Gasperi V, Limongelli MG, Cotichini R, D'Agate C, Tinto N, Sacchetti L, Tosi R, Stazi MA: The first large population based twin study of coeliac disease. Gut 2002, 50(5):624-628. 17. van Heel DA, Hunt K, Greco L, Wijmenga C: Genetics in coeliac
disease. Best Pract Res Clin Gastroenterol 2005, 19(3):323-39. 18. Karell K, Louka AS, Moodie SJ, Ascher H, Clot F, Greco L, Ciclitira PJ,
Sollid LM, Partanen J: HLA types in celiac disease patients not carrying the DQA1*05-DQB1*02 (DQ2) heterodimer: results from the European Genetics Cluster on Celiac Dis-ease. Human immunology 2003, 64(4):469-477.
19. Nistico L, Fagnani C, Coto I, Percopo S, Cotichini R, Limongelli MG, Paparo F, D'Alfonso S, Giordano M, Sferlazzas C, Magazzu G, Momigliano-Richiardi P, Greco L, Stazi MA: Concordance, disease progression, and heritability of coeliac disease in Italian twins. Gut 2006, 55(6):803-808.
20. van Heel DA, Franke L, Hunt KA, Gwilliam R, Zhernakova A, Inouye M, Wapenaar MC, Barnardo MC, Bethel G, Holmes GK, Feighery C, Jewell D, Kelleher D, Kumar P, Travis S, Walters JR, Sanders DS, Howdle P, Swift J, Playford RJ, McLaren WM, Mearin ML, Mulder CJ, McManus R, McGinnis R, Cardon LR, Deloukas P, Wijmenga C: A genome-wide association study for celiac disease identifies risk variants in the region harboring IL2 and IL21. Nature genetics 2007, 39(7):827-829.
21. Hunt KA, Zhernakova A, Turner G, Heap GA, Franke L, Bruinenberg M, Romanos J, Dinesen LC, Ryan AW, Panesar D, Gwilliam R, Takeuchi F, McLaren WM, Holmes GK, Howdle PD, Walters JR, Sanders DS, Playford RJ, Trynka G, Mulder CJ, Mearin ML, Verbeek WH, Trimble V, Stevens FM, O'Morain C, Kennedy NP, Kelleher D, Pennington DJ, Strachan DP, McArdle WL: Newly identified genetic risk variants for celiac disease related to the immune response. Nature genetics 2008, 40(4):395-402.
22. Potokina E, Druka A, Luo Z, Wise R, Waugh R, Kearsey M: Gene expression quantitative trait locus analysis of 16 000 barley genes reveals a complex pattern of genome-wide transcrip-tional regulation. Plant J 2008, 53(1):90-101.
23. Hubbard TJ, Aken BL, Beal K, Ballester B, Caccamo M, Chen Y, Clarke L, Coates G, Cunningham F, Cutts T, Down T, Dyer SC, Fitzgerald S, Fernandez-Banet J, Graf S, Haider S, Hammond M, Herrero J, Holland R, Howe K, Howe K, Johnson N, Kahari A, Keefe D, Kokocinski F, Kulesha E, Lawson D, Longden I, Melsopp C, Megy K: Ensembl 2007. Nucleic Acids Res 2007:D610-617.
24. Bolstad BM, Irizarry RA, Astrand M, Speed TP: A comparison of normalization methods for high density oligonucleotide array data based on variance and bias. Bioinformatics (Oxford, England) 2003, 19(2):185-193.
25. Hochberg Y, Benjamini Y: More powerful procedures for multi-ple significance testing. Statistics in medicine 1990, 9(7):811-818. 26. Steemers FJ, Gunderson KL: Whole genome genotyping
tech-nologies on the BeadArray platform. Biotechnology journal 2007, 2(1):41-49.
27. Mi H, Guo N, Kejariwal A, Thomas PD: PANTHER version 6: pro-tein sequence and function evolution data with expanded representation of biological pathways. Nucleic Acids Res
2007:D247-252.
28. Hunt KA, Zhernakova A, Turner G, Heap GA, Franke L, Bruinenberg M, Romanos J, Dinesen LC, Ryan AW, Panesar D, Gwilliam R, Takeuchi F, McLaren WM, Holmes GK, Howdle PD, Walters JR, Sanders DS, Playford RJ, Trynka G, Mulder CJ, Mearin ML, Verbeek WH, Trimble V, Stevens FM, O'Morain C, Kennedy NP, Kelleher D, Pennington DJ, Strachan DP, McArdle WL: Newly identified genetic risk variants for celiac disease related to the immune response. Nat Genet 2008, 40(4):395-402.
29. van Heel DA, West J: Recent advances in coeliac disease. Gut
2006, 55(7):1037-1046.
30. Anderson RP, van Heel DA, Tye-Din JA, Barnardo M, Salio M, Jewell DP, Hill AV: T cells in peripheral blood after gluten challenge in coeliac disease. Gut 2005, 54(9):1217-1223.
31. Ciclitira PJ, Ellis HJ: In vivo gluten ingestion in coeliac disease.
Digestive diseases (Basel, Switzerland) 1998, 16(6):337-340.
32. Alberts R, Terpstra P, Li Y, Breitling R, Nap JP, Jansen RC: Sequence polymorphisms cause many false cis eQTLs. PLoS ONE 2007, 2(7):e622.
33. Kanehisa M, Goto S, Kawashima S, Okuno Y, Hattori M: The KEGG resource for deciphering the genome. Nucleic acids research
2004:D277-280.
34. Breitkreutz BJ, Stark C, Reguly T, Boucher L, Breitkreutz A, Livstone M, Oughtred R, Lackner DH, Bahler J, Wood V, Dolinski K, Tyers M: The BioGRID Interaction Database: 2008 update. Nucleic acids research 2008:D637-640.
35. Vastrik I, D'Eustachio P, Schmidt E, Joshi-Tope G, Gopinath G, Croft D, de Bono B, Gillespie M, Jassal B, Lewis S, Matthews L, Wu G, Bir-ney E, Stein L: Reactome: a knowledge base of biologic path-ways and processes. Genome biology 2007, 8(3):R39.
36. Alfarano C, Andrade CE, Anthony K, Bahroos N, Bajec M, Bantoft K, Betel D, Bobechko B, Boutilier K, Burgess E, Buzadzija K, Cavero R, D'Abreo C, Donaldson I, Dorairajoo D, Dumontier MJ, Dumontier MR, Earles V, Farrall R, Feldman H, Garderman E, Gong Y, Gonzaga R, Grytsan V, Gryz E, Gu V, Haldorsen E, Halupa A, Haw R, Hrvojic A: The Biomolecular Interaction Network Database and related tools 2005 update. Nucleic acids research 2005:D418-424. 37. Mishra GR, Suresh M, Kumaran K, Kannabiran N, Suresh S, Bala P, Shi-vakumar K, Anuradha N, Reddy R, Raghavan TM, Menon S, Hanuman-thu G, Gupta M, Upendran S, Gupta S, Mahesh M, Jacob B, Mathew P, Chatterjee P, Arun KS, Sharma S, Chandrika KN, Deshpande N, Pal-vankar K, Raghavnath R, Krishnakanth R, Karathia H, Rekha B, Nayak R, Vishnupriya G: Human protein reference database – 2006 update. Nucleic acids research 2006:D411-414.
38. Kerrien S, Alam-Faruque Y, Aranda B, Bancarz I, Bridge A, Derow C, Dimmer E, Feuermann M, Friedrichsen A, Huntley R, Kohler C, Khadake J, Leroy C, Liban A, Lieftink C, Montecchi-Palazzi L, Orchard S, Risse J, Robbe K, Roechert B, Thorneycroft D, Zhang Y, Apweiler R, Hermjakob H: IntAct – open source resource for molecular interaction data. Nucleic acids research 2007:D561-565.
39. Kwan T, Benovoy D, Dias C, Gurd S, Provencher C, Beaulieu P, Hud-son TJ, Sladek R, Majewski J: Genome-wide analysis of transcript isoform variation in humans. Nature genetics 2008.
Pre-publication history
The pre-publication history for this paper can be accessed here: