R E S E A R C H
Open Access
Bacterial microbiota protect an invasive
bark beetle from a pine defensive
compound
Chihang Cheng
1,3†, Jacob D Wickham
1†, Li Chen
1,2, Dandan Xu
1, Min Lu
1*and Jianghua Sun
1,2*Abstract
Background:There is growing evidence that some devastating biotic invasions are facilitated by microbial
symbionts. The red turpentine beetle (RTB), an innocuous secondary insect attacking weakened trees in North America, has formed an invasive complex with the fungus Leptographium procerum in China, and this invasive beetle-fungus symbiotic complex is capable of attacking and killing healthy pines. A previous study demonstrated that three Chinese-resident fungi, newly acquired by RTB in China, induce high levels of a phenolic defensive chemical, naringenin, in pines and this invasive beetle-fungus complex is suppressed by elevated levels of naringenin while the beetle uses its gallery as an external detoxification system in which particular yeast-like fungi and bacterial species biodegrade naringenin. However, the functional roles of key microbial players in the symbiosis, contained within the microbiome of the bark beetle gallery, have not been well elucidated.
Results:In this report, the symbiotic naringenin-degrading microbiota were found to increase RTB survivorship in the presence of induced host defenses, and potential genes associated with degradation pathways were discovered. While fungi in the gallery microbiota had little involvement in naringenin degradation, bacterial community structure within the beetle gallery was highly correlated to naringenin degrading activity. Phylotypes of the Gram-negative bacterial genus Novosphingobium, which possessed genes involved in degradation pathways, were highly correlated to naringenin degradation activities and RTB associated with an isolated species of this genus acquired protection against naringenin and gained fitness.
Conclusions:Our results demonstrated that symbiotic bacterial community of RTB galleries enhances the
survivorship and overall fitness of invasive beetles by degrading the host phenolic naringenin, ultimately overcoming the tree defenses and facilitating the success of the invasive beetle-fungi complex. This dynamic interplay between the invasive insect pest and multipartite microbes suggests a putative mechanism in invasion ecology for mitigating biotic resistance to symbiotic invasion.
Keywords:Community structure, Biodegradation, Biological invasion, Symbiotic microbiota, Protection, Pyrosequencing
Background
Invasive species change and disrupt global ecosystems [1, 2]. Among the many mechanisms underlying rapid adaptation and range expansion by invasive species, the positive feedback interactions with symbiotic microbes have been recognized to be of prevailing importance [3,4]. The
extended functional traits provided by symbiotic microbes contribute to the competitiveness and fitness of their inva-sive hosts. These traits, as part of extended phenotypes for some exotic plants and animals, have been attributed to particular symbiotic microbes [5, 6]. For example, the endophytic fungusNeotyphodium coenophialumin the in-vasive grassLolium arundinaceumconfers herbivore resist-ance for the host plant in its introduced range in the USA [7,8]; fungal endophytesAlternariaspp. in the invasive forb Centaurea stoebe increase host competitive ability against North American native grasses [9]; an endosymbiotic bac-terium in the genus Rickettsia improves reproduction in * Correspondence:[email protected];[email protected]
†Chihang Cheng and Jacob D Wickham contributed equally to this work.
1State Key Laboratory of Integrated Management of Pest Insects and
Rodents, Institute of Zoology, Chinese Academy of Sciences, 1 Beichen West Road, Chaoyang District, Beijing 100101, China
Full list of author information is available at the end of the article
the invasive whitefly (Bemisia tabaci) [10]; and microspori-dia in the invasive ladybirdHarmonia axyridisare involved in killing off native competitors in Europe [11].
Microbes that function to increase fitness of invaders reside alongside microbes with unknown functions or those that opportunistically colonize a variety of envir-onmental habitats [12, 13]. Rhizospheres and roots of exotic plants and the living nests, bodies, and guts of exotic insects are well-known microhabitats colonized by various bacterial and fungal members [14–18]. These co-occurring microbes compose symbiotic microbiota that provide benefits for invasive species [19–21]. The community structure, composition, and expression pro-files, however, can change over time or in response to bi-otic and abibi-otic events, making it difficult to identify functional microbes without considering the dynamic interplay of microbes in the communities. Therefore, it is crucial to elucidate the key players of symbiotic micro-biota that are involved in facilitating successful inva-sions, from the community level down to the particular taxon or taxa directly involved. While much work has been done to understand the roles of the key symbiotic microbiota, there are still many knowledge gaps.
The red turpentine beetle (RTB) Dendroctonus valens and Leptographium procerum, the fungus it vectors, were simultaneously introduced from North America to China and act as an invasive beetle-fungus complex that devastates healthy pine forests in its introduced range [22]. L. procerum is significantly pathogenic to Pinus tabuliformis, its host pine tree, and induces it to release high amounts ofΔ-3-carene, a volatile terpenoid which is attractive for the beetle vector [23, 24]. During the inva-sion process, RTB has associated with Chinese-resident fungi which specifically induce a defensive phenolic com-pound naringenin, from the host pine. Naringenin strongly suppresses the invasive beetle-fungus complex [25]. Interestingly, the RTB gallery microenvironment (space between bark and tree wood) with its microbial community serves as an external detoxification system, where the multiple associated yeasts and bacteria help eliminate this harmful compound via biodegradation [25]. L. procerum maintains host pine carbohydrate pinitol for the growth of gallery microbiota and facili-tates naringenin biodegradation by the microbiota, forming a mutualistic relationship between RTB, L. procerum, and gallery microbiota [25].
Although several species of yeasts and bacteria have been isolated and assessed for their naringenin bio-degrading activities, community-level evaluation of nar-ingenin biodegradation function of gallery microbiota is lacking. Thus, it is still unclear which key microbial players actively participate in this key function that could be responsible for the protection of the invasive beetle-fungus complex. In order to explore which
microbes in RTB gallery microbiota play key roles in protecting the invasive beetle through naringenin bio-degradation, we proposed the following hypotheses: first, whether symbiotic naringenin-degrading microbiota in the gallery can protect invasive RTB from naringenin; second, what microbial group(s), either bacteria and/or fungi, correlate(s) to naringenin-biodegrading activity of the gallery community.
Methods
Sample collection
We collected RTB gallery tissues from naturally infestedP. tabuliformistrees at Tunlanchuan Forest Station (37° 48′N, 111° 44′ E; average elevation 1400 m; P. tabuliformis 3278 ha) in Shanxi Province. Gallery samples (ca. 0.5 g in fresh weight) were first homogenized into fine pieces by sterile forceps and scissors and then macerated in 0.5 ml 10% PBS (phosphate-buffered saline) (Sigma) to obtain crude extracts containing microbial cells (gallery microbiota).
Second to third instar RTB larvae were randomly col-lected from beetle galleries of infested host pines at Tun-lanchuan Forest Station. Beetles were surface-sterilized with bleach, ethanol, and distilled water [10:10:80 (vol:-vol)], kept in a climate-controlled incubator (25 ± 1 °C, RH = 70%, darkness) and starved for 24 h before use.
Beetle survivorship bioassay with gallery microbiota
Phloem media (phloem powder 8 g; bacto-agar 2 g; dis-tilled water 60 ml) amended with naringenin (2000μg g−1 of media dry weight) was prepared. The concentration of naringenin in media is comparable to that in host pine induced by Chinese-resident fungi [25]. Naringenin was dissolved in ethyl acetate and mixed into molten media to yield the appropriate percentages by dry mass (microgram of naringenin per gram of dry phloem media). Previous study indicated that RTB survivorship was not impacted by ethyl acetate [25].
Tissue samples from 35 galleries were separately washed using 10% PBS buffer to obtain gallery microbiota, which were added to phloem media in 35-mm-diameter Petri dishes and then mixed well. Control phloem media was mixed with 10% PBS buffer. Each Petri dish contained one larva. Beetles were checked daily for mortality. The sur-vival rate of RTB larvae was calculated by Kaplan-Meier survival analysis, and comparisons between survival curves were further tested by Log Rank (Mantel-Cox) method using GraphPad Prism 6 for statistical analyses (GraphPad Prism Software, Inc., San Diego, CA).
Metagenome sequencing and analysis
eggs, young larvae, older larvae, pupae, teneral adults, and attacking adults from host P. tabuliformis trees at Tunlanchuan Forestry Station (n= 20 for each group). Gallery samples (n= 120) were pooled in a 50-ml tube (BD falcon) and buffered in sterile MilliQ water. The tube was sonicated (50/60 Hz, 117 V, 1.0 A; Branson Ultrasonics, Danbury, CT) for 30 s, macerated with a plastic pestle, and vortexed at medium speed for 10 s to separate microbial cells from the gallery. The slurry-like liquid was filtrated through a 100-μm filter (BD falcon) and rinsed with water at least three times, then trans-ferred into another 50-ml tube.
The filtrate was centrifuged at 200×gfor 5 min at 4 °C. NaCl (at a final concentration of 0.9%) and 10% SDS (at a final concentration of 0.063%) were added to the supernatant followed by incubation at 4 °C for 1 h to ob-tain automatic precipitation. The upper phase was care-fully transferred to a clean bottle while not disturbing the precipitate and filtrated through a 70-μm filter. The filtrate was then centrifuged at 5000×gfor 10 min (4 °C) to collect the pellet, which was resuspended in 400 ml of MilliQ water. The precipitation step was repeated. The final pellet was suspended in 5 ml of 50 mM Tris-HCl (pH 7.5) and filtrated through a 40-μm filter. Five millili-ters of Nycodenz (Nycomed, Oslo, Norway; density approx 1.3 g/ml; 60%w/vin 50 mM Tris-HCl) was care-fully added to 5 ml of the sample (suspension), using a syringe needle of adequate length to reach the bottom of the tube. The sample was then centrifuged in a swing-out rotor (14,000g for 40 min at 4 °C). The cell layer was carefully collected. This cell suspension (ap-proximately 500μl) was mixed with an equal volume of sterile water in a 1.5-ml microtube, centrifuged at 10,000 rpm for 1 min at 4 °C, and used for DNA extrac-tion with Qiagen DNeasy Plant Maxi Kit (Qiagen Sci-ences, Germantown, MD, USA). DNA sequencing was performed using the Illumina Genome Analyzer at the Beijing Genomics Institute (Shenzhen, China).
The raw sequences obtained from the shotgun library were first quality filtered by trimming adapters, remov-ing low-quality reads, and excludremov-ing host contamination. Clean data were then assembled by the SOAP denovo assembler [26], with -d 1 -M 3 -u -F parameters. Differ-ent K-mers (49, 55, 59) were tested, and the value was selected based on the largest N50 of the assembled scaf-folds. Contigs (continuous sequences within scaffolds) more than 500 bp were retained in the final assembly used for further analyses. For functional annotation, MetaGeneMark [27, 28] was employed to predict the ORFs of the assembled contigs. The predicted ORFs were grouped using CD-HIT with the coverage over 90% and minimum identity 95%, and finally, the nonre-dundant unigene set was obtained. Unigenes were used to search against the database including all of the
microbe genome sequences deposited in GenBank by BLASTn, withe-value≤minimale-value × 10 for further analysis [29]. The taxonomic level of each unigene was de-termined by the lowest common ancestor (LCA)-based al-gorithm that was applied in MEGAN [30]. The taxonomic abundance was evaluated by taking a sum of the number of reads from each taxon, which was obtained by mapping all of the reads to the unigene set using SOAPaligner with default parameters [31]. The unigenes were translated into protein sequences using NCBI Genetic Codes. We used BLASTp to search for the protein sequences of the pre-dicted genes in KEGG, eggNOG, and CAZy databases, with e-value ≤1e−5. The genes with KEGG annotation were assigned into KEGG pathways.
Characterization of naringenin-biodegrading activity for gallery microbiota
The galleries of beetles from different developmental stages, including young larvae (n= 7), older larvae (n= 13), pupae (n= 11), teneral adult (n= 10), and attacking adult stages (n= 10), were collected in sterile vials and returned to the lab for experiments. A portion of homogenized gal-lery sample was immediately stored at −80 °C in 2-ml cryovials (Corning, USA) for DNA extraction. The other portion was used to evaluate its naringenin-biodegrading activity. Gallery crude extracts were transferred into 1 ml of inorganic culture solution containing 1 mM naringenin in glass test tubes, sealed by silica gel stoppers and incu-bated for 72 h at 30 °C with shaking (150 rpm). Healthy phloem from six matureP. tabuliformis were set as con-trols and treated the same way as galleries. After 72 h of incubation, remaining quantities of naringenin were de-tected by high-performance liquid chromatography (HPLC) (Agilent, USA) following previously described procedures [32]. The naringenin-biodegrading activity was expressed as micrograms of naringenin degraded by per gram of (dry weight) gallery tissues.
No significant differences were found in naringenin bio-degradation between these stage-grouped galleries, which were all significantly different from healthy phloem (Additional file 1: Figure S1a, F5, 51= 4.319, P= 0.002).
There was obvious individual variation in
naringenin-biodegrading activity for each of the gallery groups, from less than 2000 μg g−1 DW to near 20,000μg g−1DW (Additional file1: Figure S1a). We se-lected 19 gallery samples across the range of this variation and categorized them by activity level [low (< 2000μg g−1 DW; 6 samples), medium (2000–7000μg g−1DW; 6 sam-ples) and high (7000–20,000 μg g−1 DW; 7 samples)] (Additional file1: Figure S1b).
DNA extraction, PCR, and pyrosequencing
using E.Z.N.A. Soil DNA Kit (Omega, Bio-Tek, Norcross, GA, USA) following the manufacturer’s in-structions. The amount of DNA was determined by Qubit Fluorometer (Invitrogen, USA), and the integrity of DNA was checked by 1% (w/v) agarose gel electro-phoresis stained with ethidium bromide. For analysis of the bacterial community, the hypervariable domains V1– V3 of the 16S rDNA gene were amplified using the
primers 27F (5′-AGAGTTTGATCCTGGCTCAG-3′)
and 533R (5′-TTACCGCGGCTGCTGGCAC-3′; [33]). The primers 27F and 533R were modified for 454 pyro-sequencing with titanium chemistry using the final con-figuration Adapter A-MID-533R and Adapter B-27F. MIDs were the sample-unique ten bases and established following the rules described [34]. For analysis of the fungal community, the primer set adapted for pyrose-quencing consisted of Adapter A-MID-ITS 1 (Internal
Transcribed Spacer 1; 5’-TCCGTAGGTGAACC
TGCGG-3′) and Adapter B-ITS 4 (5’-TCCTCCGCT TATTGATATGC-3′). For each sample, triplicate PCR reactions were performed and consisted of 0.4 μl of TransStart FastPfu DNA polymerase (TransGen, Bio-tech, China), 4 μl of 5× FastPfu buffer (TransGen), 2μl of 2.5 mM dNTPs (TransGen), 0.8 μl of 5 μM of each primer, and 10 ng of template DNA. The ddH2O was added to reach the 20μl reactions.
Template DNA from each sample was used for both bacterial and fungal amplifications. For bacteria, PCR in-cubations comprised an initial denaturation step at 95 °C for 2 min, followed by 27 cycles of denaturation at 95 °C for 30 s, annealing at 55 °C for 30 s and extension at 72 °C for 30 s and finalized with a 5-min extension step at 72 °C to ensure complete amplification of the target region. For fungi, cycling parameters were 1 cycle of 95 °C for 2 min, 35 cycles of 95 °C for 30 s, 55 °C for 30 s, and 72 °C for 35 s followed by a final extension at 72 °C for 5 min. Negative controls (blank sample and no template) were included in all steps of the process to check for contamin-ation. After pooling amplicons from the triplicate reac-tions, PCR products were confirmed using 2% agarose gel electrophoresis and cleaned using the AxyPrep DNA Gel Extraction Kit (Axygen Bioscience, CA, USA) following the manufacturer’s instructions. Clean PCR products were quantified using the QuantiFluor dsDNA System kit (Promega) with a QuantiFluor-ST fluorometer. Pyrose-quencing of amplicons, using Titanium Lib-L chemistry, was carried out on a 454 Genome Sequencer FLX (Roche) machine installed at BGI (Shenzhen, China).
Sequence processing
Initial sequence data was processed, assessed for quality, assigned to samples, and analyzed using the QIIME v.1.3.1 software package [35]. Only those reads passing sliding window (50 bp) check (Phred average > 20) with
more than 200 bp in length, and no ambiguous charac-ters were included for analyses. Qualified sequences were clustered into operational taxonomic units (OTUs) at 97% sequence similarity using the UPARSE pipeline of USEARCH [36, 37], a similarity level used for both bac-teria and fungi [38, 39]. Chimeras were screened using the program UCHIME [40] and removed during the clustering process. The most abundant sequence from each OTU was selected as the representative sequence for that OTU within the cluster. The OTU abundance table was constructed by mapping sequences of all sam-ples to the representative OTUs (-usearch_global-strand plus-id 0.97) and applying the uc2otutab.py script. The representative OTUs were assigned taxonomically using the RDP classifier v.2.2 [41] with the SILVA 16S rRNA gene database (v.115) [42] for bacteria and with the UNITE ITS gene database (v.5.0) [43] for fungi. Taxo-nomical assignments with < 70% confidence threshold were marked as unclassified.
Pyrosequencing data analyses
Rarefaction curves generated by the
alpha_rarefac-tion.py workflow script in QIIME were used to test
whether the sequencing efforts adequately represented the bacterial and fungal diversity within each sample. The number of OTUs, Shannon diversity index (H′), Simpson diversity index (1-D), and Buzas and Gibson’s evenness index (eH′/S) of each sample was calculated by PAST software [44] and compared across categories (low/medium/high) of naringenin-biodegrading activity. Relative abundances of different phyla and genera in each sample were calculated and compared between ac-tivity categories using one-way ANOVA (when data were normally distributed) or Kruskal-Wallis test (when data were not normally distributed).
Jaccard distance matrix for samples of presence-absence OTU data were visualized using NMDS (non-metric multidimensional scaling) plots. Composition differences between activity categories were tested using ANOSIM (analysis of similarity; [45]) with 10,000 permutations. To further investigate the correlations of community compos-ition with naringenin-biodegrading activity, Mantel tests were carried out using Jaccard distances calculated for community data and Euclidean distances for the activity data (continuous data) between samples. The signifi-cance of Mantel statisticrwas given after 1000 permu-tations. NMDS and ANOSIM were implemented in PAST, and Mantel tests were run in R software with the package Vegan [46], based on presence-absence OTU data in communities.
analysis) which considers both relative abundance and different branch lengths in a tree, through the online Fast Unifrac program [47]. PERMANOVA tests based on weighted UniFrac distance were run in R software with the package GUniFrac[48]. PCo1 data from PCoA plots were tested for correlation with the activity data. Unifrac distances were measured between all pairs of samples. The links between community compositions and naringenin-biodegrading activity (function) were further determined by PLS (partial least square projec-tion to latent structures) with autoscaling in SIMCA-P v.11.5 (Umetrics, Sweden; [49]). X variables were all OTUs with relative abundances, and the Yvariable (re-sponse variable) was activity of naringenin degradation. Variables that were suggested to need transformation were log-transformed before analysis.
To identify which OTUs were associated with specific activity groups, we used the INDVAL (indicator value) ana-lysis [50] in R with the package Labdsv. Good indicators (OTUs) were those having significant P value (P< 0.05) and IV (indicator value) > 0.3 [50]. The selected OTUs with strong indicator values were used as key variables to test their predictive ability and fitness for naringenin-biodegrading activity by the PLS model in SIMCA-P. OTUs (or variables) applied to these above analyses were relative abundance data.
Anti-fungal and anti-bacterial bioassays
Galleries were macerated in 500 μl of 10% PBS buffer and lightly vortexed to obtain crude extracts that con-tained the microbiota. In the anti-fungal bioassay, crude extracts (100 μl, pipetted from each gallery sample) re-ceived one of the three treatments: 100 μl of (1) 10% PBS (as control), (2) nystatin and cycloheximide (NC), (3) streptomycin, penicillin, nystatin, and cycloheximide (SPNC). Twenty-eight RTB galleries were used. In the anti-bacterial bioassay, crude extract (100 μl pipetted) from gallery samples received one of the four treat-ments: 100 μl of (1) 10% PBS (as control), (2) penicillin (P), (3) streptomycin (S), and (4) streptomycin and peni-cillin (SP). Seventeen RTB galleries were used. The final concentration of antibiotics was 5 mg/ml. Treatment duration was 12 h at 4 °C. Crude extracts were then transferred to 1 ml of 1 mM naringenin solutions, incu-bated for 72 h, and then remaining quantities of narin-genin were determined by HPLC [25]. Effects of anti-fungal or anti-bacterial treatments on the abun-dances of bacteria and fungi were tested. After treat-ments, diluted crude extracts were spread on LB and PDA (potato dextrose agar). Single colonies for each possible species of microbe (identified initially by colony morphology) were recorded, selected, and then streaked for three times. Pure strains were identified using previ-ously described methods [25]. One-way ANOVA was
carried out for these randomized block designs with gal-lery sample and treatment as two main effects, followed by S-N-K (Student-Newman-Keul’s) test for multiple comparisons.
Effects of anti-fungal and anti-bacterial treatments on naringenin degradation were compared using both liquid and solid media. Crude extract (100 μl pipetted) from gallery samples received one of the two treatments: 100 μl of (1) nystatin and cycloheximide (NC) and (2) streptomycin and penicillin (SP). Liquid conditions were 1 ml of 1 mM naringenin solutions as described above. Solid conditions were 50 μl of 1 mM naringenin solu-tions dried on the surfaces of PDA media with crude ex-tracts spread on it. Six RTB galleries were used. The parametric paired-sample T test was used to compare the quantity of remaining naringenin following exposure to the crude extracts between the two treatments.
Beetle survivorship bioassay withNovosphingobiumsp.
Phloem media amended with naringenin (2000μg g−1of media dry weight) was prepared.Novosphingobiumsp. is a strong naringenin-biodegrading bacterium that has been isolated from RTB galleries [25]. Here, this bacterium was cultured in LB and the cells were washed with 10% PBS buffer before adding to phloem media in 35-mm-diameter Petri dishes. The control phloem media were mixed with 10% PBS buffer. Each Petri dish contained one larva. Twenty RTB larvae were applied for each treatment and beetles were checked daily for mortality. Comparisons be-tween the survival curves were tested by Log Rank (Mantel-Cox) method as described before.
Results
Impact of symbiotic microbiota in gallery on beetle survivorship under naringenin
In the presence of naringenin (2000 μg g−1 of media), the number of live RTB larvae was reduced during the observing time. However, the survival rate for beetles in media without gallery microbiota was significantly lower than those in media with gallery microbiota (Fig. 1a; Mantel-Cox test,χ21= 17.73,P< 0.0001).
Metagenomic analysis for the symbiotic microbiota in RTB gallery
partial ORFs. After cluster analysis by CD-HIT, we ob-tained 47,241 non-redundant unigenes. We annotated protein function encoded by these unigenes through BLAST searches. In total, 34,704 unigenes (73.5%) were assigned to 4352 KEGG orthologs (KOs). Among them, metabolisms of carbohydrate, amino acid, energy, and xenobiotics biodegradation were the four top abundant categories (Fig.1b).
A total of 2962 unigenes (8.5%) were involved in xeno-biotics biodegradation and metabolism. In this category, 1291 unigenes (43.6%) were annotated to degrade a var-iety of aromatic compounds, including aminobenzoate, benzoate, and bisphenol (Fig. 1c). Benzoate degradation and its related pathways are intermediate pathways for degradation of phenolic compounds, which could be fur-ther degraded into fatty acids and the terminal product acetyl-CoA could be utilized in the citrate cycle meta-bolic pathway. Extradiol dioxygenases involved in aro-matic ring cleavage and hydroxylation are important enzymes for degrading aromatics into fatty acids. The coding genes for these enzymes were found in the meta-genomics of beetle gallery microbiota, assigned to genera such as Burkholderia, Sphingomonas, Mycobacterium, andNovosphingobium(Additional file1: Table S1).
The relationship between microbial abundances and naringenin degradation
For bacteria in the 19 gallery samples with differential naringenin degrading activities, we obtained a total of 155,786 sequences (91.2% of the total trimmed 170,817 sequences) that could be clustered into 708 OTUs (mean = 186 per sample, s.d. = 52, range = 94–288) at a 97% similarity level. For fungi, 277,369 sequences (96.0% of the total trimmed 288,932 sequences) were obtained among these samples that could be clustered into 209 OTUs (mean = 66 per sample, s.d. = 16, range = 42–100) at a 97% similarity level. The diversities of both bacteria and fungi within each sample were fully characterized, as the rarefaction curves had already reached stable values under the sequencing depth for each sample (Additional file 1: Figure S2). No significant differences were found in number of OTUs, Shannon diversity index, Simpson’s diversity index, and Buzas or Gibson’s evenness index among the three levels (low/medium/ high) of naringenin degrading activity, for either bacter-ial communities (Additional file 1: Table S2) or fungal communities (Additional file1: Table S3).
Three fungal phyla that were the most abundant in the fungal community, including Ascomycota, Basidiomy-cota, and ZygomyBasidiomy-cota, were not significantly different between activity groups (Fig. 2a). No significant differ-ences between activity groups were found for fungi at the class or order level (Additional file 1: Table S4). However, shifts in bacterial abundances at the phylum
level were significant among activity groups. The rela-tive abundances of Proteobacteria were increased sig-nificantly in the high naringenin degrading activity group (P= 0.005; Fig.2a), in contrast to significant de-clines in relative abundances of Firmicutes and Actino-bacteria (P= 0.003 and P= 0.036, respectively; Fig. 2a).
Relative abundances of the other two phyla,
Bacteroidetes and Acidobacteria, were not found to be statistically different among the three activity groups (P= 0.067 and P= 0.145, respectively; Fig. 2a). Sixty-seven genera were identified, accounting for an
average of 76.3% of all OTUs sequences
(Additional file 1: Table S5). Five genera ( Novosphingo-bium and Stenotrophomonas in particular, P= 0.001 and 0.003, respectively), belonging to Proteobacteria, were sig-nificantly more abundant in the high activity group (Additional file1: Table S5). Three genera (especially Lac-tococcus and Leuconostoc, P= 0.002 and 0.015, respect-ively) in Firmicutes and Microbacterium (P= 0.035) in Actinobacteria were significantly more abundant in the low activity group (Additional file1: Table S5).
Effects of anti-fungal agents on naringenin degradation by gallery microbiota
No significant difference in naringenin degrading activity was found between the anti-fungal treatment and the control with no antibiotics, but treatment with both anti-bacterial and anti-fungal agents caused significantly higher quantity of remaining naringenin than other treatments (Fig. 2b; F2, 54= 64.065, P< 0.0001). Treat-ment with anti-bacterial agents alone resulted in a sig-nificantly higher quantity of naringenin remaining compared to the treatment with anti-fungal agents (Additional file1: Figure S3).
For fungi, only yeasts were isolated from gallery ex-tracts with these treatments. Anti-fungal treatment sig-nificantly reduced the number of yeast colony-forming unit (CFU) (Fig.2c;F2, 4= 60.750,P= 0.001), but did not have significant effects on the number of bacterial CFUs (Fig.2c;F2, 4= 20.857,P= 0.008).
The relationship between bacterial community composition and naringenin degradation
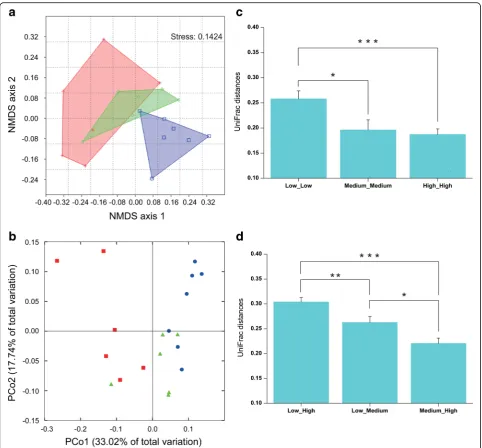
ANOSIM, P= 0.0016). Samples from the high activity group possessed distinct bacterial OTU composition compared to those from medium and low activity groups, while there was no difference in bacterial com-munity composition between medium and low activity samples (Additional file 1: Table S6). Mantel tests fur-ther corroborated a significant correlation between bac-terial community composition and naringenin degrading activity (Pearsonr= 0.26,P= 0.02).
The phylogeny-based weighted UniFrac principal coord-inate analyses considering relative abundances of OTUs gave similar results (Fig. 3b; PERMANOVA, P< 0.001;
PLS models were further used to determine how much variation of naringenin degrading activity (Y variable) was explained by the relative abundance of bacterial OTUs (X variables). The PLS model using bacterial OTUs as X variables exhibited high goodness of fit (R2= 0.996) and goodness of prediction (Q2= 0.796) (Additional file 1: Table S7).
The relationship between phylotypes in bacterial community and naringenin degradation
were key X variables that explained 93.7% of the vari-ation in naringenin degrading activity (R2), with a pre-dictive ability (Q2) of 58.8% (Additional file1: Table S7).
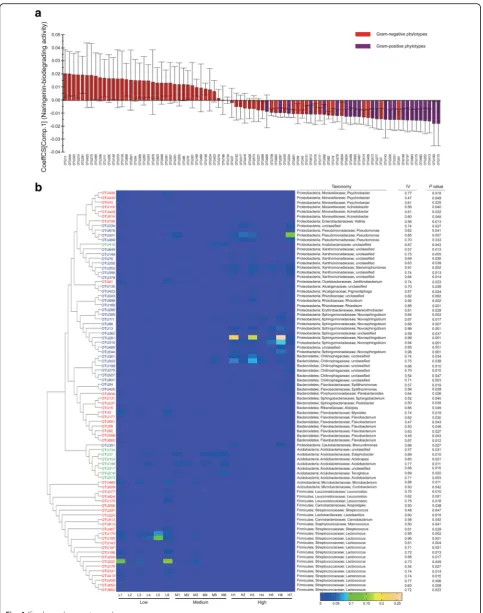
Among these indicator phylotypes, 43 and 35 OTUs were specifically distributed in the low and high activity groups, respectively; 8 OTUs significantly characterized the medium activity group (Additional file 1: Table S8). In the low activity group, top indicators included three OTUs (IV 0.96, 0.95, and 0.81) fromLactococcus (Firmi-cutes) and one OTU (IV 0.88) from Microbacterium (Actinobacteria) (Fig.4b). In the medium activity group, majority of the indicators were affiliated with the family Acidobacteriaceae (Fig. 4b). In the high activity group, all indicators were Gram-negative and were positively correlated with naringenin degrading activity (Fig. 4a). The overall Gram-negative bacteria taxa were posi-tively correlated with naringenin biodegradation (Additional file 1: Figure S5), which possessed abun-dant genes in the category of xenobiotics biodegrad-ation (Additional file 1: Figure S6).
A large amount of indicators in the high activity group (27 out of 35) were mapped to phylum Proteobacteria with the top ones belonging to the genus Novosphingo-bium (Fig. 4b); one Novosphingobium OTU (IV 0.99) had an average relative abundance of over 10% in total high activity communities and even accounted for around 20% of the sequences in some samples (Fig. 4b; Additional file1: Table S8).
Impact ofNovosphingobiumspecies on beetle survivorship under naringenin
For Novosphingobium, 276 unigenes were assigned to 108 KEGG orthologs (KOs). Among them, global map, amino acid metabolism, carbohydrate metabolism, and xenobiotics biodegradation and metabolism were the top four abundant categories (Fig. 5a). The global map cat-egory contained three pathways, including metabolic pathways (77 genes), microbial metabolism in diverse environments (33 genes), and biosynthesis of secondary metabolites (26 genes). Novosphingobiumpossessed pu-tative genes involved in metabolism of diverse aromatic compounds, the metabolic products of which were sug-gested to be further utilized by other metabolic pathways (Table1; Additional files2and3).
Furthermore, for beetles living in media supplemented with naringenin (2000 μg g−1of media), the survival rate for beetles withoutNovosphingobiumsp. was significantly lower than those in media associated with this bacterium (Fig.5b; Mantel-Cox test,χ21= 6.03,P= 0.014).
Our study presented here, based on metagenomics and 454 pyrosequencing data together with the corre-sponding beetle bioassay results, seeks to identify key microbial players of symbiotic microbiota in the RTB gallery that protect the invasive beetle from naringenin, an inducible defensive compound of the host pine. First, through the beetle-survivorship bioassay, symbiotic naringenin-degrading microbiota were found to increase RTB survivorship (Fig. 5b), and potential genes in deg-radation pathways were discovered by metagenomics (Fig. 1). Second, the anti-fungal bioassay demonstrated that fungi had little involvement in naringenin degradation (Fig. 2), while bacterial community structure was highly correlated to naringenin degrading activity (Fig. 3). Last, phylotypes of genus Novosphingobium, Gram-negative bacteria, were extraordinarily correlated to the degrading activity, which were determined to possess putative genes involved in degradation pathways by metagenomics ana-lysis (Figs.4and5). The beetle-survivorship bioassay con-firmed that RTB associated with an isolated species of this genus acquired protection against naringenin (Fig.5).
Discussion
The naringenin degradation function was highly corre-lated with bacterial community structure in the micro-biota. It is not surprising that fungi in the symbiotic microbiota of the RTB galleries had little involvement in naringenin degradation (Fig. 2). The majority of fungal species belonged to yeasts (around 80% of fungal reads were affiliated to order Saccharomycetales; Add-itional file 1: Table S4). The most two highly abundant OTUs in the fungal communities together made up 46.4% of reads (Additional file 1: Figure S4b) and these two fungal OTUs matched to the yeast species Cyberlindnera americana CBS5644 at similarity of 97.2 and 100%, respectively. Yeast species have been isolated from RTB galleries of different developmental stages in the field [25,51]. Yeasts exhibiting strong naringenin de-grading activities were infrequently associated with RTB, (See figure on previous page.)
and the most frequently isolated yeasts (e.g., C. americana) had the lowest potential to degrade narin-genin among the yeasts isolated from RTB galleries [25]. Metagenomic data also revealed that putative genes functioning in aromatic ring cleavage were assigned to bacteria rather than yeasts (Additional file 1: Table S1). Fungi may play a minor role in naringenin degradation as indicated by the combined anti-fungal/anti-bacterial treatment having the least naringenin degradation. How-ever, our data demonstrated that the bacterial commu-nity alone, evidenced by presence of only bacteria colony
forming units in the anti-fungal treatment, had a stron-ger correlation with the degradation function (Fig.2b,c). The taxonomy- and OTU-level compositions of bac-terial communities were significantly divergent among activity groups (Figs. 2a and 3). Phyla Firmicutes and Actinobacteria were more abundant in the low activity group compared to the high activity group of galleries; conversely, phylum Proteobacteria was more abundant in the high activity group than in the low activity group of galleries (Fig. 2a). Abundances of 86 bacterial phylo-types explained most of the variation in naringenin Fig. 5Association with bacterial species inNovosphingobiumhelp protect the invasive RTB from naringenin.aKEGG pathway annotation for
degradation by symbiotic microbiota (Additional file 1: Table S7). Phylotypes belonging to the Gram-negatives were positively correlated to naringenin degrading activ-ity (Fig. 4a), and Gram-negative phylotypes were mainly enriched in the high activity group of RTB galleries (Fig. 4b). Metagenomic analysis revealed abundant putative genes for biodegradation in Gram-negatives (Additional file1: Figure S6). Thus, we hypothesized that phylotypes in Gram-negative bacteria of galleries protect RTB from naringenin.
Novosphingobium is a genus of Gram-negative
bac-teria, and the phylotypes found in this genus are ex-pected to degrade naringenin. A bacterial isolate from sediment of Lake Tai, identified to be a novel member of the genus Novosphingobium, assimilated several aro-matic compounds such as phenol, aniline, nitrobenzene, 4-chloronitrobenzene, and phenanthrene [52]. Isolates of this genus from marine sediments were also shown to be capable of degrading multiple polycyclic aromatic hydro-carbons (PAHs) [53, 54]. The presence of Novosphingo-bium sp. HS2aR improved the growth of plants in phenanthrene-contaminated soil by degradation [55]. In our system, through metagenomic analysis, Novosphin-gobiumwas found to possess putative genes involved in metabolic pathways for multiple aromatic compounds degradation which were linked to down-stream carbohy-drate, lipid, and amino acid metabolisms (Fig. 5a;
Table1). One gene encoding aromatic ring hydroxylating dioxygenase, which is important for aromatic ring cleavages [56], was identified from Novosphingobium (Additional file 1: Table S1). Novosphingobium sp. has been isolated from RTB gallery, one of the gallery mi-crobes exhibiting strong naringenin degrading activity [25]. Here, in the beetle-survivorship bioassay, RTB lar-vae associated with this bacterium acquired protection against naringenin (Fig.5b).
The symbiotic microbiota exhibited different naringenin degrading activities in RTB galleries (Additional file 1: Figure S1). This variation of naringenin degrading activity in gallery communities may be attributed to differences of the abundance of key bacteria like Novosphingobium, or by interactions with other microbiota. In our work, OTUs 385, 111, 86, 13, 281, 314, and 544 were assigned to the genusNovosphingobiumand their abundances/frequencies in different naringenin-biodegrading groups are shown in Fig.4and Additional file1: Table S8.
It is of interest to know why gallery communities var-ied and why certain naringenin-degrading bacterial mi-crobes, such asNovosphingobiumsp., became dominant in the high activity group, while had low abundance in low activity group. We suspect two factors may have re-sulted in this variation: First, nearly half of the low-activity indicator groups belonged to the order Lactobacillales, which can produce lactic acid as the
Table 1Genes involved in metabolism of diverse aromatic compounds and other connected metabolisms byNovosphingobium
a
Pathway interactions were presented in Additional file 2; Pathways for aromatics degradations were included in the blue highlighting;
b
major metabolic end-product of carbohydrate fermenta-tion, suggesting a possible low pH condition in low ac-tivity galleries. On the contrary, these acid-producing taxa were nearly absent in high activity galleries, which implies a distinctive pH condition in the gallery micro-environment may facilitate growth of Novosphingobium bacteria. Second, the change in host pine defensive chemistry may also influence the abundances of micro-organisms residing in galleries. In the case of host pines infected with Chinese-resident fungi during the course of RTB attack, pine phloem can be stimulated to pro-duce high amounts of naringenin. Many bacterial taxa cannot tolerate high levels of naringenin, while this con-dition is very suitable for bacteria in the genus
Novo-sphingobium, which are capable of degrading this
compound and use as its sole carbon source. Never-theless, it may be the invasion process of RTB itself that facilitates the favorable gallery microbiome con-ditions resulting in the preponderance of
Novosphin-gobium in the high activity group. Interactions
between microbes within a community and physio-chemical conditions of microenvironments as import-ant ecological factors [57, 58], may ultimately shape the differential gallery communities that lead to varied degrading activities. These potential factors will be elucidated in future studies.
Microbial symbionts that are essential for the invasion success of weeds and pests usually share common traits: they are frequently associated with hosts, predominant in niches, and exhibit functions that enhance their hosts’ invasiveness; and importantly, inflict a severe fitness cost to individuals lacking the symbiont. In fact, the ultimate functions of microbes, as extended phenotypes for exotic invaders, are likely context-dependent and may change with environmental conditions and the presence of other cooperating microbes in the community assemblage. Given these reasons, key players of symbiotic microbiota involved in facilitating the success of species invasion should be elucidated from the community level down to the particular taxa. Our results presented here could en-lighten researchers on providing complementary insights into assessing “essential symbionts” that are involved in dynamic symbiotic associations with invasive species.
Conclusions
In the present study, symbiotic naringenin-degrading microbiota in the gallery were found to protect invasive RTB from naringenin, a phenolic defensive chemical in host pines. The naringenin degradation function was highly correlated with bacterial community structure in the microbiota. This study might be among the first at-tempts of combining a variety of bioassay results with metagenomics and 454 pyrosequencing data to demon-strate the roles of key symbiotic microbes in facilitating
species invasion. In this process, the overall symbiotic microbiota were used for beetle survivorship bioassay, the naringenin-degrading function was evidenced by metagenomics, and then the functions of bacteria and fungi in the microbiota were indicated by the anti-fungal treatment bioassays. The function of bacterial micro-biota was further confirmed by 454 pyrosequencing data analyses and metagenomics, and finally, a representative bacterial strain was used in a beetle survivorship bio-assay to validate the protective role of microbiota against naringenin. This research elucidated the key players of symbiotic microbiota from the community level down to the particular taxa, involved in facilitating RTB inva-sions, and exemplifies a good case study to further understand other successful symbiotic invasion systems.
Additional files
Additional file 1:This file includes:Table S1.eggNOG function annotation for dioxygenases in aromatics degradation.Table S2. Comparison of diversity indices (Mean ± SEM) between bacterial gallery microbiota of low (L), medium (M), and high (H) naringenin biodegrading activity.Table S3.Comparison of diversity indices (Mean ± SEM) between fungal gallery microbiota of low (L), medium (M), and high (H) naringenin biodegrading activity.Table S4.Class- and order-level comparisons between fungal communities in RTB galleries of low (L), medium (M), and high (H) naringenin degrading activity.Table S5.Changes in relative abundances of main bacterial genera with reported known functions in biodegradation.Table S6.ANOSIMRvalues between naringenin biodegrading activity groups.Table S7.Model statistics of PLS.Table S8. Detailed information for the 86 indicator phylotypes.Figure S1. Naringenin-biodegrading activity (Mean ± SEM) of RTB galleries with large variation between samples.Figure S2.Rarefaction curves of the 19 samples for bacterial OTUs and fungal OTUs.Figure S3.Effects of anti-fungal and anti-bacterial treatments on naringenin degradation, under liquid and solid media condition.Figure S4.The rank abundance diagram of the 708 bacterial OTUs and 209 fungal OTUs identified, plotted as the traditional Whittaker plot.Figure S5.Effects of
anti-bacterial treatments on naringenin degradation and abundance of Gram-negative bacteria.Figure S6.KEGG pathway annotations for Gram-negative bacteria and Gram-positive bacteria in RTB gallery microbiota. (DOC 5448 kb)
Additional file 2:map01120.Projection of genes involved in microbial metabolism in diverse environments on the KEGG pathways. (PNG 276 kb)
Additional file 3:Gene IDs of KEGG pathways in map01120. (HTML 848 kb)
Abbreviations
ANOSIM:Analysis of similarity; CFU: Colony-forming unit; HPLC: High-performance liquid chromatography; INDVAL: Indicator value; KO: KEGG ortholog; LCA: Lowest common ancestor; NMDS: Non-metric multidimensional scaling; ORF: Open reading frames; OTU: Operational taxonomic unit; PBS: Phosphate buffered saline; PCoA: Principal coordinate analysis; PDA: Potato dextrose agar; PLS: Partial least square projection to latent structures; RTB: Red turpentine beetle; S-N-K: Student-Newman-Keul
Funding
This work was supported by the Frontier Science Key Project of the Chinese Academy of Sciences (QYZDJ-SSW-SMC024), Strategic Priority Research Program of the Chinese Academy of Sciences (XDB11050000), and the National Natural Science Foundation of China (31110103903, 31222013, and 31702018).
Availability of data and materials
deposited in BioProject (ID: PRJNA294943). All data are available as supplementary materials or upon request by the authors.
Authors’contributions
CC, ML, and JS designed the research. CC, JW, LC, and DX performed experiments and analyzed the data. CC, JW, ML, and JS wrote the manuscript. All authors read and approved the final manuscript.
Ethics approval and consent to participate
All applicable international, national, and/or institutional guidelines for the care and use of animals were followed. This article does not contain any studies with human participants performed by any of the authors.
Consent for publication Not applicable.
Competing interests
The authors declare that they have no competing interests.
Publisher’s Note
Springer Nature remains neutral with regard to jurisdictional claims in published maps and institutional affiliations.
Author details
1State Key Laboratory of Integrated Management of Pest Insects and
Rodents, Institute of Zoology, Chinese Academy of Sciences, 1 Beichen West Road, Chaoyang District, Beijing 100101, China.2University of the Chinese Academy of Sciences, Beijing 100049, China.3College of Life Sciences, Huzhou University, No. 759, East 2nd Road, Huzhou 313000, China.
Received: 1 June 2018 Accepted: 11 July 2018
References
1. Mack RN, Simberloff D, Mark Lonsdale W, Evans H, Clout M, Bazzaz FA. Biotic invasions: causes, epidemiology, global consequences, and control. Ecol Appl. 2000;10:689–710.
2. Wardle DA, Bardgett RD, Callaway RM, Van der Putten WH. Terrestrial ecosystem responses to species gains and losses. Science. 2011;332:1273–7. 3. Hulcr J, Dunn RR. The sudden emergence of pathogenicity in insect–fungus
symbioses threatens naive forest ecosystems. Proc Roy Soc B-Biol Sci. 2011; 278:2866–73.
4. Traveset A, Richardson DM. Mutualistic interactions and biological invasions. Annu Rev Ecol Evol Syst. 2014;45:89–113.
5. Lu M, Hulcr J, Sun J. The role of symbiotic microbes in insect invasions. Annu Rev Ecol Evol Syst. 2016;47:487–505.
6. Pringle A, Bever JD, Gardes M, Parrent JL, Rillig MC, Klironomos JN. Mycorrhizal symbioses and plant invasions. Annu Rev Ecol Evol Syst. 2009; 40:699–715.
7. Clay K, Holah J, Rudgers JA. Herbivores cause a rapid increase in hereditary symbiosis and alter plant community composition. Proc Nat Acad Sci USA. 2005;102:12465–70.
8. Rudgers JA, Clay K. An invasive plant–fungal mutualism reduces arthropod diversity. Ecol Lett. 2008;11:831–40.
9. Aschehoug ET, Metlen KL, Callaway RM, Newcombe G. Fungal endophytes directly increase the competitive effects of an invasive forb. Ecology. 2012; 93:3–8.
10. Himler AG, Adachi-Hagimori T, Bergen JE, Kozuch A, Kelly SE, Tabashnik BE, et al. Rapid spread of a bacterial symbiont in an invasive whitefly is driven by fitness benefits and female bias. Science. 2011;332:254–6.
11. Vilcinskas A, Stoecker K, Schmidtberg H, Röhrich CR, Vogel H. Invasive harlequin ladybird carries biological weapons against native competitors. Science. 2013;340:862–3.
12. Dickie IA, Bolstridge N, Cooper JA, Peltzer DA. Co-invasion byPinusand its mycorrhizal fungi. New Phytol. 2010;187:475–84.
13. Kostovcik M, Bateman CC, Kolarik M, Stelinski LL, Jordal BH, Jiri H. The ambrosia symbiosis is specific in some species and promiscuous in others: evidence from community pyrosequencing. ISME J. 2015;9:126–38. 14. Bansal R, Mian MAR, Michel AP. Microbiome diversity ofAphis glycineswith
extensive superinfection in native and invasive populations. Environ Microbiol Rep. 2014;6:57–69.
15. Coats VC, Pelletreau KN, Rumpho ME. Amplicon pyrosequencing reveals the soil microbial diversity associated with invasive Japanese barberry (Berberis thunbergiiDC.). Mol Ecol. 2014;23:1318–32.
16. Ishak HD, Plowes R, Sen R, Kellner K, Meyer E, Estrada DA, et al. Bacterial diversity inSolenopsis invictaandSolenopsis geminataant colonies characterized by 16S amplicon 454 pyrosequencing. Microbial Ecol. 2011;61: 821–31.
17. Moora M, Berger S, Davison J, Öpik M, Bommarco R, Bruelheide H, et al. Alien plants associate with widespread generalist arbuscular mycorrhizal fungal taxa: evidence from a continental-scale study using massively parallel 454 sequencing. J Biogeogr. 2011;38:1305–17.
18. Scully ED, Geib SM, Carlson JE, Tien M, McKenna D, Hoover K. Functional genomics and microbiome profiling of the Asian longhorned beetle (Anoplophora glabripennis) reveal insights into the digestive physiology and nutritional ecology of wood feeding beetles. BMC Genomics. 2014;15:1096–116. 19. Coats VC, Rumpho ME. The rhizosphere microbiota of plant invaders: an
overview of recent advances in the microbiomics of invasive plants. Front Microbiol. 2014;5:368.
20. Shipunov A, Newcombe G, Raghavendra AKH, Anderson CL. Hidden diversity of endophytic fungi in an invasive plant. Amer J Bot. 2008;95: 1096–108.
21. Zurel D, Benayahu Y, Or A, Kovacs A, Gophna U. Composition and dynamics of the gill microbiota of an invasive Indo-Pacific oyster in the eastern Mediterranean Sea. Environ Microbiol. 2011;13:1467–76.
22. Sun J, Lu M, Gillette NE, Wingfield MJ. Red turpentine beetle: innocuous native becomes invasive tree killer in China. Annu Rev Entomol. 2013;58: 293–311.
23. Lu M, Wingfield MJ, Gillette NE, Mori SR, Sun JH. Complex interactions among host pines and fungi vectored by an invasive bark beetle. New Phytol. 2010;187:859–66.
24. Lu M, Wingfield MJ, Gillette N, Sun J. Do novel genotypes drive the success of an invasive bark beetle–fungus complex? Implications for potential reinvasion. Ecology. 2011;92:2013–9.
25. Cheng C, Xu L, Xu D, Lou Q, Lu M, Sun J. Does cryptic microbiota mitigate pine resistance to an invasive beetle–fungus complex? Implications for invasion potential. Sci Rep. 2016;6:33110.
26. Luo R, Liu B, Xie Y, Li Z, Huang W, Yuan J, et al. SOAPdenovo2: An empirically improved memory-efficient short-readde novoassembler. GigaScience. 2012;1:18.
27. Mende DR, Waller AS, Sunagawa S, Järvelin AI, Chan MM, Arumugam M, et al. Assessment of metagenomic assembly using simulated next generation sequencing data. PLoS One. 2012;7:e31386.
28. Zhu W, Lomsadze A, Borodovsky M.Ab initiogene identification in metagenomic sequences. Nucleic Acids Res. 2010;38:e132.
29. Qin J, Li R, Raes J, Arumugam M, Burgdorf KS, Manichanh C, et al. A human gut microbial gene catalogue established by metagenomic sequencing. Nature. 2010;464:59–65.
30. Huson DH, Mitra S, Ruscheweyh HJ, Weber N, Schuster SC. Integrative analysis of environmental sequences using MEGAN4. Genome Res. 2011;21:1552–60. 31. Li J, Jia H, Cai X, Zhong H, Feng Q, Sunagawa S, et al. An integrated catalog
of reference genes in the human gut microbiome. Nat Biotechnol. 2014;32: 834–41.
32. Bonello P, Blodgett JT.Pinus nigra–Sphaeropsis sapineaas a model pathosystem to investigate local and systemic effects of fungal infection of pines. Physiol Molec Plant Pathol. 2003;63:249–61.
33. Amato KR, Yeoman CJ, Kent A, Righini N, Carbonero F, Estrada A, et al. Habitat degradation impacts black howler monkey (Alouatta pigra) gastrointestinal microbiomes. ISME J. 2013;7:1344–53.
34. Engelbrektson A, Kunin V, Wrighton KC, Zvenigorodsky N, Chen F, Ochman H, et al. Experimental factors affecting PCR-based estimates of microbial species richness and evenness. ISME J. 2010;4:642–7.
35. Caporaso JG, Kuczynski J, Stombaugh J, Bittinger K, Bushman FD, Costello EK, et al. QIIME allows analysis of high-throughput community sequencing data. Nat Methods. 2010;7:335–6.
36. Edgar RC. Search and clustering orders of magnitude faster than BLAST. Bioinformatics. 2010;26:2460–1.
37. Edgar RC. UPARSE: highly accurate OTU sequences from microbial amplicon reads. Nat Methods. 2013;10:996–8.
39. Peay KG, Baraloto C, Fine PVA. Strong coupling of plant and fungal community structure across western Amazonian rainforests. ISME J. 2013;7:1852–61. 40. Edgar RC, Haas BJ, Clemente JC, Quince C, Knight R. UCHIME improves
sensitivity and speed of chimera detection. Bioinformatics. 2011;27:2194–200. 41. Wang Q, Garrity GM, Tiedje JM, Cole JR. Naïve Bayesian classifier for rapid
assignment of rRNA sequences into the new bacterial taxonomy. Appl Environ Microbiol. 2007;73:5261–7.
42. Quast C, Pruesse E, Yilmaz P, Gerken J, Schweer T, Yarza P, et al. The SILVA ribosomal RNA gene database project: improved data processing and web-based tools. Nucleic Acids Res. 2013;41:D590–6.
43. Kõljalg U, Nilsson RH, Abarenkov K, Tedersoo L, Taylor AFS, Bahram M, et al. Towards a unified paradigm for sequence-based identification of fungi. Mol Ecol. 2013;22:5271–7.
44. Hammer Ø, Harper DAT, Ryan PD. PAST: paleontological statistics software package for education and data analysis. Paleontol Electrón. 2001;4:9. 45. Clarke KR. Non-parametric multivariate analyses of changes in community
structure. Aust J Ecol. 1993;18:117–43.
46. Oksanen J, Kindt R, Legendre P, O’Hara B, Simpson GL, Solymos P, et al. Vegan: community ecology package. R package version. 2008;1:15–0. 47. Hamady M, Lozupone C, Knight R. Fast UniFrac: facilitating high-throughput
phylogenetic analyses of microbial communities including analysis of pyrosequencing and PhyloChip data. ISME J. 2010;4:17–27.
48. Chen J. GUniFrac: generalized UniFrac distances. R Package Version. 2012;1:0. 49. Wold S, Sjöström M, Eriksson L. PLS-regression: a basic tool of
chemometrics. Chemometr Intell Lab Syst. 2001;58:109–30.
50. Dufrêne M, Legendre P. Species assemblages and indicator species: the need for a flexible asymmetrical approach. Ecol Monogr. 1997;67:345–66. 51. Lou Q, Lu M, Sun J. Yeast diversity associated with invasiveDendroctonus valenskillingPinus tabuliformisin China using culturing and molecular methods. Microbial Ecol. 2014;68:397–415.
52. Liu ZP, Wang BJ, Liu YH, Liu SJ.Novosphingobium taihuensesp. nov., a novel aromatic-compound-degrading bacterium isolated from Taihu Lake, China. Int J Syst Evol Microbiol. 2005;55:1229–32.
53. Sohn JH, Kwon KK, Kang JH, Jung HB, Kim SJ.Novosphingobium pentaromativoranssp. nov., a high-molecular-mass polycyclic aromatic hydrocarbon-degrading bacterium isolated from estuarine sediment. Int J Syst Evol Microbiol. 2004;54:1483–7.
54. Lyu Y, Zheng W, Zheng T, Tian Y. Biodegradation of polycyclic aromatic hydrocarbons byNovosphingobium pentaromativoransUS6-1. PLoS One. 2014;9:e101438.
55. Rodriguez-Conde S, Molina L, González P, García-Puente A, Segura A. Degradation of phenanthrene byNovosphingobiumsp. HS2a improved plant growth in PAHs-contaminated environments. Appl Microbiol Biotechnol. 2016;100:10627–36.
56. Eltis LD, Bolin JT. Evolutionary relationships among extradiol dioxygenases. J Bacteriol. 1996;178:5930–7.
57. Hassani MA, Durán P, Hacquard S. Microbial interactions within the plant holobiont. Microbiome. 2018;6:58.