Geosci. Model Dev., 6, 765–782, 2013 www.geosci-model-dev.net/6/765/2013/ doi:10.5194/gmd-6-765-2013
© Author(s) 2013. CC Attribution 3.0 License.
EGU Journal Logos (RGB)
Advances in
Geosciences
Open Access
Natural Hazards
and Earth System
Sciences
Open AccessAnnales
Geophysicae
Open AccessNonlinear Processes
in Geophysics
Open AccessAtmospheric
Chemistry
and Physics
Open AccessAtmospheric
Chemistry
and Physics
Open Access DiscussionsAtmospheric
Measurement
Techniques
Open AccessAtmospheric
Measurement
Techniques
Open Access DiscussionsBiogeosciences
Open Access Open Access
Biogeosciences
Discussions
Climate
of the Past
Open Access Open Access
Climate
of the Past
Discussions
Earth System
Dynamics
Open Access Open Access
Earth System
Dynamics
DiscussionsGeoscientific
Instrumentation
Methods and
Data Systems
Open Access
Geoscientific
Instrumentation
Methods and
Data Systems
Open Access DiscussionsGeoscientific
Model Development
Open Access Open Access
Geoscientific
Model Development
DiscussionsHydrology and
Earth System
Sciences
Open AccessHydrology and
Earth System
Sciences
Open Access DiscussionsOcean Science
Open Access Open Access
Ocean Science
DiscussionsSolid Earth
Open Access Open Access
Solid Earth
Discussions
The Cryosphere
Open Access Open Access
The Cryosphere
DiscussionsNatural Hazards
and Earth System
Sciences
Open Access
Discussions
Sensitivity of remote aerosol distributions to representation of
cloud–aerosol interactions in a global climate model
H. Wang, R. C. Easter, P. J. Rasch, M. Wang, X. Liu, S. J. Ghan, Y. Qian, J.-H. Yoon, P.-L. Ma, and V. Vinoj
Atmospheric Sciences and Global Change Division, Pacific Northwest National Laboratory (PNNL), Richland, Washington, USA
Correspondence to: H. Wang (hailong.wang@pnnl.gov)
Received: 4 December 2012 – Published in Geosci. Model Dev. Discuss.: 21 January 2013 Revised: 9 April 2013 – Accepted: 3 May 2013 – Published: 5 June 2013
Abstract. Many global aerosol and climate models, includ-ing the widely used Community Atmosphere Model ver-sion 5 (CAM5), have large biases in predicting aerosols in remote regions such as the upper troposphere and high lat-itudes. In this study, we conduct CAM5 sensitivity simula-tions to understand the role of key processes associated with aerosol transformation and wet removal affecting the vertical and horizontal long-range transport of aerosols to the remote regions. Improvements are made to processes that are cur-rently not well represented in CAM5, which are guided by surface and aircraft measurements together with results from a multi-scale aerosol–climate model that explicitly represents convection and aerosol–cloud interactions at cloud-resolving scales. We pay particular attention to black carbon (BC) due to its importance in the Earth system and the availability of measurements.
We introduce into CAM5 a new unified scheme for con-vective transport and aerosol wet removal with explicit aerosol activation above convective cloud base. This new im-plementation reduces the excessive BC aloft to better simu-late observed BC profiles that show decreasing mixing ra-tios in the mid- to upper-troposphere. After implementing this new unified convective scheme, we examine wet re-moval of submicron aerosols that occurs primarily through cloud processes. The wet removal depends strongly on the subgrid-scale liquid cloud fraction and the rate of conver-sion of liquid water to precipitation. These processes lead to very strong wet removal of BC and other aerosols over mid- to high latitudes during winter months. With our im-provements, the Arctic BC burden has a 10-fold (5-fold) in-crease in the winter (summer) months, resulting in a much-better simulation of the BC seasonal cycle as well. Arctic
sulphate and other aerosol species also increase but to a lesser extent. An explicit treatment of BC aging with slower ag-ing assumptions produces an additional 30-fold (5-fold) in-crease in the Arctic winter (summer) BC burden. This BC aging treatment, however, has minimal effect on other under-predicted species. Interestingly, our modifications to CAM5 that aim at improving prediction of high-latitude and upper-tropospheric aerosols also produce much-better aerosol op-tical depth (AOD) over various other regions globally when compared to multi-year AERONET retrievals. The improved aerosol distributions have impacts on other aspects of CAM5, improving the simulation of global mean liquid water path and cloud forcing.
1 Introduction
concentrations, particularly during the Arctic haze season (winter to early spring), and overpredicts upper-tropospheric aerosols in lower latitudes (Wang et al., 2011b; Liu et al., 2012). In this study we use sensitivity tests to explore the reasons for these biases in the CAM5 model, but we believe the underlying issues and solutions are also likely to be rel-evant to other global models. We describe changes designed to reduce the biases, interpret those changes in the context of the basic physics of aerosol–cloud interactions, and demon-strate the improvements to the CAM5 simulation of aerosols in remote regions and changes to global aerosol distributions. Aerosols are important in the Earth system. They affect the Earth’s energy budget directly by scattering and absorbing shortwave and longwave radiation, and also affect cloud and warm-rain processes that further influence the surface and at-mospheric radiation balance (e.g., Twomey, 1974; Albrecht, 1989; Boucher, 1995; Rosenfeld, 2000; Wang and Feingold, 2009; Feingold et al., 2010). Aerosols in the upper tropo-sphere and cold, remote regions (e.g., high-latitude regions) are also likely to affect ice clouds and precipitation (e.g., Fridlind et al., 2004; Morrison et al., 2012). The vertical dis-tribution of absorbing aerosols such as black carbon (BC) is particularly important due to their effect on the atmospheric heating profile and resultant change in thermodynamic struc-ture and cloud amount (i.e., “semi-direct effect”). This effect depends on the location of absorbing aerosols in relation to the cloud layer (e.g., McFarquhar and Wang, 2006; Koch and Del Genio, 2010). Absorbing aerosols deposited onto snow and ice surface can enhance absorption of shortwave radia-tion at the surface, resulting in a warming of the lower at-mosphere and more-rapid melting of snow and ice (Warren and Wiscombe, 1980; Flanner et al., 2007; Doherty et al., 2010; Qian et al., 2011; Wang et al., 2011). Therefore, global three-dimensional aerosol distributions, particularly over re-mote regions away from sources (e.g., the Arctic and upper troposphere), are important in the Earth’s climate system.
Arctic aerosols largely originate from lower latitudes, de-spite some local seasonal natural and anthropogenic sources (e.g., Law and Stohl, 2007; Quinn et al., 2007). The ob-served distinct seasonal cycle with a minimum in summer and a maximum in late winter and early spring (Sharma et al., 2006) is closely related to transport from source regions out-side the Arctic. Aerosol dry/wet removal at lower latitudes can strongly influence the distribution of aerosols at high lat-itudes (e.g., Kinne et al., 2006; Textor et al., 2007; Shindell et al., 2008; Bourgeois and Bey, 2011; Browse et al., 2012). Wet removal is considered to be the dominant process that determines the amount of aerosols being transported to re-mote regions and is also one of the most uncertain processes in global aerosol–climate models (Textor et al., 2006). Wet removal by liquid-cloud scavenging and precipitation is of particular importance. Garrett et al. (2011) and Browse et al. (2012) showed that the seasonal cycle of Arctic BC is primarily driven by temperature-dependent wet scavenging processes during transport from source regions to the Arctic
and/or within the Arctic. Unfortunately, climate models have historically tended to overestimate low clouds in the Arctic region, particularly wintertime low-level liquid clouds (e.g., Vavrus and Waliser, 2008; Qian et al., 2012).
The vertical distribution of aerosols in the free troposphere depends strongly on convective transport and wet removal by convective clouds. Koch et al. (2009b) showed that the Aero-Com models generally overestimate BC in the mid- to upper-troposphere at low to mid-latitudes, and they found that in-creasing wet removal by convective clouds can reduce the bias. In the standard CAM5, convective transport and wet removal of aerosols are treated separately (although weakly coupled), without secondary activation of aerosols entrained into updrafts. This might explain why simulated BC in the upper troposphere is too high (Liu et al., 2012).
Regarding aerosol wet removal during the transport to re-mote regions, modeling studies have shown that chemical and physical transformations (i.e., aging processes that trans-form particles from a mostly hydrophobic state upon emis-sion to a more hydrophilic state) can be also very impor-tant (e.g., Vignati et al., 2010; Liu et al., 2011a). Condensa-tion of soluble material (e.g., sulfuric acid gas and condens-able organics), coagulation with soluble particles and oxida-tion of organic material can be involved in aging, but un-certainties remain (P¨oschl et al., 2001; Riemer et al., 2004). When BC aging is represented in global models, it is either simply parameterized by prescribing a fixed aging timescale (e.g., Collins et al., 2001) or represented more explicitly by treating condensation/coagulation with some simplifications (e.g., Vignati et al., 2004; Liu et al., 2012) because it is com-putationally impractical to explicitly treat the most detailed representations of the aging process (Riemer et al., 2009; Zaveri et al., 2010) in global models.
Koch et al. (2009b) compared global BC predictions from 17 AeroCom models, including an older version of CAM, and evaluated model results against surface and aircraft mea-surements. Their study revealed large discrepancies and di-versities, with some of the largest occurring in northern Eura-sia and the remote Arctic. CAM5 suffers from some of the same biases. Wang et al. (2011b) showed that the standard CAM5 underpredicted BC concentrations by up to two or-ders of magnitude at several polar sites and did not cap-ture the observed seasonal cycle. In contrast, they found that the observed BC concentrations were better predicted by an-other CAM5 variant called the Pacific Northwest National Laboratory Multi-scale Modeling Framework (PNNL-MMF) aerosol-climate model, which embeds a cloud-resolving model in each CAM5 grid column to explicitly represent aerosol–cloud interactions in both convective and stratiform clouds.
understand the role of each of the processes and to iden-tify sources of uncertainties in the model. The CAM5 sim-ulations with our modifications are evaluated using surface and aircraft measurements of aerosol properties and process-oriented model results (including aerosol and cloud proper-ties) from the PNNL-MMF model. Based on the evaluations, improvements are made to aerosol–cloud processes that are currently not well represented in CAM5, to produce a better aerosol simulation.
2 Model description, methods and simulations
2.1 Model descriptions
2.1.1 CAM5
We use a developmental version (5.0.40) of the CAM5 (Neale et al., 2010), which has nearly identical physics to the released version CAM5.1. Aerosol evolution in CAM5 is controlled by a combination of emission, transport (by re-solved winds, turbulence, convective clouds, and sedimenta-tion), aerosol microphysics (condensation, coagulation, and new particle formation), cloud chemistry, and wet and dry removal. Here we briefly summarize aspects that are impor-tant for remote region aerosols. The Supplement (Sect. S2) provides more information and Liu et al. (2012) provides a detailed description of the aerosol treatment and evaluation results.
CAM5 uses a modal aerosol module (MAM) where the aerosol size distribution is described by a set of lognormally distributed modes with prescribed geometric standard devia-tions (σg)and predicted mode diameters. The standard ver-sion (MAM3) uses three modes: Aitken (σg=1.6; dry di-ameter size range: 15–53 nm)1, accumulation (σg=1.8; 58– 270 nm), and a single coarse mode (σg=1.8; 0.80–3.85 µm). There is also a more detailed seven-mode version (MAM7) with Aitken (σg=1.8; 15–52 nm), accumulation (σg=1.8; 56–260 nm), primary carbon (σg=1.6; 39–130 nm), fine sea salt (σg=2.0; 95–560 nm), fine dust (σg=1.8; 140– 620 nm), coarse sea salt (σg=2.0; 0.63–3.70 µm) and coarse dust modes (σg=1.8; 0.59–2.75 µm). Modes are composed of sulphate, BC, primary organic matter (POM), secondary organic aerosol (SOA), sea salt, mineral dust, and water, al-though all the species are not present in every mode. The primary carbonaceous aerosol emissions (BC, POM) have aσg=1.8 and number mode diameter of 80 nm. Dust and sea salt are emitted at different size ranges for MAM3 and MAM7 as described in Liu et al. (2012). Within each mode, internal mixing of species in particles is assumed. BC and POM are emitted into the accumulation mode in MAM3. They are assumed to immediately mix with any hygroscopic 1Size ranges for particle diameters are the 10th and 90th
per-centiles of the global annual average number size distribution for the modes (Liu et al., 2012).
species (sulphate, SOA, sea salt) in this mode and become susceptible to wet scavenging. In contrast, BC and POM are emitted into the primary carbon mode in MAM7, and then are gradually and directly transferred to the accumulation mode as they age by condensation of soluble material and co-agulation with other soluble particles. Although the BC and POM particles have the same size distribution upon emis-sion in MAM3 and MAM7, in the MAM7 primary carbon mode they have low hygroscopicity (compared to accumu-lation mode) and are less susceptible to activation and wet removal. Biomass burning and anthropogenic components of BC and POM are not separated in the modal aerosol module configurations used in this study, but they have been sepa-rated in some other MAM studies (e.g., Ghan et al., 2012).
CAM5 has separate parameterizations of stratiform and convective clouds, and aerosol wet removal occurs for both types of clouds by in-cloud and below-cloud processes. For submicron particles (which include nearly all sulphate and all BC, POM, and SOA in CAM5), the predominant removal mechanism is in-cloud wet removal. This involves aerosol activation to form cloud droplets, followed by conversion of cloud droplets to precipitation. For stratiform clouds, cloud-borne (i.e., activated) particles are treated explicitly, and ac-tivation is calculated with the parameterization of Abdul-Razzak and Ghan (2000). Stratiform in-cloud wet removal is affected by the liquid-containing cloud fraction/frequency, the fraction of particles that are activated, and the rate at which cloud droplets (and cloud-borne particles) are re-moved.
Convective clouds affect aerosols both by vertical trans-port and wet removal. Although these two processes oc-cur together in nature, the standard CAM5 has separate (al-though weakly coupled) treatments of them. Aerosol activa-tion prior to wet removal is treated in a simpler manner than in stratiform clouds. Also, there is no mechanism for later-ally entrained aerosols to be activated/scavenged, allowing the transport of more aerosols to the upper troposphere. A new unified treatment of these aerosol processes in convec-tive clouds, which better treats aerosol wet removal in up-drafts (see Supplement Sect. S1), is applied in this study. It has a more detailed treatment of aerosol activation in up-drafts, both at and above cloud base.
2.1.2 PNNL-MMF
are that the CRM treats all types of clouds with detailed microphysics and aerosol indirect effects (without convec-tive parameterization), there are no empirical parameteriza-tions of cloud fractional area (cloud macrophysics), and there are prognostic rather than diagnostic treatments of precipi-tation in the microphysics. Primary differences in the treat-ment of aerosols are that cloud parameters (e.g., cloud frac-tion, liquid water, cloud-water removal rates, updraft and downdraft mass fluxes) that influence aerosol wet removal, vertical transport, and cloud chemistry are taken from the CRM calculations (averaged over a GCM time step and grid cell) rather than from conventional cloud parameterizations. Treatments of aerosol emissions, microphysics, and dry de-position are identical.
2.2 Motivation for model changes to CAM5
The two models (MMF and CAM5) have many common fea-tures (particularly involving aerosols), but the MMF gives a better simulation of several aspects of aerosol fields, particu-larly at the remote high latitudes in wintertime (Wang et al., 2011b), so comparison of results from the two models may suggest how the CAM5 simulation can be improved. We rec-ognize of course that this is less desirable than improving model components through direct use of observations; how-ever, the model intercomparison can use diagnostic quantities that affect aerosol wet removal processes (and thus transport to remote regions) but are not generally available from ob-servations. For the moment, we focus on evaluating the rep-resentation of these processes that contribute to differences in winter season BC between the MMF and CAM5, to ex-ploit potential deficiencies in CAM5 parameterizations and to inform design of model sensitivity tests.
The standard CAM5 simulation (denoted as CAM5std in Table 1, which also describes other CAM5 simulations used in this study) is conducted at 1.9◦×2.5◦horizontal resolu-tion with 30 hybrid vertical levels for 11 yr, and the last 10 are used for analysis. The computationally expensive MMF, which is about 200 times more costly per year of simula-tion, was run for 4 yr (last 3 used in the analysis), using the same resolution. Both CAM5std and MMF are run with pre-scribed sea surface temperature (year 2000 with seasonal but no year-to-year variability), three aerosol modes (MAM3), and aerosol and trace gas emissions for the year 2000 as de-scribed in Liu et al. (2012).
Figure 1 shows the DJF zonal-mean values of several quantities relevant to BC burden and wet removal from the MMF and the standard CAM5 simulations. These include the BC total column burden (B, in µg m−2), the BC surface-layer mixing ratio, the BC surface wet-deposition flux (Fw, in µg m−2day−1, which is equivalent to the column-integrated wet removal), and the BC first-order wet-removal rate (Rw, in day−1), defined as
Rw=Fw
B. (1)
Fig. 1. DJF zonal-mean values of the quantities related to BC burden and removal, as described in Eqs. (1)–(3), derived from the MMF and the standard CAM5 simulations. The column burden is the ver-tical integral from the surface to 650 hPa.
Table 1. Summary of sensitivity simulations and modifications made to the standard CAM5.
Change Inconsistency New treatment Secondary Freeze-dry Lower stratiform MAM7 with
made involving of aerosol scheme stratiform slower
in subgrid convective activation reduces in-cloud BC
simulations liquid cloud transport and above cloud liquid wet-removal aging fractions wet removal base in new cloud adjustment (instead eliminated of aerosols convection scheme fraction factor of MAM3)
CAM5std
CTRL x
CONV x x
CONV sact x x x
CONV FD x x x
CONV SF x x x
CONV m7 x x x
ALL m3 x x x x x
ALL m7 x x x x x x
The two models have substantial differences in all quan-tities that are generally strongest at high latitudes but begin at mid-latitudes. The ratio of total BC burdens between the two runs is close to 0.8 from the Equator to 35◦N, which suggests that model differences at these latitudes do not con-tribute significantly to the much-stronger differences at high latitudes. The burden difference increases gradually from 35◦N to about 55◦N, and then rapidly to about 65◦N. In the 35◦–65◦N latitude range, the BC wet-deposition flux (Fw)is slightly higher in CAM5std, and the first-order total-aerosol wet-removal rate (Rw)is almost 10 times higher. Thus the BC wet removal in CAM5std is much more efficient in this mid-latitude range. Interestingly, the near-surface BC mixing ratio is higher in CAM5std than MMF in mid-latitudes (30◦– 60◦N), which can be attributed in part to stronger aerosol resuspension from evaporating precipitation in CAM5 than in the MMF (figure not shown). Between 65◦–90◦N, the total-BC burden in CAM5std drops more gradually than in the mid-latitude range, but the surface mixing ratio declines rapidly until about 80◦N.
The other quantities shown in Fig. 1 are obtained by de-composing the wet-removal rate into three terms:
Rw=(Fw/Bc)·(Bc/hfctiB)·(hfcti). (2) HereBc is the column burden of cloud-borne BC, andhfcti is the vertically averaged liquid cloud fraction weighted by the total BC:
hfcti = hX
fliq·q·M i
/hXq·Mi=hXfliq·q·M i
/B, (3) wherefliq is the liquid cloud fraction2 in a layer, q is the total-BC mixing ratio, andMis the air mass in the layer. The 2Liquid cloud fraction here means the subgrid fractional
cover-age of stratiform clouds that contain some liquid water, and may or may not be mixed phase.
first term on the right-hand side of Eq. (2) (Fw/Bc) is the column-average first-order wet-removal rate for cloud-borne BC. At individual grid points, this rate is equal to the rate at which cloud water is converted to precipitation (by auto-conversion and collection), as calculated in the cloud micro-physics. The second term, (Bc/hfctiB), represents the ratio of cloud-borne to total BC within the subgrid areas occupied by liquid clouds. It is determined both by the activation effi-ciency for BC-containing particles and by the relative rates at which cloud-borne BC is wet-removed by precipitation ver-sus replenished via activation. The third term,hfcti, calcu-lated in the way described by Eq. (3), is BC-weighted liquid cloud fraction. Thus the three terms each represent a sub-set of the parameters that affect BC wet removal. The three terms are calculated from time-averaged quantities, so that the right-hand sides of Eqs. (1) and (2) are equal at each model grid point (or grid column). The terms could be calcu-lated for each time step, and then averaged; this would give somewhat different results numerically and would violate the equality in Eq. (2). However, since the purpose of these di-agnostic quantities is to provide insight into differences be-tween models and simulations, and inform us of sources of uncertainty, these computational nuances are of secondary importance. BC-weighted cloud-average liquid water con-tent (LWC) is calculated similar to Eq. (3) and is plotted in Fig. 1h.
term II is much smaller in CAM5std than the MMF. Term I and II tend to counteract each other at these latitudes, how-ever, and the weighted liquid cloud fraction (term III) differ-ences between the two models dominate at these latitudes. The much-smaller cloud-borne fraction (term II) north of 60◦N is likely due to too-rapid removal of cloud drops (and cloud-borne aerosol) in CAM5std, and this rapid removal is associated with its much-lower LWC (Fig. 1h). The in-cloud wet-removal rate for cloud-borne BC is proportional to the precipitation production rate (from cloud water) in a layer, divided by the LWC, so LWC can strongly influence wet removal. Liu et al. (2011b) also found that CAM5 under-predicts liquid water in Arctic stratiform clouds, leading to overly rapid removal of cloud drops and cloud-borne aerosol. 2.3 Model changes and simulation design
Based on the model diagnoses shown above, and also the evaluation of upper-tropospheric BC in Liu et al. (2012), we design a set of simulations to investigate the CAM5 model sensitivity to some of its parameterizations and assumptions involving aerosol wet removal (through in-cloud and below-cloud scavenging) and convective transport that influence aerosol (BC in particular) reaching high latitudes and the upper troposphere. The simulations are described below and summarized in Table 1. Except for the model changes noted here, all other setting in these sensitivity simulations are identical to those used in the CAM5std simulation described in Sect. 2.2. Note that the default 3-mode aerosol treatment is used unless otherwise specified in the name.
2.3.1 CTRL
An inconsistency involving the subgrid cloud fraction for liquid-containing clouds used in the droplet nucleation rou-tine versus the other cloud micro- and macrophysics rourou-tines was eliminated. At colder temperatures, the liquid cloud frac-tion used in aerosol activafrac-tion calculafrac-tions is considerably overestimated in CAM5std, and the inconsistency fix reduces the liquid cloud fraction. This CTRL simulation was primar-ily designed to serve as a better baseline for the other sensi-tivity tests (below), all of which include this change. 2.3.2 CONV
The new unified treatment of aerosol vertical transport and in-cloud wet removal by convective clouds (but with aerosol activation in updrafts only at cloud base) replaces the stan-dard CAM5 treatment. Cloud-borne aerosols in convective clouds are treated explicitly, with aerosol activation at cloud base calculated using the Abdul-Razzak and Ghan (2000) pa-rameterization. In-cloud wet scavenging and vertical trans-port of aerosols are treated simultaneously in the new scheme (see Supplement Sect. S1), which results in convective wet scavenging now affecting the grid-cell mean aerosols pri-marily at detrainment levels rather than throughout the cloud
depth. This model change, which represents an improved formulation, exposes the sensitivity of remote aerosols (up-per troposphere and high latitudes) to convective cloud pro-cesses. Note that the change does not directly impact the model’s convective cloud parameterizations involving heat, moisture and momentum.
2.3.3 CONV sact
This simulation includes changes for CONV, but secondary activation of aerosols entrained into convective updrafts (in addition to the primary activation at cloud base), followed by their in-cloud wet removal, is also included. This secondary activation increases in-cloud wet removal and reduces trans-port to the upper troposphere. This simulation investigates sensitivity of aerosol fields to the secondary activation, a pro-cess in which the correct treatment is quite uncertain in our model and all other GCMs.
2.3.4 CONV FD
The fractional areal extent of stratiform liquid-containing clouds at cold temperatures is reduced. The observation-ally based study of Garrett et al. (2011) indicated that high-latitude aerosols are sensitive to clouds with these charac-teristics, and this is also supported by the comparison be-tween CAM5 and MMF. We explore this sensitivity by vary-ing parameters associated with the stratiform cloud macro-physics, using the “freeze-dry” parameterization of Vavrus and Waliser (2008) that was already present in CAM5. It reduces liquid cloud fraction by a factor of qv/qv0 when the ambient specific humidityqvis smaller than a threshold qv0=0.006 kg kg−1. (Thisqv0 is doubled from Vavrus and Waliser, 2008). Note that alternate approaches for achieving this effect may be more desirable. Model changes in CONV are also included.
2.3.5 CONV SF
Sensitivity of aerosols to stratiform cloud wet-removal rates is investigated by lowering the stratiform in-cloud wet-removal adjustment factor from 1.0 to 0.6. Conceptually, this can be viewed as lowering one or more of the parameters that determine stratiform in-cloud wet removal (liquid cloud fraction, aerosol activation, and cloud-water removal rate). In particular, the cloud-water removal rate, determined by the stratiform micro- and macrophysics parameterizations, was found to be too rapid in CAM5 (Wang et al., 2012). Model changes in CONV are also included.
2.3.6 CONV m7
the 7-mode aerosol treatment (MAM7) of CAM5 along with the slow-aging assumptions from Liu et al. (2012): the ag-ing criterion for BC and POM in the primary carbon mode is 8 monolayers of condensed sulphate (or an equivalent amount of SOA), and the POM hygroscopicity is zero. Model changes in CONV are also included, allowing comparison of the impact of slow aging on aerosol fields to that of the other model changes.
2.3.7 ALL m3
This simulation includes all changes specifically made in CTRL, CONV, CONV sact, CONV FD and CONV SF sim-ulation to show their combined effect for the 3-mode aerosol treatment.
2.3.8 ALL m7
This includes all the changes in ALL m3, but uses the 7-mode aerosol treatment with slow aging, which is particu-larly important for BC transport to remote regions.
3 Results and model evaluation
The following sections describe how the modifications in formulations of wet removal and vertical transport change aerosol distribution in remote regions. Simulations are also compared and evaluated against long-term surface observa-tions (in terms of monthly mean BC and sulphate concen-trations) and aircraft measurements during field campaigns (in terms of BC vertical profiles). Simulations involving the new unified aerosol convective transport/removal scheme are particularly discussed to demonstrate the improvement of aerosol vertical distribution. The impact of model changes on global aerosol, cloud and precipitation properties is also evaluated.
3.1 Importance of wet removal formulations to high-latitude aerosols
Figure 2 shows the same quantities as in Fig. 1 but for the various CAM5 sensitivity simulations listed in Table 1, de-signed to expose cloud and aerosol sensitivities compared to CAM5std and MMF. All changes to the model increase BC burden at high latitudes, except for the unified convec-tive scheme. Removing internal inconsistencies in the CAM5 cloud formulations (CAM5std vs. CTRL) decreases the liq-uid cloud fraction used for aerosol activation by factor of 3 at 90◦N (Fig. 2f). As a result, the total-BC first-order removal rate (Rw) is significantly reduced, nearly tripling the BC burden in the Arctic. Introducing the improved convection treatment and aerosol secondary activation (in CONV and CONV sact) affects low-latitude column burden and wet-removal rate, but has very limited impact on mid- and high-latitude BC.
Fig. 2. Same as in Fig. 1 but including six more simulations listed in Table 1 and with a focus on the Northern Hemisphere.
BC wet removal at mid- and high latitudes. The interesting behavior at high latitudes may be important to the local BC removal and burden in the Arctic, but the results indicate that wet scavenging at mid-latitudes largely controls how much BC gets to the Arctic.
Wet removal by stratiform clouds plays a dominant role in the long-range transport of BC to the Arctic. The in-cloud re-moval rate depends physically on the rate at which cloud wa-ter is converted to precipitation, which is probably too high in CAM5 with the current auto-conversion scheme (Wang et al., 2012); however, the CAM5 treatment of aerosol in-cloud wet removal also includes a tunable parameter, the stratiform in-cloud wet-removal adjustment factor. When this parame-ter is reduced from 1.0 (in CONV) to 0.6 in CONV SF, the first-order removal rate for cloud-borne aerosols decreases significantly, and the cloud-borne aerosol lifetime and bur-den increase significantly. However, this decrease in cloud-borne removal rate (term I) and increase in cloud-cloud-borne frac-tion (term II) counteract each other, so that the decreases in total wet-removal rate and the increases in total-BC burden are rather modest.
The CONV m7 simulation has an explicit treatment of BC aging that significantly slows the in-cloud wet removal of freshly emitted BC. As shown in Fig. 2e, with the slower BC aging process, the BC cloud-borne fraction in CONV m7 is significantly lower than in MMF and CONV from 30◦N northwards. Although the liquid cloud fraction is still much higher (and LWC is much lower) in CONV m7 than in the MMF, the total removal rate is close to MMF’s at mid-latitudes (30◦–65◦N), allowing for the transport of more BC to the Arctic. The BC burden is even higher than in the MMF at all latitudes and is about 50 % higher in the Arctic. This suggests that the BC aging process is more influential than others in regulating BC wet removal in the CAM5 model. 3.2 Improvements to aerosols in high-latitude
remote regions
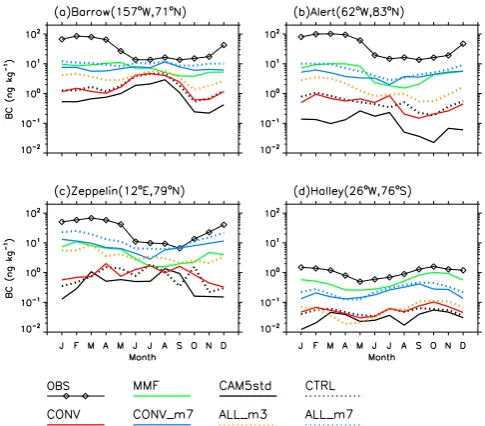
Figure 3 compares model-simulated (10 yr mean) and mea-sured seasonal variations of near-surface BC mixing ratios at three sites in the Arctic and one in the Antarctic. Measure-ments that cover different time periods at the four polar sites are obtained from various sources: (a) Barrow and (b) Alert, 1989–2003, based on Sharma et al. (2006); (c) Zeppelin, 1998–2007, from Eleftheriadis et al. (2009); and (d) Hal-ley (Antarctic), 1992–1995, from Wolff and Cachier (1998). Note that the available measurements were derived by con-verting aerosol light absorption to BC mass mixing ratios. Uncertainties in BC optical properties may contribute to an overestimation of BC mass by a factor of 1–3 (Vignati et al., 2010), although site-specific calibrations were sometimes done. Other light-absorbing aerosol species such as dust and organics can also cause an overestimation of BC mass (Shin-dell et al., 2008). Despite measurement uncertainties, it is clear that the CAM5std substantially underestimates BC in
Fig. 3. Observed and modeled monthly mean BC surface mixing ra-tios (ng kg−1)at the four polar sites: (a) Barrow, (b) Alert, (c) Zep-pelin, and (d) Halley.
the remote Arctic region, like many other climate models (Shindell et al., 2008; Koch et al., 2009b). CAM5std under-estimates BC by∼3 orders of magnitude in the Arctic haze season (i.e., winter and early spring), assuming the measure-ments are representative. The MMF is much closer to obser-vations, although it also underestimates the surface BC mix-ing ratio by up to one order of magnitude at some of the lo-cations in boreal winter and early spring. The seasonal cycle in CAM5std surface BC is also wrong: observations show a maximum in winter and early spring and a minimum in sum-mer and fall, while the modeled maximum is in sumsum-mer.
Fig. 4. Observed and modeled monthly mean non-sea-salt sul-phate mixing ratios (µg kg−1)at the four Arctic sites: (a) Barrow, (b) Alert, (c) Zeppelin, and (d) Nord.
than in summer. The “best” combination of modifications in ALL m7 gives BC mixing ratios comparable to, often times even higher than, the MMF’s, although still lower than ob-servations during the Arctic haze season.
Some of the modifications to CAM5 also affect the trans-port of other aerosol species to the Arctic. Figure 4 shows the seasonal cycles of sulphate mixing ratio as simulated in the various simulations and measured at four Arctic sites: (a) Barrow, 1997–2008 (Quinn et al., 2007); (b) Alert, 1995– 2002 (data available through the Canadian National Atmo-spheric Chemistry Database and Analysis System); (c) Zep-pelin, 1995–2005 (data available through the European Mon-itoring and Evaluation Programme (EMEP) database); and (d) Nord, Greenland, 1992–1995 (Heidam et al., 1999). Overall, sulphate mass mixing ratios in the CAM5std are also strongly underpredicted, especially during the haze season. They are substantially increased by the model improvements involving liquid cloud fraction and stratiform in-cloud wet-removal adjustment factor, but the new convective processing has little impact. Seasonality at Barrow and Zeppelin, which is poorly simulated in CAM5std, is somewhat improved in the ALL m3 and ALL m7 simulations.
Note that the 7-mode slower BC aging simulations (CONV m7 and ALL m7), which give the greatest improve-ment in simulated BC at high-latitude sites, do not improve sulphate mixing ratios relative to the 3-mode simulations (CONV and ALL m3). This is not surprising, as the 7-mode treatment of BC (and POM) and the slower aging criterion have little direct impact on sulphate, which is predominantly in the accumulation mode in both cases. In fact, sulphate mixing ratios in simulations with the 7-mode aerosol are
often somewhat lower than the 3-mode simulations. The ex-plicit treatment of ammonia/ammonium in the 7-mode simu-lations leads to more efficient aqueous conversion of SO2to sulphate (Liu et al., 2012), less transport of SO2to the Arctic, and less production of sulphate from SO2there.
Sulphate mixing ratios at Alert, Barrow, and Zeppelin are simulated more accurately than BC mixing ratios when com-pared to the corresponding measurements, suggesting that the discrepancy in BC prediction is partially related to un-certainties in the BC measurements (i.e., the contamination by other light-absorbing species and the conversion of light absorption to mass mixing ratio) and/or BC emissions. How-ever, there are significant differences in the sources and life-cycles of BC (a primary pollutant) and sulphate (a secondary pollutant) moving to the remote Arctic. Discrepancies in sea-sonality exist for both BC and sulphate (even in the MMF simulation), which are more likely due to the representation of associated aerosol–cloud processes in the model.
3.3 Improvements to aerosol vertical transport and distribution
It is important to simulate the correct vertical distribution of aerosols. Some aerosol species in the mid- and upper tropo-sphere may affect ice cloud formation (e.g., Fan et al., 2012). Vertical distribution of light-absorbing aerosols, like BC, in-fluences local radiative heating and, consequently, the ther-modynamic structure and circulation. Here we take BC as an example (also due to the availability of observations) to eval-uate the impact of model modifications on aerosol vertical distribution.
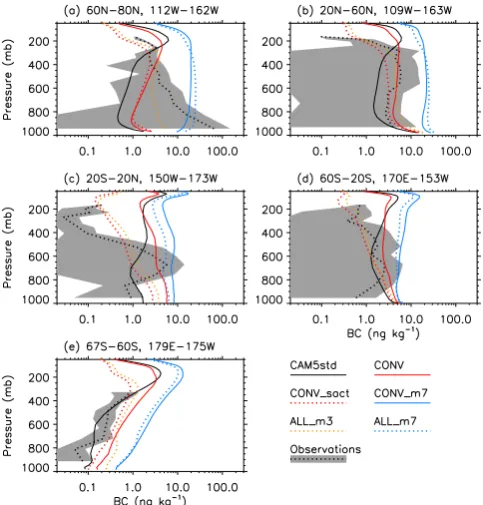
As shown in Fig. 5, the zonal average vertical distribution of the BC mixing ratio from the CAM5std simulation shows a very different vertical structure compared to the MMF sim-ulation, not just at high latitudes where BC mixing ratios are much lower in CAM5std at all levels. Additionally, the Arc-tic BC mixing ratio is greatest in the upper troposphere in the CAM5std simulation. Improvements in the CTRL simu-lation increase BC over high-latitude regions, but the features in the upper troposphere still exist. The unified treatment of convective transport and in-cloud wet removal (in CONV) has little impact on the Arctic BC mixing ratios (compared to CTRL), but it significantly increases tropical BC mixing ratios below 600 hPa. This is because convective in-cloud wet removal in the new treatment is applied to aerosol in up-drafts (which would otherwise be transported out of these levels) and thus mostly reduces grid-cell mean aerosol con-centrations at detrainment levels, while convective wet re-moval in the older treatment removes aerosols at these lev-els (<600 hPa) before the transport. When including aerosol secondary activation in the new convective transport scheme (CONV sact), the upper-troposphere BC peak over the Arc-tic and lower latitudes is eliminated.
Fig. 5. Vertical and meridional distribution of DJF zonal-mean BC mass mixing ratios (ng kg−1)from the various simulations. White areas between the black line and horizontal axis indicate zonal-mean topography.
troposphere and to high latitudes (CONV m7 vs. CONV). The individual cross-sections of accumulation mode and pri-mary carbon mode BC for CONV m7 (not shown) suggest that the Arctic BC in CONV m7 is mostly transported in the primary carbon mode originating from mid-latitudes (30◦– 60◦N). The aging is slow enough to allow considerably more upward and poleward transport. Further combining with the aforementioned modifications related to wet removal in-creases BC mixing ratios almost everywhere (ALL m7 vs. CONV m7).
Figures 6, 7 and 8 compare vertical profiles of BC mix-ing ratios from selected model simulations to observations from the first HIAPER Pole-to-Pole Observations campaign (HIPPO1) in January 2009 (Schwarz et al., 2010) and from field campaigns at other locations and times (Koch et al., 2009b). The observed profiles represent averages of high temporal/spatial resolution measurements along flight tracks in certain latitude–longitude ranges (a profile may contain observations from just one or two flights or from several
Fig. 6. Vertical profiles of BC mass mixing ratios (ng kg−1)from HIPPO1 observations in January 2009 (dotted lines for the mean along flight tracks; shaded area representing one standard deviation on each side of the mean) and model simulations (colored lines for simulations described in Table 1). Profiles from model output (10 yr January mean) are sampled along flight tracks within the latitude– longitude range for each panel.
flights), while model profiles are sampled from climatolog-ical (10 yr) monthly means at closest proximity to flight lo-cations and times. As argued by Koch et al. (2009b), there are some potential problems for detailed comparison of tem-porally/spatially resolved observations to model monthly means; nevertheless, some useful broad tendencies can be derived from the comparison.
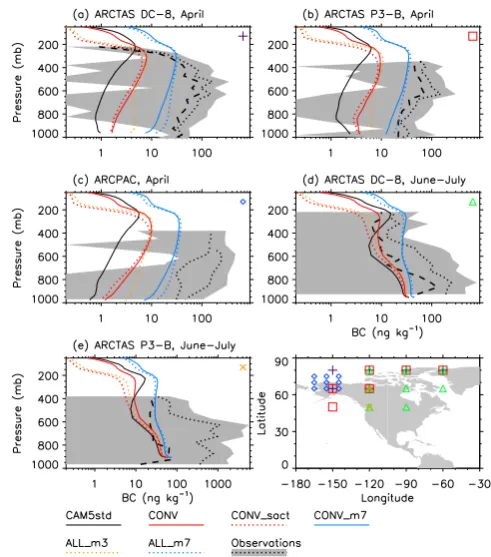
The standard CAM5 simulation (CAM5std) shows vary-ing performance in comparison to the observations. BC mix-ing ratios are too low in the Arctic in winter (Fig. 6a) and spring (Fig. 8a–c). They are also too high in the upper tropo-sphere and lower stratotropo-sphere (UTLS) in the tropics (Figs. 6c and 7b and c) and some mid-latitudes (Figs. 6d and 7a). There is a consistent UTLS maximum that is more pro-nounced than in the observations. Koch et al. (2009b) found that the AeroCom models also have high biases (exceeding mean plus one standard deviation of observations) at higher altitudes in the tropics and mid-latitudes.
Fig. 7. Same as Fig. 6 but for different locations (the tropics and mid-latitudes) and months. Black dashed line (if present) is the me-dian profile of observed BC (ng kg−1). In (a) the two black dotted lines are for two sampling days. Biomass burning was encountered in (d). Symbols over the map in the bottom panel indicate the ap-proximate geographical location of the observed profiles for each field campaign, and simulated profiles represent averages over these locations. More information about the observations is available in Koch et al. (2009b; Fig. 9 and Table 7).
entrainment accounts for a significant fraction of the up-draft mass flux in the CAM5 deep convection treatment, and, without secondary activation, BC entrained above cloud base is transported upwards rather than being activated and removed. The somewhat-higher BC in the lower and mid-troposphere with CONV and CONV sact (compared to CAM5std) is largely due to the changes in liquid cloud frac-tion implemented in CTRL (not shown), except in the tropics. Additional model changes in ALL m3 (involving reduced liquid cloud fraction and stratiform in-cloud wet-removal ad-justment factor) further increase lower to mid-troposphere BC, particularly in the Arctic winter and spring profiles (Figs. 6a and 8a–c).
In the 7-mode slow-aging simulations (CONV m7 and ALL m7), BC increases noticeably in all the profiles com-pared to the corresponding 3-mode simulations (CONV and ALL m3), and the UTLS maximum re-appears. These in-creases reduce the Arctic low biases for spring (Fig. 8a–c) and winter (Fig. 6a, lower troposphere only), but the simu-lated BC is too high for many of the profiles (Figs. 6b–e and 7a and b). Compared to the HIPPO1 observations, Schwarz et al. (2010) showed that the ensemble mean of the AeroCom
Fig. 8. Same as Fig. 7 but for the high latitudes over North America. In (c), the higher BC mixing-ratio profile (ng kg−1)is for flights that sampled episodic biomass burning plumes, and the lower mixing-ratio profile is for aged Arctic air. The mean profiles in (d) and (e) were also affected by summer smoke plumes.
suite of global model simulations (using different BC emis-sions; Dentener et al., 2006) overestimated BC by a factor of 5, on average, for the entire dataset. For the CAM5std, CONV sact, ALL m3, and ALL m7 simulations, the median ratios of simulated to observed BC are 1.1, 0.9, 1.0, and 7.2, respectively. The CONV sact and ALL m3 do moderately well by these metrics (even though strongly underpredicting BC in the Arctic lower troposphere), while the 7-mode slow-aging simulation overpredicts BC because of too-slow wet removal and too much vertical transport.
Table 2. Global annual BC budgets in MMF and CAM5 simula-tions.
Simulation Wet deposition Dry deposition Burden Lifetime (Tg C yr−1) (Tg C yr−1) (Tg C) (day)
MMF 6.03 1.70 0.140 6.6
CAM5std 6.44 1.33 0.083 3.9
CTRL 6.40 1.36 0.091 4.3
CONV 6.32 1.43 0.111 5.2
CONV sact 6.37 1.37 0.090 4.2
CONV FD 6.29 1.45 0.112 5.3
CONV SF 6.22 1.52 0.123 5.8
CONV m7 5.98 1.77 0.168 7.9
ALL m3 6.26 1.48 0.099 4.7
ALL m7 5.90 1.84 0.158 7.5
3.4 Impact of model changes on global aerosol budgets and distributions
Tables 2 and 3 summarize the impact of model changes on the global BC and non-sea-salt sulphate budget, respectively. All the modifications increase BC and sulphate burden di-rectly or indidi-rectly by reducing wet-deposition rates and in-creasing aerosol lifetimes.
Correcting the inconsistency involving liquid-containing cloud fraction within the model (CTRL simulation) increases global annual BC and sulphate burden by about 10 %. The new unified convective transport and wet removal scheme without secondary activation (CONV) further increases the annual BC burden by 22 % and sulphate burden by 45 %. However, the unified convective scheme with secondary ac-tivation (CONV sact), and thus more in-cloud wet removal, introduces almost no BC burden change and a much-smaller sulphate burden change relative to CTRL. The larger burden changes for sulphate vs. BC are due to different vertical pro-files (sulphate mixing ratio generally decreases more slowly with height than does BC), and to the wet removal in the mid-troposphere being relatively weak in the new convec-tive treatment compared to the older one. Reducing liquid cloud fraction under cold/dry conditions using the freeze-dry scheme (CONV FD) substantially increases atmospheric BC and sulphate burden in high latitudes, but it has little impact on the global annual burden that is dominated by sources and sinks at lower and mid-latitudes. Reducing the stratiform in-cloud wet-removal adjustment factor (CONV SF) has lim-ited impact on the annual burden, because the stratiform wet removal decrease is compensated by increases in convective wet removal and dry deposition.
Note that the total source for sulphate differs among the simulations because of differences in SO2conversion to sul-phate versus SO2 wet and dry removal. The SO2 aqueous conversion is much stronger in the MMF, so its total source (59.8 Tg S yr−1) and burden for sulphate are considerably higher than in the CAM5std (Wang et al., 2011b) and the sensitivity simulations, although the higher MMF burden is
Table 3. Global annual (non-sea-salt) sulphate aerosol budgets in MMF and CAM5 simulations.
Simulation Wet deposition Dry deposition Burden Lifetime (Tg S yr−1) (Tg S yr−1) (Tg S) (day)
MMF 50.84 8.97 1.014 6.2
CAM5std 37.74 4.96 0.438 3.7
CTRL 37.67 5.10 0.493 4.2
CONV 37.41 5.86 0.714 6.0
CONV sact 37.74 5.56 0.595 5.0
CONV FD 37.49 6.06 0.721 6.0
CONV SF 36.20 6.54 0.804 6.9
CONV m7 39.97 6.29 0.709 5.6
ALL m3 36.62 6.49 0.678 5.7
ALL m7 38.88 7.10 0.688 5.5
partly due to longer sulphate lifetime (from slower wet re-moval).
Slower BC aging by itself causes a substantial increase in global BC burden. Both ALL m7 and CONV m7 have BC burdens (0.16–0.17 Tg C) and lifetimes (7.5–7.9 days) that are close to some previous studies (e.g., Textor et al., 2007; Koch et al., 2009b; Liu et al., 2011a) that used similar BC emission inventories. In comparison, the ALL m3 (no BC aging but other improvements) has 37 % smaller burden and lifetime. Other studies with somewhat-higher emissions pro-duced BC burdens of 0.2–0.3 Tg C. In the first AeroCom in-tercomparison (Textor et al., 2006), the median emissions, burden, and lifetime were 11.3 Tg C yr−1, 0.21 Tg C, and 6.54 days, respectively. With BC emission of 10.9 Tg C yr−1, Huang et al. (2010) estimate an annual average BC burden of 0.28 Tg C and lifetime of 9.2 days. Actual BC burdens may be even higher, as Koch et al. (2009b) showed that for the AeroCom models the simulated column BC burden over six regions is about half of that estimated from AERONET retrievals.
We also compare monthly aerosol optical depth (AOD) and aerosol absorption optical depth (AAOD) at 550 nm pre-dicted by CAM5 to AERONET retrievals for the years of 1998–2005 (e.g., Liu et al., 2012). Global and regional means are summarized in Table 4. The CAM5std strongly under-estimates AOD and AAOD in all of the regions. AOD and AAOD increase by varying degrees in other simulations, con-sistent with the trends in BC and sulphate burdens (Tables 2 and 3), suggesting that the modifications to CAM5 aimed to improve aerosols in remote regions improve the simulation of aerosols in near-source regions as well. The dramatic in-crease in AOD and AAOD in simulations with 7-mode slow aging (ALL m7 vs. ALL m3) is primarily due to higher BC and POM burdens in some regions, although higher dust bur-dens simulated by MAM7 (due to differences in the fine-mode dust treatments, Liu et al., 2012) also contribute, es-pecially in N. Africa.
Table 4. Global and regional mean observed and simulated AOD and AAOD (in parentheses). Observed values are from AERONET sites. Number of sites for each region is also in parentheses.
Case E. Asia S. Asia Europe N. Africa S. Africa N. America S. America Global
(11) (5) (14) (6) (3) (23) (4) (75)
Observed 0.339 (0.027) 0.391 (0.041) 0.183 (0.015) 0.515 (0.046) 0.183 (0.021) 0.133 (0.007) 0.208 (0.024) 0.213 (0.017) CAM5std 0.134 (0.017) 0.090 (0.010) 0.080 (0.009) 0.286 (0.032) 0.075 (0.009) 0.066 (0.006) 0.100 (0.008) 0.111 (0.012) CTRL 0.158 (0.020) 0.093 (0.010) 0.093 (0.010) 0.287 (0.032) 0.078 (0.010) 0.074 (0.007) 0.103 (0.008) 0.122 (0.013) CONV 0.180 (0.020) 0.157 (0.012) 0.112 (0.010) 0.410 (0.041) 0.092 (0.011) 0.095 (0.008) 0.155 (0.011) 0.153 (0.014) CONV sact 0.165 (0.019) 0.131 (0.011) 0.100 (0.010) 0.360 (0.036) 0.081 (0.010) 0.086 (0.007) 0.126 (0.009) 0.136 (0.013) CONV FD 0.190 (0.021) 0.156 (0.013) 0.113 (0.010) 0.404 (0.041) 0.093 (0.011) 0.096 (0.008) 0.152 (0.011) 0.154 (0.014) CONV SF 0.217 (0.024) 0.191 (0.015) 0.128 (0.011) 0.455 (0.047) 0.107 (0.012) 0.110 (0.009) 0.182 (0.013) 0.175 (0.016) CONV m7 0.236 (0.028) 0.197 (0.018) 0.142 (0.013) 0.562 (0.050) 0.133 (0.014) 0.137 (0.011) 0.219 (0.016) 0.204 (0.019) ALL m3 0.197 (0.022) 0.154 (0.012) 0.122 (0.011) 0.408 (0.042) 0.093 (0.011) 0.102 (0.008) 0.147 (0.010) 0.159 (0.015) ALL m7 0.254 (0.029) 0.191 (0.017) 0.164 (0.015) 0.557 (0.050) 0.126 (0.013) 0.142 (0.012) 0.202 (0.014) 0.210 (0.019)
IMPROVE and EMEP networks. The surface BC concentra-tions in our simulaconcentra-tions are also compared to observaconcentra-tions from four networks or compilations (see Table S1 in the Sup-plement). The changes between the various simulations are considerably smaller at these surface sites than the changes to the global annual burdens (Table 2). This is not surprising for the IMPROVE (continental US), EMEP (Europe), and China sites, which are relatively close to sources (on a global scale). The simulated values for the base model configurations are lower than observed, so model changes that increase BC bur-den and transport to the Arctic also reduce the CAM5 low bias for these datasets. All the simulations strongly underes-timate the China observations, suggesting that BC emissions for this region may be significantly underestimated.
Similar information for surface sulphate concentrations, using observations from the IMPROVE, EMEP, and U. Mi-ami (marine sites) networks, is provided in the Supplement (Table S2). The changes between the various simulations are larger than those for BC, but the changes are still smaller than the global annual burden changes. As with BC, the changes increase sulphate mixing ratios, which increase the high bias for the IMPROVE and EMEP continental sites, but improve (and even reverse) the low bias for the remote marine sites. 3.5 Impact of model changes on clouds and
precipitation
Figure 9 compares meridional distributions of annual zonal-mean cloud liquid water path (LWP), ice water path (IWP), precipitation rate and cloud forcing from the various simu-lations. Differences relative to the CAM5std are plotted to illustrate the changes between simulations. Global mean val-ues are summarized in Table S3. Comparing to observations used in Wang et al. (2011b; and references therein), global annual mean values are improved to varying degrees by the modifications to the CAM5std. Model biases in LWP and precipitation rate are reduced. Mean LWP becomes closer to, if not within, the observed range of 50–84 g m−2. IWP has much-smaller variation between the CAM5 simulations.
Fig. 9. Meridional variation of annual mean differences (sen-sitivity simulation minus CAM5std) of (a) liquid water path (LWP, g m−2), (b) ice water path (IWP, g m−2), (c) total precipi-tation rate (mm day−1), (d) shortwave cloud forcing, and (e) long-wave cloud forcing for the various simulations.
cloud forcing are strengthened by most of the model changes, with SWCFs all in the observed−46 to−53 W m−2range, and LWCFs mostly closer to the observed 27 to 31 W m−2 range.
The CAM5std simulates a much-smaller global mean LWP (41.2 g m−2) than the observed range, which implies too-rapid conversion of cloud water to precipitation and is consistent with the too-strong wet removal of BC and other aerosols. The new treatment of convective transport and wet removal (in CONV) increases LWP by up to 15 g m−2 near the Equator, 3 g m−2 in the Arctic (which is substan-tial there), and 5.9 g m−2 globally, with about 75 % of the increase in stratiform clouds. With aerosol secondary activa-tion in convective clouds, the increase in LWP (CONV sact vs. CTRL) is somewhat less. Other changes (CONV FD and CONV SF) further increase LWP. Most of the model improvements (except for the freeze-dry scheme) involve changes to the treatments of aerosol aging, activation, wet removal, and/or convective transport, rather than directly to the cloud macro- and microphysics. The resulting LWP in-creases are thus due to aerosol indirect effects, and probably the reason that LWP has a high sensitivity to aerosol loading in CAM5 (Wang et al., 2011b). This can also have feedback on aerosols because with higher liquid water the cloud-water removal rate and thus aerosol in-cloud scavenging in strati-form clouds are slower. Note that with slow aging, BC and POM concentrations are higher, but POM hygroscopicity is lower (zero), resulting in small decreases in cloud condensa-tion nuclei (CCN) and LWP.
There are also changes in IWP (Fig. 9b), likely caused by changes to liquid water in mixed-phase clouds and to global distributions of aerosols that act as ice nuclei (particularly in the upper troposphere and the Arctic). Along with the LWP changes, they affect both SW and LW cloud forcings, hav-ing implications for aerosol indirect forchav-ing in the modified CAM5 model.
4 Discussion and conclusions
Many global aerosol and climate models, including the Com-munity Atmosphere Model version 5 (CAM5), produce rel-atively poor simulations of aerosols in remote regions (i.e., high latitudes and upper troposphere) compared to regions close to major sources. In this study we have evaluated (and in some cases improved) process representations asso-ciated with aerosol–cloud interactions, cloud microphysics and macrophysics, aerosol transformation, convective trans-port and aerosol wet removal in CAM5 that are key to de-termining the amount of aerosols reaching remote regions. Sensitivity simulations were analyzed to understand the role of each of the processes and to identify sources of uncertain-ties. The evaluation and improvement were guided by sur-face and aircraft measurements together with results from the PNNL-MMF multi-scale aerosol–climate model, which
has more-explicit representations of convection and the cloud processes that drive aerosol–cloud interactions. Our focus in the model evaluation was on BC aerosol, but the modifica-tions have had a generally beneficial effect on the simulation of other aerosol species (e.g., sulphate) and of total AOD.
Wet removal is the dominant and most uncertain process in determining the atmospheric residence time of submicron aerosol particles and, therefore, the distance they can travel from sources during their lifetime. Wet removal in CAM5 consists of several mechanisms/processes that occur in and below convective and stratiform clouds. The most efficient wet-removal mechanism for submicron aerosol is nucleation scavenging in liquid clouds. At mid- and high latitudes dur-ing winter months, this primarily involves stratiform clouds. For this wet removal to take place, aerosol particles must be viable CCN and encounter a precipitating liquid-containing cloud. Thus the subgrid liquid cloud fraction is important in determining the fraction of aerosols that are activated and subsequently removed. Comparison with MMF suggests that the more frequent liquid-containing cloud at mid- and high latitudes simulated by CAM5 is a key contributor to the ex-cessive removal of aerosols during their transport to the Arc-tic. Improving the internal consistency of the liquid cloud fraction used for aerosol activation and associated droplet nucleation in the standard CAM5 leads to nearly 3-fold in-creases in the Arctic BC burden in DJF months. Further re-ducing the amount of liquid-water-containing clouds under dry/cold conditions in CAM5 by an ad hoc solution (called “freeze-dry” by Vavrus and Waliser, 2008) doubles the BC burden in the high latitudes. With all improvements related to wet removal combined, the Arctic BC burden has a 10-fold (5-10-fold) increase in the DJF (JJA) months, resulting in a better prediction of seasonal cycle as well. Arctic sulphate and dust burdens are also increased but to a lesser extent.
than BC) in the Arctic, the 7-mode slow-aging representa-tion has minimal impact on sulphate. This suggests that the remaining low bias of Arctic BC in CAM5 is more likely contributed by processes other than the fast BC aging in the 3-mode aerosol module.
In-cloud wet scavenging of BC and other aerosol species in ice clouds is currently not treated in CAM5, because ice-nucleation scavenging affects a much-smaller number of particles than does droplet-nucleation scavenging. There is more uncertainty in how much BC is removed in ice clouds and mixed-phase clouds compare to liquid clouds. Cozic et al. (2007) measured 8 %–17 % removal by mixed-phase clouds relative to 60 % removal by liquid clouds during win-ter at Jungfraujoch (46.5◦N, 8◦E). Koch et al. (2009a) found that 12 % removal by frozen precipitation relative to removal by liquid clouds in their model gave an optimal agreement with observations. Browse et al. (2012) found that suppress-ing ice-cloud scavengsuppress-ing in a global aerosol model results in a large increase in wintertime BC and the correct seasonal cy-cle. On the other hand, as discussed by Koch et al. (2009b), ignoring aerosol removal by ice may contribute to the ex-cessive BC aloft. However, they also found that enhancing removal by convective clouds successfully reduced the BC aloft in the GISS model. In this study we also introduced a new unified scheme for convective transport and wet removal of aerosols in CAM5, with an option to treat secondary acti-vation of aerosols entrained into convective clouds. This new scheme effectively reduces the BC aloft and better simulates the observed BC profiles with decreasing mixing ratios in the mid- to upper troposphere, especially in the tropics and mid-latitudes. Croft et al. (2012) also found that treatments of scavenging of aerosols entrained above cloud base strongly affect aerosol concentrations in the upper troposphere.
Despite all the model improvements, surface-level BC and sulphate mixing ratios at the remote Arctic sites are still significantly underpredicted, particularly for the winter and early-spring haze season. The long-term surface measure-ments cover different time periods for some sites, over which aerosol sources have likely changed. There are also many un-certainties in BC surface measurements (e.g., Shindell et al., 2008; Koch et al., 2009b; Vignati et al., 2010), which may ex-plain part of the discrepancy, but there is likely more room for improvement in the long-range-transport-related processes in the CAM5 (e.g., Ma et al., 2013) and in the aerosol emission inventories used for the simulations (Lamarque et al., 2010). The global annual BC emissions for the year 2000 are about 7.8 Tg C yr−1, which is on the lower side of the range used by a variety of global models – for example, the diverse BC emission rates used by the AeroCom model intercomparison study range from 7.5 to 19 Tg C yr−1(Textor et al., 2006; Liu et al., 2011a), indicating large uncertainties in BC emission inventory. Bond et al. (2004) used bottom-up estimates of un-certainties in source strength to show that global annual BC emissions could range between 4.3 and 22 Tg C yr−1. The re-gional distribution of emissions is also important for aerosols
reaching remote regions such as the Arctic. In our sensitivity simulation with emission inventories for the year 1980 (see details in the Supplement), the global annual BC emission rate is lower, but the DJF BC emission rate over 40◦–70◦N is 50 % higher. The 50 % higher BC emissions over 40◦–70◦N translates to a 50 % higher BC burden and 70 % higher BC surface mixing ratio north of 50◦N. There is also a similar impact of higher SO2 emissions over 40◦–70◦N on Arctic sulphate mixing ratios. This confirms the important role of aerosol and precursor sources in mid- and high latitudes in affecting Arctic aerosol abundance, and suggests that current emissions are likely underestimated, as also shown by Wang et al. (2011).
Our modifications to CAM5 were targeted at improv-ing the simulation of high-latitude and upper-tropospheric aerosols. However, comparison of model-simulated aerosol optical properties to AERONET retrievals and mixing ratios to surface site measurements shows improvements globally and over various regions. Moreover, a number of the modi-fications led to improvements in the climate simulation such as increases in LWP, which is too low in the standard CAM5. The simulation with the unified convective transport/removal and secondary activation has some of the largest improve-ments in LWP and cloud forcing compared to the standard and control simulations, and these changes can be attributed to changes in aerosol distributions and resulting feedbacks. These results warrant further exploration into aerosol indirect and semi-direct effects in CAM5 with our new modifications, using the methodology developed by Ghan et al. (2012). Supplementary material related to this article is available online at: http://www.geosci-model-dev.net/6/ 765/2013/gmd-6-765-2013-supplement.pdf.
Acknowledgements. This research was supported by the Office of Science of the US Department of Energy (DOE) as part of the Earth System Modeling Program. The Pacific Northwest National Laboratory (PNNL) is operated for DOE by Battelle Memorial Institute under contract DE-AC05-76RLO1830. The CESM project is supported by the National Science Foundation and the DOE Office of Science. The development of the PNNL-MMF was supported by the NASA Interdisciplinary Science Program under grant NNX07AI56G and the DOE Office of Science, Decadal and Regional Climate Prediction using Earth System Models (EaSM) program. We thank D. Koch for providing BC profiles and helpful discussion, J. P. Schwarz for providing the HIPPO BC profiles, and many scientists, engineers and support staff for their efforts in making all the datasets available for our model evaluation. Compu-tational resources were provided by the National Energy Research Scientific Computing Center (NERSC), a national scientific user facility located at Lawrence Berkeley National Laboratory in Berkeley, California. NERSC is the flagship scientific computing facility for the Office of Science in DOE.
References
Abdul-Razzak, H. and Ghan, S. J.: A parameterization of aerosol activation 2, Multiple aerosol types, J. Geophys. Res.-Atmos., 105, 6837–6844, 2000.
Adler, R. F., Huffman, G. J., Chang, A., Ferraro, R., Xie, P., Janowiak, J., Rudolf, B., Schneider, U., Curtis, S., Bolvin, D., Gruber, A., Susskind, J., and Arkin, P.: The Version 2 Global Precipitation Climatology Project (GPCP) Monthly Precipitation Analysis (1979–Present), J. Hydrometeor., 4, 1147–1167, 2003. Albrecht, B.: Aerosols, cloud microphysics, and fractional
cloudi-ness, Science, 245, 1227–1230, 1989.
Bond, T. C., Streets, D. G., Yarber, K. F., Nelson, S. M., Woo, J. H., and Klimont, Z.: A technology-based global inventory of black and organic carbon emissions from combustion, J. Geo-phys. Res., 109, D14203, doi:10.1029/2003JD003697, 2004. Boucher, O.: GCM estimate of the indirect aerosol forcing
us-ing satellite-retrieved cloud droplet effective radii, J. Climate, 8, 1403–1409, 1995.
Bourgeois, Q. and Bey, I.: Pollution transport efficiency toward the Arctic: Sensitivity to aerosol scavenging and source regions, J. Geophys. Res., 116, D08213, doi:10.1029/2010JD015096, 2011. Browse, J., Carslaw, K. S., Arnold, S. R., Pringle, K., and Boucher, O.: The scavenging processes controlling the seasonal cycle in Arctic sulphate and black carbon aerosol, Atmos. Chem. Phys., 12, 6775–6798, doi:10.5194/acp-12-6775-2012, 2012.
Collins, W. D., Rasch, P. J., Eaton, B. E., Khattatov, B., Lamarque, J.-F., and Zender, C. S.: Simulating aerosols using a chemical transport model with assimilation of satellite aerosol retrievals: Methodology for INDOEX. J. Geophys. Res., 106, 7313–7336, doi:10.1029/2000JD900507, 2001.
Cozic, J., Verheggen, B., Mertes, S., Connolly, P., Bower, K., Petzold, A., Baltensperger, U., and Weingartner, E.: Scav-enging of black carbon in mixed phase clouds at the high alpine site Jungfraujoch, Atmos. Chem. Phys., 7, 1797–1807, doi:10.5194/acp-7-1797-2007, 2007.
Croft, B., Pierce, J. R., Martin, R. V., Hoose, C., and Lohmann, U.: Uncertainty associated with convective wet removal of en-trained aerosols in a global climate model, Atmos. Chem. Phys., 12, 10725–10748, doi:10.5194/acp-12-10725-2012, 2012. Dentener, F., Kinne, S., Bond, T., Boucher, O., Cofala, J., Generoso,
S., Ginoux, P., Gong, S., Hoelzemann, J. J., Ito, A., Marelli, L., Penner, J. E., Putaud, J.-P., Textor, C., Schulz, M., van der Werf, G. R., and Wilson, J.: Emissions of primary aerosol and precur-sor gases in the years 2000 and 1750 prescribed data-sets for Ae-roCom, Atmos. Chem. Phys., 6, 4321–4344, doi:10.5194/acp-6-4321-2006, 2006.
Doherty, S. J., Warren, S. G., Grenfell, T. C., Clarke, A. D., and Brandt, R. E.: Light-absorbing impurities in Arctic snow, Atmos. Chem. Phys., 10, 11647–11680, doi:10.5194/acp-10-11647-2010, 2010.
Eleftheriadis, K., Vratolis, S., and Nyeki, S.: Aerosol black car-bon in the European Arctic: Measurements at Zeppelin station, Ny- ˚Alesund, Svalbard from 1998–2007, Geophys. Res. Lett., 36, L02809, doi:10.1029/2008GL035741, 2009.
Fan, S.-M., Schwarz, J. P., Liu, J., Fahey, D. W., Ginoux, P., Horowitz, L. W., Levy II, H., Ming, Y., and Spack-man, J. R.: Inferring ice formation processes from global-scale black carbon profiles observed in the remote atmo-sphere and model simulations, J. Geophys. Res., 117, D23205,
doi:10.1029/2012JD018126, 2012.
Feingold, G., Koren, I., Wang, H., Xue, H., and Brewer, W. A.: Precipitation-generated oscillations in open cellular cloud fields, Nature, 466, 849–852, 2010.
Flanner, M. G., Zender, C. S., Randerson, J. T., and Rasch, P. J.: Present-day climate forcing and response from black carbon in snow, J. Geophys. Res.-Atmos., 112, D11202, doi:10.1029/2006jd008003, 2007.
Fridlind, A. M., Ackerman, A. S., Jensen, E. J., Heymsfield, A. J., Poellot, M. R., Stevens, D. E., Wang, D., Miloshevich, L. M., Baumgardner, D., Lawson, R. P., Wilson, J. C., Flagan, R. C., Seinfeld, J. H., Jonsson, H. H., VanReken, T. M., Varutbangkul, V., and Rissman, T. A.: Evidence for the predominance of mid-tropospheric aerosols as subtropical anvil nuclei, Science, 303, 718–722, 2004.
Garrett, T. J., Brattstr¨om, S., Sharma, S., Worthy, D. E. J., and Nov-elli, P.: The role of scavenging in the seasonal transport of black carbon and sulfate to the Arctic, Geophys. Res. Lett., 38, L16805, doi:10.1029/2011GL048221, 2011.
Gettelman, A., Morrison, H., and Ghan, S. J.: A new two-moment bulk stratiform cloud microphysics scheme in the com-munity atmosphere model, version 3 (CAM3), Part II: Sin-gle column and global results, J. Climate, 21, 3660–3679, doi:10.1175/2008jcli2116.1, 2008.
Ghan, S. J., Liu, X., Easter, R. C., Zaveri, R., Rash, P. J., Yoon, J.-H., and Eaton, B.: Toward a minimal representation of aerosols in climate models: Comparative decomposition of aerosol direct, semi-direct and indirect radiative forcing, J. Climate, 25, 6461– 6476, doi:10.1175/JCLI-D-11-00650.1, 2012.
Heidam, N. Z., W˚ahlin, P., and Christensen, J. H.: Tropospheric gases and aerosols in northeast Greenland. J. Atmos. Sci., 56, 261–278, 1999.
Huang, L., Gong, S. L., Jia, C. Q., and Lavou´e, D.: Importance of deposition processes in simulating the seasonality of the Arctic black carbon aerosol, J. Geophys. Res., 115, D17207, doi:10.1029/2009JD013478, 2010.
Kinne, S., Schulz, M., Textor, C., Guibert, S., Balkanski, Y., Bauer, S. E., Berntsen, T., Berglen, T. F., Boucher, O., Chin, M., Collins, W., Dentener, F., Diehl, T., Easter, R., Feichter, J., Fillmore, D., Ghan, S., Ginoux, P., Gong, S., Grini, A., Hendricks, J., Herzog, M., Horowitz, L., Isaksen, I., Iversen, T., Kirkev˚ag, A., Kloster, S., Koch, D., Kristjansson, J. E., Krol, M., Lauer, A., Lamarque, J. F., Lesins, G., Liu, X., Lohmann, U., Montanaro, V., Myhre, G., Penner, J., Pitari, G., Reddy, S., Seland, O., Stier, P., Take-mura, T., and Tie, X.: An AeroCom initial assessment – optical properties in aerosol component modules of global models, At-mos. Chem. Phys., 6, 1815–1834, doi:10.5194/acp-6-1815-2006, 2006.
Koch, D. and Del Genio, A. D.: Black carbon semi-direct effects on cloud cover: review and synthesis, Atmos. Chem. Phys., 10, 7685–7696, doi:10.5194/acp-10-7685-2010, 2010.
Koch, D., Menon, S., Del Genio, A., Ruedy, R., Alienov, I., and Schmidt, G.: Distinguishing aerosol impacts on cli-mate during the past century, J. Clicli-mate, 22, 2659–2677, doi:10.1175/2008JCLI2573.1, 2009a.