O R I G I N A L A R T I C L E
Open Access
Performance of newly developed body
mass index cut-off for diagnosing obesity
among Ethiopian adults
Makeda Sinaga
1*, Tilahun Yemane
2, Elsah Tegene
3, David Lidstrom
4and Tefera Belachew
1Abstract
Background:Obesity is defined as unhealthy excess body fat, which increases the risk of premature mortality from noncommunicable diseases. Early screening and prevention of obesity is critical for averting associated morbidity, disability, and mortality. Ethiopia has been using the international (WHO’s) BMI cut-off for diagnosing obesity even though its validity among Ethiopian population was questioned. To address this problem, a new body mass index cut-off was developed for Ethiopian adults using population-specific data. However, its performance in diagnosing obesity has not been validated. Therefore, this study determined the performance of the newly developed Ethiopian and World Health Organization (WHO) BMI cut-offs in detecting obesity among Ethiopian adults.
Methods:A cross-sectional study was carried out among 704 employees of Jimma University from February to April 2015. The study participants were selected using simple random sampling technique based on their payroll. Data on sociodemographic variables were collected using an interviewer-administered structured questionnaire.
Anthropometric parameters including body weight and height were measured according to WHO recommendation. Body fat percentage (BF%) was measured using the air displacement plethysmography (ADP) after calibration of the machine. The diagnostic accuracy of the WHO BMI cut-off (≥30 kg/m2) for obesity in both sexes and Ethiopian BMI cut-off (> 22.2 kg/m2for males and > 24.5 kg/m2for females) were compared to obesity diagnosed using ADP measured body fat percentage (> 35% for females and > 25% for males). Sensitivity, specificity, predictive values, and kappa agreements were determined to validate the performance of the BMI cut-offs.
Results:In males, WHO BMI cut-off has a sensitivity of 5.3% and specificity of 99.4% (Kappa = 0.047) indicating a slight agreement. However, the Ethiopian cut-off showed a sensitivity of 87.5% and specificity of 87.7% (Kappa = 0.752) indicating a substantial agreement.
Similarly, in females, the WHO BMI cut-off showed a sensitivity of 46.9%, while its specificity was 100% (Kappa = 0.219) showing a fair agreement. The Ethiopian BMI cut-off demonstrated a sensitivity 80.0% and a specificity 95.6% (Kappa = 0.701) showing a substantial agreement. The WHO BMI cut-off underestimated the prevalence of obesity by a maximum of 73.7% and by a minimum of 28.3% among males, while the values for underestimation ranged from 31.4–54.1% in females. The misclassification was minimal using the newly developed Ethiopian BMI cut-off. The prevalence of obesity was underestimated by a maximum of 9.2% and overestimated by a maximum of 6.2%. The WHO BMI cut-off failed to identify nearly half (46.6%) of Ethiopian adults who met the criteria for obesity using BF% in the overall sample.
(Continued on next page)
© The Author(s). 2019Open AccessThis article is distributed under the terms of the Creative Commons Attribution 4.0 International License (http://creativecommons.org/licenses/by/4.0/), which permits unrestricted use, distribution, and reproduction in any medium, provided you give appropriate credit to the original author(s) and the source, provide a link to the Creative Commons license, and indicate if changes were made. The Creative Commons Public Domain Dedication waiver (http://creativecommons.org/publicdomain/zero/1.0/) applies to the data made available in this article, unless otherwise stated.
* Correspondence:makedasinaga@gmail.com
1Department of Nutrition and Dietetics, Faculty of Public Health, Jimma University, Po. Box 378, Jimma, Ethiopia
(Continued from previous page)
Conclusions: The findings suggest that WHO BMI cut-off (≥30 kg/m2) is not appropriate for screening obesity among Ethiopian adults. The newly developed Ethiopian BMI cut-off showed a better performance with excellent sensitivity, specificity, predictive values, and agreement indicating the diagnostic significance of it use as a simple, cost-effective, and valid indicator in clinical and community setups.
Keywords: Validity, Body mass index, Cut-off, Obesity, Ethiopia,
Introduction
Obesity is associated with increased risk numerous co-morbid conditions such as type 2 diabetes melitus, systemic hypertension, dyslipidemia, obstructive sleep apnea, osteoarthritis, depression, gout, nonalcoholic liver disease, reproductive-endocrine disorders and several cancers [1–5]. The prevalence of obesity is rapidly increasing in the world exacting a heavy loss both socially and economically [6–8].
As a result of an epidemiological transition related to in-creased urbanization, westernization, and globalization, many sub-Saharan African countries are experiencing life-style and behavioral changes such as unhealthy diet, phys-ical inactivity, and increased tobacco and alcohol use leading to an increasing prevalence of obesity [9–14]. Consequently, evidence suggests that there has been an increasing prevalence of metabolic syndrome (MetS) among populations in sub-Saharan African countries in-cluding Ethiopia over the past decades [15–18]. Body weight guidelines are useful for practitioners to screen pa-tients for excessive adiposity and prescribe treatment for patients with overweight [19]. World Health Organization (WHO) recommends body mass index (BMI) ≥30 kg/m2 to be used as a simple indicator of obesity in adults [20] in all countries that do not have locally appropriate cut-off.
However, the definition of obesity based on this cut-off has been challenged due to variations in the rela-tionships between the body fat percentage and BMI in different populations [21–23]. Accurate determination of obesity has become exceedingly important because of major health threats posed by excess adiposity, which could lead to misleading conclusions about obesity and associated health status [21–23].
A meta-analysis of different studies revealed that the above BMI cut-off failed to identify half of the people with excess body fat percentage [24, 25]. This has an effect on the validity of BMI for screening the risk of type 2 diabetes and cardiovascular disease [26]. Another meta-analysis of studies on the relationship between body fat percentage measured and estimated based on BMI from Caucasian equation in different ethnic groups showed that BMI underestimates body fat percentage among Ethiopians [27]. Studies based on data generated from few Ethiopians with limited
ethnic representation indicated that the international (WHO’s) BMI cut-off is inappropriate for Ethiopians [27–29].
Although there are several advanced obesity (body fat percentage) measurement techniques including air dis-placement plethysmography (ADP), bioelectrical imped-ance analyses (BIA), dual-energy X-ray absorptiometry (DEXA), hydrostatic weighing, and other multicompart-ment models, they are too expensive and not available for routine service level use in developing countries including Ethiopia. To overcome this problem, a new BMI cut-off was developed for Ethiopians based locally appropriated data using large ethnically representative sample [30]. However, the performance of this new cut-off in diagnos-ing obesity was not assessed. The use of the cut-off by ser-vice providers, researchers, and policy makers requires an evidence on its validity. In this study, we compared obesity measured using the newly developed Ethiopian BMI cut-off [30] and WHO's BMI cut-off [20,31,32] with obesity determined based on the body fat percentage measured using ADP (gold standard) [33].
Methods and materials Study setting and participants
The study was conducted from February to March 2015 in Jimma University, which is a public institution situ-ated 357 km southwest of Addis Ababa. The university has two institutes and six colleges housing a total of 1341 academic and 5444 administrative staff. All admin-istrative and academic staff of Jimma University who were actively working and not away for more than one week during the recruitment period were included in the study. Those who had a physical disability including de-formity (kyphosis or scoliosis), limb dede-formity prevent-ing them from standprevent-ing erect, pregnant women, and those who were seriously ill were excluded from the study.
participants were selected from each stratum randomly using proportional to size (PPS) allocation method.
Measurements
Data were collected by five trained clinical nurses who were recruited based on their qualification and prior ex-perience in data collection. A 5-day training was given to data collectors before the actual survey. Supervisors made a close follow-up of measurements and interviews during the field work.
Height and weight were measured according to the WHO STEPS procedure [34]. A stadiometer (Seca Germany) was used to measure the height of the study participants to the nearest 0.1 cm with the subjects posi-tioned at the Frankfurt Plane and the four points (heel, calf, buttocks, and shoulder) touching the vertical stand of the stadiometer and their shoes taken off. Before starting the measurements, the stadiometer was checked using a calibration rod. An electric-powered digital scale (Seca Germany) was used to measure the weight to the nearest 0.1 kg with the subjects wearing light clothes and shoes taken off. An object of a known weight was used to check the validity of the scale every morning. All an-thropometric measurements were done in triplicate, and the average value was used for further analyses.
Body fat percentage was measured using air displace-ment plethysmography (ADP) following recommended procedures [25, 35–38]. The air displacement plethys-mography was calibrated for weight and volume using an adult cylinder of known volume and weight. The pro-cedure for measurement of the body fat percentage was thoroughly explained to the study participants. Subjects wore a similar pant and took off all other clothes, and those with long hair wore swimmer’s cape. Strict in-struction was given to the study participants to come without eating or drinking within 2 h for body fat per-centage measurement. Body fat measures were obtained as a printout or digitally within 2 min. Quality-control measures were also performed before anthropometric measurements. Standardization of procedures, training of data collectors, and validation and calibration of equipment were performed before beginning the data collection.
To validate the BMI cut-off, the obesity (adiposity) determined using Ethiopian BMI cut-off > 22.2 kg/m2(for males) and > 24.5 kg/m2(for females) [30] and WHO BMI
≥30 kg/m2 cut-off [39] were compared with obesity de-fined by body fat percentage measured using air displace-ment plethysmography (ADP) [35–38]. Accordingly, obesity was defined as body fat percentage (BF %) > 25% for males and > 35% for females [20, 31, 40, 41]. Kappa was calculated as a measure of agreement for binary vari-ables. Measures of validity including sensitivity, specificity, positive, and negative predictive values were computed as
measures of validity. Body mass index was computed as the ratio of weight in kilograms to height in meter squared.
Definition of terms
In this study, obesity was defined using different mea-sures as follows:
BM≥30 kg/m2according to WHO cut-off) [20,31,32]. BMI > 22.2 kg/m2for males and > 24.5 kg/m2for
females according to the new Ethiopian cut-off [30]. ADP measured body fat percentage > 25% in males
and > 35% in females [33].
Data processing and analysis
Data were entered into Epidata version 3.1 and exported to SPSS for windows version 20.0 for clean-ing and analyses. The data were checked for normality of continuous variables using QQ-plot. Descriptive analysis was used to describe the study subjects and presented using tables and figures. Validity measures including sensitivity, specificity, and positive and nega-tive predicnega-tive values were determined for Ethiopian cut-off and for the WHO cut-off. In addition, agree-ment between the Ethiopian cut-off and the WHO cut-off with the gold standard (obesity measured using ADP-generated body fat percentage) were determined using Kappa statistics.
Results
Background and characteristics
Out of the 704 study participants, more than half (56.4%) were females, and larger proportion (38.2%) was in the age group between 20 and 30 and followed by those in the age group of 31–40 years. The mean age (± sd) was 34.7 (± 9.5) and 36.5 (± 9.2) years for males and females, respectively.
Regarding ethnicity, larger proportion of the study participants was Oromo (36.2%) followed by Amhara (30.3). The mean (± sd) weight was 67.0 (± 11.7) and 62.3 (± 12.9) kg for males and females, respectively, while the average (± SD) height was 171.8 (± 13.4) and 157.1 (± 8.5) cm for males and females, respectively. The mean BMI was higher for females (25.3 kg/m2) compared to males (22.5 kg/m2). Likewise, the mea-sured body fat percentage (mean ± SD) was higher for females (38.5%) compared to males (23.9%) (Table1).
Performance of newly developed Ethiopian and WHO BMI cut-offs in diagnosing obesity
maximum of 73.7% among males in the age group greater than 40 years and by a minimum of 28.3% among males in the age group of 20–30 years. However, the dif-ference was minimal using the newly developed Ethiop-ian BMI cut-off. The prevalence of obesity was underestimated by a maximum of 9.2% in the age group greater than 40 years and overestimated by a maximum of 6.2% among those in the age group of 20–30 years (Table2).
In female Ethiopian adults, WHO BMI cut-off (≥30 kg/m2) significantly (P< 0.0001) underestimated obesity in all age groups and ethnicities, with little variation be-tween the different groups. Analyses of obesity preva-lence by age category showed that BMI cut-off underestimates obesity by a maximum of 54.1% among
age group > 40 years and by a minimum of 31.4% among those in the age group 20–30 years.
However, the difference in the prevalence of obesity determined based on the body fat percentage and the new Ethiopian cut-off was small. The Ethiopian BMI cut-off underestimated obesity prevalence by a max-imum of 12.0% among those in the age group 20–30 years and by a minimum of (10.3%) in the age groups 31–40 years (Table3).
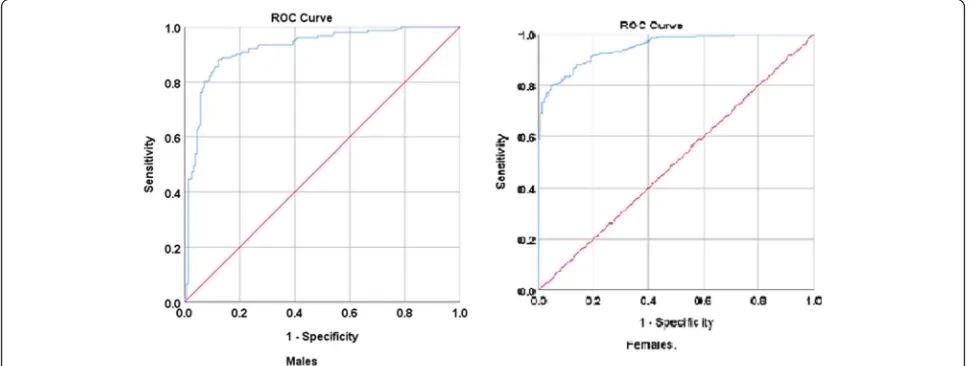
Among males, it was also observed that the WHO cut-off (BMI≥30 kg/m2) has a sensitivity of 5.3% and specificity of 99.4% (Kappa = 0.047) indicating a slight agreement. However, the Ethiopian cut-off (BMI > 22.2 kg/m2) showed a sensitivity of 87.5% and a specificity of 87.7% (Kappa = 0.752) indicating substantial agreement. Similarly, among females, the WHO cut-off (BMI≥30 kg/m2). showed a sensitivity of 46.9%, while its specificity was 100%, (Kappa = 0.219) show-ing a fair agreement. However, the Ethiopian cut-off (BMI > 24.5 kg/m2) showed a sensitivity of 80.0% and a specificity of 95.6% (Kappa = 0.701) showing a substantial agreement (Table4and Fig.1).
As depicted in Fig. 2, the relationship between the body fat percentage measured by ADP and BMI of Ethiopian adults is not linear. The higher the body fat percentage did not linearly translate into higher BMI values, especially for people with high body fat percentage.
Discussion
The findings showed that the WHO BMI cut-off signifi-cantly misclassifies obesity among Ethiopian adults, re-gardless of age, sex, and ethnicity resulting in a significant underestimation. There was a poor to fair agreement [42] between the obesity measured using the body fat percent-age and that determined using WHO BMI cut-off [32]. A similar underestimation of obesity by the international cut-off was reported among Asians [43], Syrians [44], Turkish population [45], and Chinese [46].
The fact that the relationship between the body fat per-centage and BMI varies among different ethnic groups and the need for developing population-specific BMI cut-offs for obesity was recommended [27]. This disparity in detecting obesity between the BMI and measured body fat percentage could be attributed to the differences in body frames between the Ethiopians and the Caucasians on which the WHO BMI cut-off is based [32]. Ethiopians have slender body frame and more visceral fat for the same body mass index as compared to Caucasian and other Blacks [27]. Ethiopians have a higher body fat per-centage compared to Caucasians [27] similar to Indians [47]. This makes the use of WHO BMI cut-off for the screening purposes unreliable and invalid for Ethiopian adults. According to the consensus of the International Diabetic Federation (IDF), developing countries should
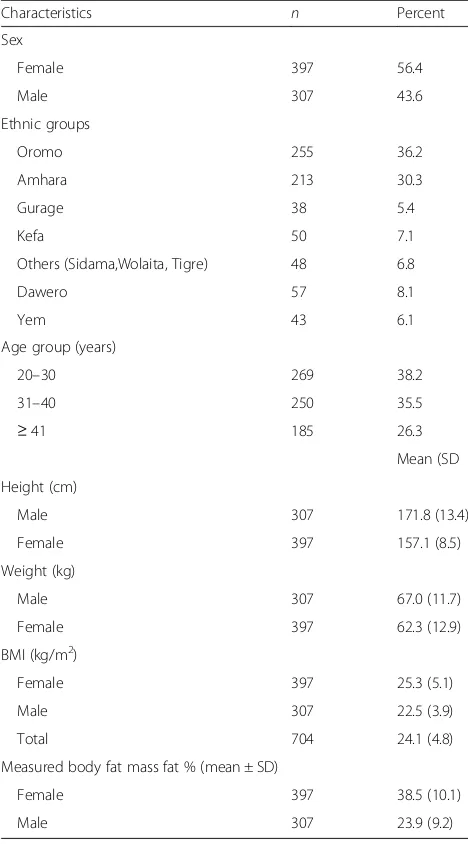
Table 1Background and anthropometric characteristics of the study participants (n= 704)
Characteristics n Percent
Sex
Female 397 56.4
Male 307 43.6
Ethnic groups
Oromo 255 36.2
Amhara 213 30.3
Gurage 38 5.4
Kefa 50 7.1
Others (Sidama,Wolaita, Tigre) 48 6.8
Dawero 57 8.1
Yem 43 6.1
Age group (years)
20–30 269 38.2
31–40 250 35.5
≥41 185 26.3
Mean (SD
Height (cm)
Male 307 171.8 (13.4)
Female 397 157.1 (8.5)
Weight (kg)
Male 307 67.0 (11.7)
Female 397 62.3 (12.9)
BMI (kg/m2)
Female 397 25.3 (5.1)
Male 307 22.5 (3.9)
Total 704 24.1 (4.8)
Measured body fat mass fat % (mean ± SD)
Female 397 38.5 (10.1)
Male 307 23.9 (9.2)
Table 2Agreement of obesity prevalence measured by Ethiopian and WHO BMI cut-offs with obesity based on ADP measured body fat percentage among Ethiopian adult males
Variables n Prevalence of obesity
(a) Obesity based on ADP measured body fat > 25% for males (%)
(b) Obesity based on BMI≥30 kg/m2 (%)
Difference (a–b) (%)
Kappa (c) Obesity based on Ethiopian BMI cut-off males > 22.2 kg/m2 (%)
Difference (a–c) (%)
Kappa
Age group
20–30 145 29.7 1.4 28.30 0.019 35.9 −6.20 0.642
31–40 86 59.3 5.8 53.50 0.081 57.0 2.30 0.809
≥41 76 76.3 2.6 73.70 0.017 67.1 9.20 0.775
Total 307 49.5 2.9 46.60 0.047 49.5 0.00 0.752
Ethnicity
Oromo 149 38.3 2.0 36.30 0.064 43.0 −4.70 0.792
Amhara
73 64.4 5.5 58.90 0.019 63.0 1.40 0.674
Gurage 16 81.2 6.2 75.00 0.030 56.2 25.00 0.458
Kefa 12 58.3 0.0 58.30 0.000 58.3 0.00 1.000
Others 28 57.1 3.6 53.50 0.054 57.1 0.00 0.708
Dawro 17 52.9 0.0 52.90 0.000 35.3 17.60 0.653
Yem 12 25.0 0.0 25.00 0.000 33.3 −8.30 0.800
Total 307 49.5 2.9 46.60 0.047 49.5 0.0 0.752
Kappa agreement (0 = no/poor), (0.01–0.20 = slight), (0.21–0.40 = fair), (0.41–0.60 = moderate), (0.61–0.80 = substantial), and (0.81–1.00 = almost perfect) (William et al., 2011). BMI cut-off for obesity≥30 kg/m2
is the WHO cut-off [20]
ADPair displacement plethysmography
Table 3Agreement of obesity prevalence measured by Ethiopian and WHO BMI cut-offs with obesity based on ADP measured body fat percentage among Ethiopian adult females
Variables Prevalence of obesity
n (a) Obesity based on ADP measured body fat > 35% for females (%)
(b) Obesity based on BMI≥30 kg/ m2(%)
Difference in obesity (a–b) (%)
Kappa (c) Obesity based on Ethiopian BMI cut-off for females > 24.5 kg/m2(%)
Difference in obesity (a–c) (%)
Kappa
Age group
20–30 124 39.5 8.1 31.40 0.237 27.4 12.10 0.697
31–40 164 76.8 23.8 53.00 0.172 66.5 10.30 0.630
≥41 109 78.0 23.9 54.10 0.163 65.1 12.90 0.647
Total 397 65.5 18.9 46.60 0.219 53.9 11.60 0.701
Ethnicity 9.50
Oromo 106 64.2 20.8 43.40 0.255 54.7 12.20 0.729
Amhara
140 77.9 27.9 50.00 0.198 65.7 13.70 0.636
Gurage 22 77.3 9.1 68.20 0.057 63.6 15.80 0.680
Kefa 38 60.5 10.5 50.00 0.143 44.7 15.00 0.691
Others 20 45.0 15.0 30.00 0.355 30.0 7.50 0.688
Dawro 40 52.5 5.0 47.50 0.091 45.0 12.90 0.652
Yem 31 41.9 9.7 32.20 0.258 29.0 11.6 0.723
Total 397 65.5 18.9 46.60 0.219 53.9 0.701
Kappa agreement (0 = no/poor), (0.01–0.20 = slight), (0.21–0.40 = fair), (0.41–0.60 = moderate), (0.61–0.80 = substantial), and (0.81–1.00 = almost perfect) (William et al., 2011). BMI cut-off for obesity≥30 kg/m2
is the WHO cut-off [20]
use European cut-off until they develop their cut-off based on locally relevant data [48,49].
Conversely, there was a substantial agreement [42] between the obesity estimated based on the newly de-veloped Ethiopian BMI cut-off [30] and the one deter-mined based on the body fat percentage measured using ADP for all age and Ethnic groups of both sexes (Kappa = 0.75 for males and 0.70 for females). This agreement in all ethnic and age groups of both sexes indicates validity of the new cut-off in detecting obes-ity among Ethiopian adults. Similarly, many Asian countries [47, 50–52] had developed their own BMI cut-off for obesity based on population-specific data.
It was also observed that body fat percentage deter-mined by ADP and BMI do not have linear relationship, among people with high body fat percentage (obese). Our data showed that as body fat increased, the relation-ship tends to be nonlinear. Their relationrelation-ship is better described by a curvilinear pattern, which could explain the reason why there is a significant misclassification of obesity determined based on the body fat percentage and BMI for obese people in our sample. Such a
nonlinear relationship was also documented by other studies [21,53].
Despite this observation, the newly developed Ethiopian BMI cut-off showed a lower misclassification of obesity and better validity compared to the WHO cut-off. The findings imply that Ethiopian BMI cut-off could be used as simple cost-effective tool for screening and early identifica-tion of obesity with the view to promoting preventive public health actions at the population level. This study indicated that the new cut-off [30] performed very well in terms of its agreement, sensitivity, and specificity compared to the most valid measures of obesity body fat percentage.
The findings of this study have a wider practical impli-cation in the prevention of chronic noncommunicable diseases that are currently causing a large burden of morbidity and mortality in Ethiopia [54]. Especially, as Ethiopia is growing economically and there is a rapid in-crease in urbanization, out of home eating, and calorie consumption [55], having such a simple, cheap, and valid tool for screening obesity enhances the efforts for pre-vention of obesity and related noncommunicable dis-eases. The results call for developing guidelines for
Table 4Validity of BMI cut-off for detecting obesity among Ethiopian adults as compared to obesity based on the body fat percentage determined by the air displacement plethysmography (ADP)
Sex Cut-off values TP (a) FP (b) FN (c) TN (d) Total Sensitivity (%) Specificity (%) PPV (%) NPV (%) Kappa Agreement P
Males BMI≥30 kg/m2 8 1 144 154 307 5.3 99.4 88.9 51.7 0.047 Slight 0.0160
BMI > 22.2 kg/m2a 133 19 19 136 307 87.5 87.7 87.5 87.7 0.752 Substantial < 0.0001
Females BMI≥30 kg/m2 75 0 185 137 397 46.9 100.0 100.0 42.5 0.219 Fair < 0.0001
BMI > 24.5 kg/m2a 208 6 52 131 397 80.0 95.6 97.2 71.6 0.701 Substantial < 0.0001
Sensitivity =a/a+c, specificity =d/b+d, positive predictive value (PPV) =a/a+b, negative predictive value (NPV) =d/c+d. Kappa agreement (0 = no/poor), (0.01– 0.20 = slight), (0.21–0.40 = fair), (0.41–0.60 = moderate), (0.61–0.80 = substantial), and (0.81–1.00 = almost perfect) (William et al., 2011). ADP measured body fat percentage > 25 for males and > 35 for females was used as a gold standard [20]. BMI cut-off for obesity≥30 kg/m2
is the WHO cut-off [20]
ADPair displacement plethysmography
a
Ethiopian sex-specific cut-off for BMI for defining obesity based on the local data
Fig. 1Receiver operating characteristic curve showing the diagnostic performance of BMI cut-off as compared to the body fat percentage
screening and surveillance of obesity both at the com-munity and health facility level based on the newly de-veloped Ethiopian cut-off.
The fact that the study used body fat measured by ADP, which is reported to be very accurate [35,37] can be consid-ered as strength. In addition, the study indicated the fact that the international cut-off is not appropriate for Ethiopian adults, while the locally developed Ethiopian cut-off is an ap-propriate alternative to be used in Ethiopia. This finding is a very critical input for researchers and service providers and educators as this study is the first of its kind.
In this study, however, we acknowledge the following limitations. Although different major ethnicities were represented in the sample, it was not possible to get an adequate sample for some ethnicities. To overcome this, samples were drawn from the university, which gave an opportunity to include most of the ethnic groups. It is felt that, given these limitations, the validation done in this study could reflect the performance of both the WHO and locally generated cut-offs for Ethiopia.
Conclusion
The study demonstrated that the Ethiopian cut-off has higher sensitivity, specificity, and predictive values and could be used as a simple cost-effective valid tool to
detect obesity among Ethiopian adults. Conversely, the WHO BMI cut-off is not appropriate for screening obes-ity among Ethiopian adults. The findings suggest the need for using the new Ethiopian MBI cut-off for the screening of obesity among Ethiopian adults in galvaniz-ing public health interventions to prevent obesity and as-sociated morbidity and mortality in Ethiopia.
Abbreviations
ADP:Air displacement plethysmography; BF%: Body fat percentage; BMI: Body mass index
Acknowledgements
The authors express their appreciation to the study participants and Jimma University Institute of Health for funding the study.
Authors’contributions
MS and TB conceived and planned the study. MS, TY, TB, and ET implemented the study. MS and TB did the analyses. MS drafted the manuscript. TY, TB, ET, and DL critically reviewed the manuscript. All authors gave input to the manuscript and read and approved the final version.
Funding
The study was funded by the Jimma University, Institute of Health. The institute did not have a role in the design of the study and collection, analysis and interpretation of data, or in writing the manuscript.
Availability of data and materials
The data used and/or analyzed during the current study are available from the corresponding author on a reasonable request.
Ethics approval and consent to participate
Before data collection, ethical clearance and approval was obtained from the institutional review board of Jimma University. Informed written consent was obtained from each participant before data collection. The study participants were assured that the information they gave will not be disclosed to a third person, and personal identifiers including names were not recorded on the questionnaires. Individual identification numbers were used to notify their results. The study participants were assured that they are free to withdraw their consent and discontinue participation without any form of prejudice. Privacy and confidentiality of the collected data were ensured throughout the study. Study participants with obesity were advised to modify their lifestyles during the collection of the body fat percentage results.
Consent for publication
This is not applicable as the study does not have individual person’s data.
Competing interests
The authors declare that they have no competing interests.
Author details
1Department of Nutrition and Dietetics, Faculty of Public Health, Jimma University, Po. Box 378, Jimma, Ethiopia.2Faculty of Health Sciences, Department of Laboratory Sciences, Jimma University, Jimma, Ethiopia. 3Department of Internal Medicine, Faculty of Medicine, Jimma University, Jimma, Ethiopia.4Population Studies Centre, Brown University, Providence, USA.
Received: 29 January 2019 Accepted: 4 September 2019
References
1. Villareal DT, Apovian CM, Kushner RF, Klein S. American Society for Nutrition; NAASO, the Obesity Society. Obesity in older adults: technical review and position statement of the American Society for Nutrition and NAASO, the Obesity Society. Obes Res. 2005;13(11):1849–63.
2. Ziraba AK, Fotso JC, Ochako R. Overweight and obesity in urban Africa: a problem of the rich or the poor? BMC Public Health. 2009;9:465.https://doi. org/10.1186/1471-2458-9-465.
3. Pi-Sunyer X. The medical risks of obesity. Postgrad Med. 2009;121(6):21–33. https://doi.org/10.3810/pgm.2009.11.2074.
4. Ndumele CE, Matsushita K, Lazo M, et al. Obesity and subtypes of incident cardiovascular disease. J Am Heart Assoc. 2016;5:e003921.https://doi.org/10. 1161/JAHA.116.003921.
5. Kyrou I, Randeva HS, Tsigos C, Kaltsas G, Weickert MO. Clinical problems caused by obesity, 2000–2018 Jan 11.https://www.ncbi.nlm.nih.gov/books/ NBK278973/. Accessed 24 Dec 2018.
6. Ruopeng A. Prevalence and trends of adult obesity in the US, 1999–2012. Volume. 2014;2014:6http://www.hindawi.com/journals/isrn/2014/185132/. 7. Bhurosy T, Jeewon R. Overweight and obesity epidemic in developing
countries: a problem with diet, physical activity, or socioeconomic status? Sci World J. 2014;2014:964236.https://doi.org/10.1155/2014/964236Epub 2014 Oct 14.
8. Hruby A, Hu FB. The epidemiology of obesity: a big picture. Pharmacoeconomics. 2015;33(7):673–89.https://doi.org/10.1007/ s40273-014-0243-x.
9. BeLue R, Okoror TA, Iwelunmor J, Taylor KD, Degboe AN, Agyemang C, Ogedegbe G. An overview of cardiovascular risk factor burden in sub-Saharan African countries: a socio-cultural perspective. Glob Health. 2009;5:10.https://doi.org/10.1186/1744-8603-5-10. 10. Maiyaki MB, Garbati MA. The burden of non-communicable diseases in
Nigeria; in the context of globalization. Ann Afr Med. 2014;13(1):1–10. https://doi.org/10.4103/1596-3519.126933.
11. Atiim GA, Elliott SJ. The global epidemiologic transition: noncommunicable diseases and emerging health risk of allergic disease in sub-Saharan Africa. Health Educ Behav. 2016;43(1 Suppl):37S–55S.https://doi.org/10.1177/ 1090198115606918.
12. El-Sayed EF, Awadalla H, Noor SK, Elmadhoun WM, Sulaiman AA, Almobarak AO, Ahmed MH. Sugar intake in Sudanese individuals was associated with some features of the metabolic syndrome: population based study. Diabetes Metab Syndr. 2018;12(3):245–50.https://doi.org/10.1016/j.dsx.2017. 09.001Epub 2017 Oct 13.
13. Biadgilign S, Mgutshini T, Haile D, Gebremichael B, Moges Y, Tilahun K. Epidemiology of obesity and overweight in sub-Saharan Africa: a protocol for a systematic review and meta-analysis. BMJ Open. 2017;7(11):e017666. https://doi.org/10.1136/bmjopen-2017-017666.
14. Sekgala MD, Mchiza ZJ, Parker WA, Monyeki KD. Dietary fiber intake and metabolic syndrome risk factors among young south african adults, Nutrients. 2018;10(4).https://doi.org/10.3390/nu10040504.
15. Tran A, Gelaye B, Girma B, Lemma S, Berhane Y, Bekele T, Khali A, Williams MA. Prevalence of metabolic syndrome among working adults in Ethiopia. Int J Hypertens. 2011;2011:193719.https://doi.org/10.4061/2011/193719Epub 2011 May 26. 16. Oguoma VM, Nwose EU, Richards RS. Prevalence of cardio-metabolic
syndrome in Nigeria: a systematic review. Public Health. 2015;129(5):413–23. https://doi.org/10.1016/j.puhe.2015.01.017Epub 2015 Feb 2.
17. Nansseu JR, Noubiap JJ, Mengnjo MK, Aminde LN, Essouma M, Jingi AM, Bigna JJ. The highly neglected burden of resistant hypertension in Africa: a systematic review and meta-analysis. BMJ Open. 2016;6(9):e011452.https:// doi.org/10.1136/bmjopen-2016-011452.
18. Birarra MK, Gelayee DA. Metabolic syndrome among type 2 diabetic patients in Ethiopia: a cross-sectional study. BMC Cardiovasc Disord. 2018; 18(1):149.https://doi.org/10.1186/s12872-018-0880-7.
19. Gallagher D, Heymsfield SB, Heo M, Jebb SA, Murgatroyd PR, Sakamoto Y. Healthy percentage body fat ranges: an approach for developing guidelines based on body mass index. Am J Clin Nutr. 2000;72:694–701.
20. World Health Organization (WHO). Physical status: the use and
interpretation of anthropometry: report of a WHO expert committee. Organ Tech Rep Ser. 1995;854:1–452. Available from:http://apps.who.int/iris/ bitstream/handle/ 10665/37003/WHO_TRS_854.pdf;jsessionid=4FD25 FF9D0CCD829A9A412F3A6 FBACB5?sequence=1. Accessed 26 Dec 2017. 21. Ranasinghe C, Gamage P, Katulanda P, Andraweera N, Thilakarathne S,
Tharanga P. Relationship between body mass index (BMI) and body fat percentage, estimated by bioelectrical impedance, in a group of Sri Lankan adults: a cross sectional study. BMC Public Health. 2013;13:797.https://doi. org/10.1186/1471-2458-13-797.
22. Carpenter CL, Yan E, Chen S, Hong K, Arechiga A, Kim WS, Deng M, Li Z, Heber D. Body fat and body-mass index among a multiethnic sample of college-age men and women. J Obes. 2013;2013:790654.https://doi.org/10. 1155/2013/790654Epub 2013 Apr 8.
23. Ho-Pham LT, Lai TQ, Nguyen MT, Nguyen TV. Relationship between body mass index and percent body fat in Vietnamese: implications for the diagnosis of obesity. PLoS One. 2015;10(5):e0127198.https://doi.org/10. 1371/journal.pone.0127198eCollection 2015.
24. Zeng Q, Dong SY, Sun XN, Xie J, Cui Y. Percent body fat is a better predictor of cardiovascular risk factors than body mass index. Braz J Med Biol Res. 2012;45(7):591–600 Epub 2012 Apr 19.
25. Nuttall FQ. Body mass index: obesity, BMI, and health: a critical review. Nutr Today. 2015;50(3):117–28 Epub 2015 Apr 7.
26. Kalra S, Mercuri M, Anand SS. Measures of body fat in South Asian adults. Nutr Diabetes. 2013;3:e69.https://doi.org/10.1038/nutd.2013.10. 27. Deurenberg P, Yap M, van Staveren WA. Ethnic differences in BMI and
fatness. Int J Obes. 1998;22:1164–71.
28. Deurenberg P, Yap DM, Wang J, Lin FP, Schmidt G. The impact of body build on the relationship between body mass index and percent body fat. Int J Obes. 1999;23:53–542.
29. Deurenberg-Yap M, Schmidt G, van Staveren WA, Deurenberg P. The paradox of low body mass index and high body fat percentage among Chinese, Malays and Indians in Singapore. Int J Obes. 2000;24:1011–7. 30. Sinaga M, Worku M, Yemane T, Tegene E, Wakayo T, Girma T,
Lindstrom D, Belachew T. Optimal cut-off for obesity and markers of metabolic syndrome for Ethiopian adults. Nutr J. 2018;17(1):109. https://doi.org/10.1186/s12937-018-0416-0.
31. Ho-Pham LT, Campbell LV, Nguyen TV. More on body fat cutoff points. Mayo Clin Proc, 2011;86(6):584–585.https://www.ncbi.nlm.nih.gov/pmc/articles/ PMC3104919/pdf/mayoclinproc_86_6_014.pdf. Accessed 22 Dec 2018. 32. WHO. Obesity preventing and managing the global epidemic, report of a
WHO consultation on obesity. Geneva: WHO; 1997.
33. Lee SY, Gallagher D. Assessment methods in human body composition. Curr Opin Clin Nutr Metab Care. 2008;11(5):566–72.https://doi.org/10.1097/ MCO.0b013e32830b5f23.).
35. Fields DA, Goran MI, McCrory MA. Body-composition assessment via air-displacement plethysmography in adults and children: a review. Am J Clin Nutr. 2002;75(3):453–67.
36. Fields DA, Higgins PB, Hunter GR. Assessment of body composition by air-displacement plethysmography: influence of body temperature and moisture. Dyn Med. 2004;3(1):3.
37. Dempster P, Aitkens S. A new air displacement method for the determination of human body composition. Med Sci Sports Exerc. 1995;27(12):1692–7. 38. Dewit O, Fuller NJ, Fewtrell MS, Elia M, Wells JC. Whole body air
displacement plethysmography compared with hydrodensitometry for body composition analysis. Arch Dis Child. 2000;82(2):159–64.
39. Jih J, Mukherjea A, Vittinghoff E, et al. Using appropriate body mass index cut points for overweight and obesity among Asian Americans. Prev Med. 2014;65:1–6.https://doi.org/10.1016/j.ypmed.2014.04.010.
40. De L, Deurenberg P, Pietrantuono M, Di Daniele N, Cervelli V, Andreoli A. How fat is obese? Acta Diabetol. 2003;40:S254–7.https:// doi.org/10.1007/s00592-003-0079-x.
41. Li Y, Wang H, Wang K, Wang W, Dong F, Qian Y, Gong H, Xu G, Li G, Pan L, Zhu G, Shan G. Optimal body fat percentage cut-off values for identifying cardiovascular risk factors in Mongolian and Han adults: a population-based cross-sectional study in Inner Mongolia, China. BMJ Open. 2017;7(4): e014675.https://doi.org/10.1136/bmjopen-2016-014675.
42. Viera AJ, Garrett JM. Understanding interobserver agreement: the Kappa statistic. Fam Med. 2005;37(5):360–3.
43. WHO Expert Consultation. Appropriate body-mass index for Asian populations and its implications for policy and intervention strategies. Lancet. 2004;363(9403):157–63.
44. Bakir MA, Al-Bachir MM, Hammad KB, Habil KM, Ahmad HH. The accuracy of currently used WHO’s body mass index cut-off points to measure overweight and obesity in Syrian women: a correlation study. Epidemiol Biostat Public Health. 2016;13(3):e11852 1–9.
45. Bozkirli E, Ertorer ME, Bakiner O, Tutuncu NB, Demirag NG. The validity of the World Health Organisation’s obesity body mass index criteria in a Turkish population: a hospital-based study. Asia Pac J Clin Nutr. 2007;16(3):443–7. 46. Tuan NT, Adair LS, He K, Popki BM. Optimal cutoff values for overweight: using
body mass index to predict incidence of hypertension in 18- to 65-year-old Chinese adults. J Nutr. 2008;138:1377–82.
47. Zaher ZM, Zambari R, Pheng CS, Muruga V, Ng B, Appannah G, Onn LT. Optimal cut-off levels to define obesity: body mass index and waist circumference, and their relationship to cardiovascular disease, dyslipidaemia, hypertension and diabetes in Malaysia. Asia Pac J Clin Nutr. 2009;18(2):209–16.
48. International Diabetes Federation. The IDF consensus worldwide definition of the metabolic syndrome, 2006. Available from:https://www.idf.org/e -library/consensus-statements/60-idfconsensus-worldwide-definitionof-the -metabolic-syndrome.html. Accessed 26 Dec 2018.
49. Parikh RM, Mohan V. Changing definitions of metabolic syndrome. Indian J Endocrinol Metab. 2012;16(1):7–12.https://doi.org/10.4103/2230-8210.91175. 50. Lin WY, Lee LT, Chen CY, Lo H, Hsia HH, Liu IL, Lin RS, Shau WY, Huang KC.
Optimal cut-off values for obesity: using simple anthropometric indices to predict cardiovascular risk factors in Taiwan. Int J Obes Relat Metab Disord. 2002;26(9):1232–8.
51. Nguyen TT, Adair LS, He K, Popkin BM. Optimal cutoff values for overweight: using body mass index to predict incidence of hypertension in 18- to 65-year-old Chinese adults. J Nutr. 2008;138(7):1377–82.
52. Kim SH, Choi H, Won CW, Kim B-S. Optimal cutoff points of anthropometric parameters to identify high coronary heart disease risk in Korean adults. J Korean Med Sci. 2016;31:61–6.
53. Meeuwsen S, Horgan GW, Elia M. The relationship between BMI and percent body fat, measured by bioelectrical impedance, in a large adult sample is curvilinear and influenced by age and sex. Clin Nutr. 2010;29:560–6. 54. Misganaw A, Haile Mariam D, Ali A, Araya T. Epidemiology of major
non-communicable diseases in Ethiopia: a systematic review. J Health Popul Nutr. 2014;32(1):1–13.
55. Hassen IW, Dereje M, Minten B, and Hirvonen K. Diet transformation in Africa: the case of Ethiopia. Ethiopia strategy support program. IFPRI and EDRI, 2017.https://doi.org/10.1111/agec.12387. Accessed 26 Dec 2018.
Publisher’s Note