R E S E A R C H A R T I C L E
Open Access
Routine use of microarray-based gene expression
profiling to identify patients with low cytogenetic
risk acute myeloid leukemia: accurate results can
be obtained even with suboptimal samples
Diane Raingeard de la Blétière
1,2†, Odile Blanchet
2,3†, Pascale Cornillet-Lefèbvre
4, Anne Coutolleau
1,
Laurence Baranger
5, Franck Geneviève
3, Isabelle Luquet
4, Mathilde Hunault-Berger
6, Annaelle Beucher
3,
Aline Schmidt-Tanguy
2,6, Marc Zandecki
3, Yves Delneste
2, Norbert Ifrah
2,6and Philippe Guardiola
1,2,6*Abstract
Background:Gene expression profiling has shown its ability to identify with high accuracy low cytogenetic risk acute myeloid leukemia such as acute promyelocytic leukemia and leukemias with t(8;21) or inv(16). The aim of this gene expression profiling study was to evaluate to what extent suboptimal samples with low leukemic blast load (range, 2-59%) and/or poor quality control criteria could also be correctly identified.
Methods:Specific signatures were first defined so that all 71 acute promyelocytic leukemia, leukemia with t(8;21) or inv(16)-AML as well as cytogenetically normal acute myeloid leukemia samples with at least 60% blasts and good quality control criteria were correctly classified (training set). The classifiers were then evaluated for their ability to assign to the expected class 111 samples considered as suboptimal because of a low leukemic blast load (n = 101) and/or poor quality control criteria (n = 10) (test set).
Results:With 10-marker classifiers, all training set samples as well as 97 of the 101 test samples with a low blast load, and all 10 samples with poor quality control criteria were correctly classified. Regarding test set samples, the overall error rate of the class prediction was below 4 percent, even though the leukemic blast load was as low as 2%. Sensitivity, specificity, negative and positive predictive values of the class assignments ranged from 91% to 100%. Of note, for acute promyelocytic leukemia and leukemias with t(8;21) or inv(16), the confidence level of the class assignment was influenced by the leukemic blast load.
Conclusion:Gene expression profiling and a supervised method requiring 10-marker classifiers enable the identification of favorable cytogenetic risk acute myeloid leukemia even when samples contain low leukemic blast loads or display poor quality control criterion.
Background
Prognostic evaluation is a critical step in newly diag-nosed patients with acute myeloid leukemia (AML) in order to identify those at high risk of relapse. For AML patients, cytogenetic abnormalities as well as gene muta-tions and/or hyper-expressions detected at diagnosis are
the main prognostic factors guiding the initial treatment strategy in a risk-oriented manner [1-4]. Hypergranular acute promyelocytic leukemia (APL), as well as AMLs with either translocation t(8;21)(q22;q22) [t(8;21)-AMLs] or inversion inv(16)(p13q22)/t(16;16)(p13;q22) [inv(16)-AMLs], are well-defined entities associated with a favor-able outcome [1,3]. They can be distinguished from all other AML subtypes based on specific chromosomal alterations and fusion genes: PML/RAR-alpha fusion gene with reciprocal translocation t(15;17)(q24;q21) for APLs, AML1/ETO (also called RUNX1/RUNX1T1) * Correspondence: [email protected]
†Contributed equally
1
Plateforme SNP, Transcriptome & Epigénomique, Centre Hospitalier Universitaire, Angers, France
Full list of author information is available at the end of the article
fusion gene for t(8;21)-AMLs, andCBFB/MYH11fusion gene for AMLs with either inv(16)(q21;q22) or balanced reciprocal translocation t(16;16)(q21;q22). Of note, in up to 15 percent of APLs, no translocation t(15;17)(q24; q21) is detected by conventional cytogenetics at diagno-sis, despite PML/RARA fusion gene is detected using molecular assays [5,6]. Similarly, cryptic t(8;21)(q22;q22) and inv(16)(q21;q22), undetected by conventional cyto-genetics, have also been reported [7-9].
With samples containing a high leukemic blast load, microarray-based gene expression profiling (GEP) and class prediction analyses have demonstrated their ability to assign AML samples to one of these three well char-acterized favorable cytogenetic risk AML subtypes, with high accuracy and low error rates [10-18]. One of the largest class prediction analyses in AML achieved 100 percent classification accuracy with respect to APL, t (8;21)-AML, and inv(16)-AML subtypes, indeed [10]. However, in the majority of those studies, the minimum percentage of leukemic cells within each sample is most often above 60 percent [10-18], an arbitrary threshold that is significantly different from the one used by cytol-ogists for the diagnosis of AML, i.e., excess of blasts greater or equal to 20 percent.
To our knowledge, the impact of the leukemic blast load and/or of the sample quality on microarray-derived class prediction results has not been specifically studied in AMLs. For centers wishing to integrate microarray-based GEP in a routine prognostic workflow for newly diagnosed AML patients, one critical issue is the ability to perform accurate class prediction analysis with sub-optimal samples, i.e., containing as low as 20 percent blasts and even below, and/or not fulfilling all quality control criteria along their process.
In this study, GEP was first used to define a limited set of markers allowing to correctly classify 71 patients with either APL, t(8;21)-AML, inv(16)-AML or cytogen-etically normal AML (NK-AML) based on samples con-taining at least 60 percent of leukemic blasts and characterized by good quality control criteria (training set including optimal samples). The classifiers derived from this first supervised analysis were then evaluated for their ability to assign to the correct class 111 subop-timal samples with low leukemic blast load (from 2 to 59 percent) and/or poor quality control criteria (test set including suboptimal samples), as well as duplicates of three AML cell lines.
Methods
Characteristics of the patients and samples
A total of 182 bone marrow or peripheral blood samples from 97 AML patients, diagnosed with either APL (n = 18), t(8;21)-AML (n = 19), inv(16)-AML (n = 29), or NK-AML (n = 31), followed at Angers University
Hospital (n = 72) or Reims University Hospital (n = 25), were analyzed, as well as duplicated samples of NB4, Kasumi-1, and ME-1 cell lines (n = 6 samples), which are derived from patients with APL, t(8;21)-AML and inv(16)-AML, respectively. In addition, 18 samples of unique (n = 9) or pooled (n = 9) normal bone marrows obtained from 12 healthy volunteers were included in the study. The main characteristics of AML patients and samples are summarized in Tables 1 and 2. Conven-tional cytogenetic banding, fluorescencein situ hybridi-zation, and RT-PCR analysis of fusion gene transcripts were used to identify patients with APL, t(8;21)-AML or inv(16)-AML, as previously reported [19]. Analysis of NPM1, FLT3 and CEBPAfor mutations was also per-formed for all patients [20-23]. All participants gave their written informed consent, and the study was approved by the Ethical Committee of Angers University Hospital.
The gene expression dataset, generated from 206 sam-ples (182 AML samsam-ples, duplicated samsam-ples of NB4, Kasumi-1, and ME-1 cell lines, 18 samples of unique or combined normal bone marrows), was divided into a Training Set (n = 89 samples) and a Test Set (n = 117
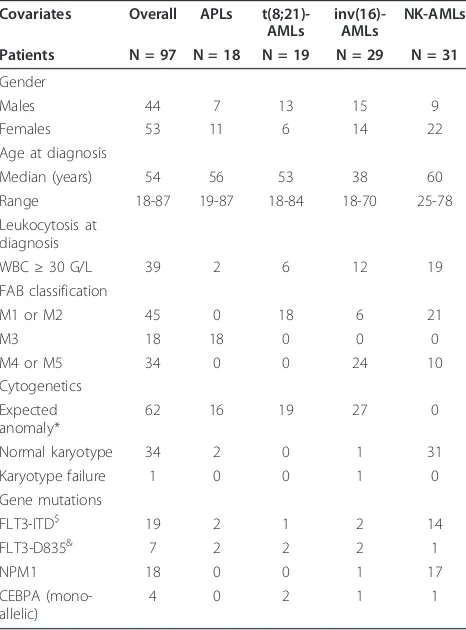
Table 1 Characteristics of the patients.
Covariates Overall APLs t(8;21)-AMLs
inv(16)-AMLs
NK-AMLs
Patients N = 97 N = 18 N = 19 N = 29 N = 31
Gender
Males 44 7 13 15 9
Females 53 11 6 14 22
Age at diagnosis
Median (years) 54 56 53 38 60
Range 18-87 19-87 18-84 18-70 25-78
Leukocytosis at diagnosis
WBC≥30 G/L 39 2 6 12 19
FAB classification
M1 or M2 45 0 18 6 21
M3 18 18 0 0 0
M4 or M5 34 0 0 24 10
Cytogenetics Expected anomaly*
62 16 19 27 0
Normal karyotype 34 2 0 1 31
Karyotype failure 1 0 0 1 0
Gene mutations
FLT3-ITD$ 19 2 1 2 14
FLT3-D835& 7 2 2 2 1
NPM1 18 0 0 1 17
CEBPA (mono-allelic)
4 0 2 1 1
WBC, white blood cells. * t(15;17), t(8;21), inv(16) or t(16;16) for APL, t(8;21)-AML and inv(16)-t(8;21)-AML, respectively detected.$
Internal tandem duplication. &
samples). The Training Set, used to identify specific class markers (classifiers), included 18 samples of unique or pooled normal bone marrows (see details about the pools below) as well as 71 AML samples obtained from patients (bone marrow samples, n = 48; peripheral blood samples, n = 23) newly diagnosed with APL (n = 14 patients), t(8;21)-AML (n = 14 patients), inv(16)-AML (n = 15 patients) or NK-inv(16)-AML (n = 28 patients), which contained at least 60 percent blasts. The class prediction analysis was performed on a Test Set includ-ing 111 suboptimal AML samples (bone marrow sam-ples, n = 78; peripheral blood samsam-ples, n = 33 obtained from 53 patients), i.e., with a low leukemic blast load (n = 101 samples containing from 2 to 56 percent blasts)
and/or poor quality control criteria (n = 10 samples) as well as duplicated samples of NB4, Kasumi-1, and ME-1 cell lines (n = 6 samples). Among test samples with optimal quality control criteria, 22 originally contained less than 60% blasts (range, 5-56 percent blasts), whereas 79 were high blast load ones artificially diluted within one of the five pools of normal bone marrows (see details below and Tables 2 and 3). The 10 samples with suboptimal quality control criteria were character-ized by either a low RNA integrity number suggestive of RNA degradation (n = 2), a low cRNA amount obtained after total RNA amplification and labeling (cRNA hybri-dized on BeadChips < 750 micrograms) (n = 7) or both (n = 1) (Tables 2 and 3).
Sample preparation for gene expression profiling
Blasts and mononuclear cells were purified by Ficoll-Hypaque density gradient centrifugation from bone mar-row or peripheral blood samples (Nygaard, Oslo, Norway). Isolated cell samples were then immediately cryopre-served. Total RNAs were extracted from 107thawed cells using RNEasy®Mini Kits (Qiagen Incorporation, Valencia, USA). Total RNA quantification was performed using the Nanodrop ND-1000 spectrophotometer (Thermo Fisher Scientific Incorporation, Waltham, USA) according to manufacturer recommendations. Integrity of the extracted RNAs was assessed with the Bioanalyzer 2100 and the RNA6000 Nano kit (Agilent Technologies Incorporation, Santa Clara, USA). A RNA integrity number (RIN) greater or equal to 7.00 was achieved for 203 samples (RNA degradation observed for 3 AML samples). No sign of DNA contamination was detected in any of the 206 sam-ples analyzed. The starting amount of total RNA used for the reactions was 200 nanograms per sample, for all sam-ples. The Illumina Total Prep RNA Amplification Kit (Applied Biosystems/Ambion, Austin, USA) was used to generate biotinylated, amplified cRNA according to the manufacturer recommendations (see additional file 1 for details). To study the leukemic blast load effect on the class prediction accuracy, besides including 22 samples with good quality control criteria that originally contained less than 60 percent of leukemic blasts, 79 artificially gen-erated low leukemic blast load samples, via a“dilution/ mixture”approach, were also assessed (see additional file 1 for details for the generation of low leukemic blast load AML samples by a“dilution/mixture”approach). Hybridi-zation on Illumina HumanHT-12 v3 Expression Bead-Chips, staining and detection of cRNAs on microarrays using an I-Scan system were performed according to Illu-mina’s protocol (see additional file 1 for details).
Data analyses
GenomeStudio 2010.3 software (Illumina Inc., San Diego, USA) and its Gene Expression Analysis Module
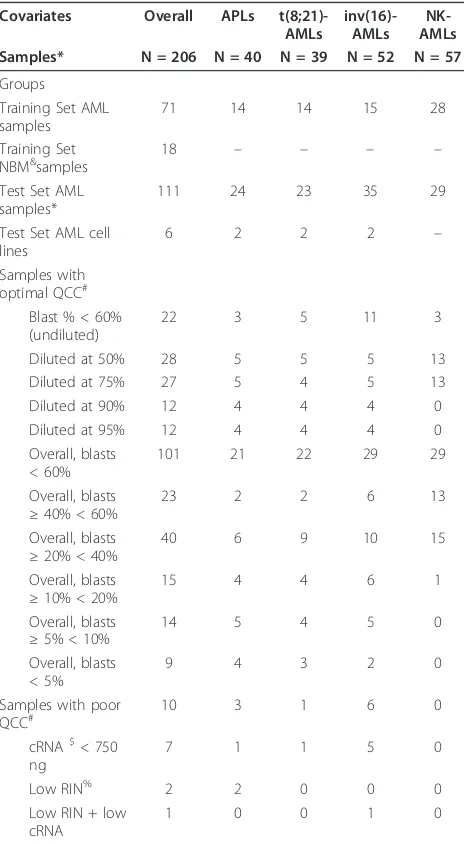
Table 2 Characteristics of the samples.
Covariates Overall APLs t(8;21)-AMLs
inv(16)-AMLs
NK-AMLs Samples* N = 206 N = 40 N = 39 N = 52 N = 57
Groups Training Set AML samples
71 14 14 15 28
Training Set NBM&samples
18 – – – –
Test Set AML samples*
111 24 23 35 29
Test Set AML cell lines
6 2 2 2 –
Samples with optimal QCC#
Blast % < 60% (undiluted)
22 3 5 11 3
Diluted at 50% 28 5 5 5 13
Diluted at 75% 27 5 4 5 13
Diluted at 90% 12 4 4 4 0
Diluted at 95% 12 4 4 4 0
Overall, blasts < 60%
101 21 22 29 29
Overall, blasts ≥40% < 60%
23 2 2 6 13
Overall, blasts ≥20% < 40%
40 6 9 10 15
Overall, blasts ≥10% < 20%
15 4 4 6 1
Overall, blasts ≥5% < 10%
14 5 4 5 0
Overall, blasts < 5%
9 4 3 2 0
Samples with poor
QCC# 10 3 1 6 0
cRNA$< 750
ng
7 1 1 5 0
Low RIN% 2 2 0 0 0
Low RIN + low cRNA
1 0 0 1 0
* including the three AML cell lines.#
quality control criteria.$
labeled cRNA to be hybridized on Illumina Beadchips.
%
RNA integrity number lower than 7.00.&
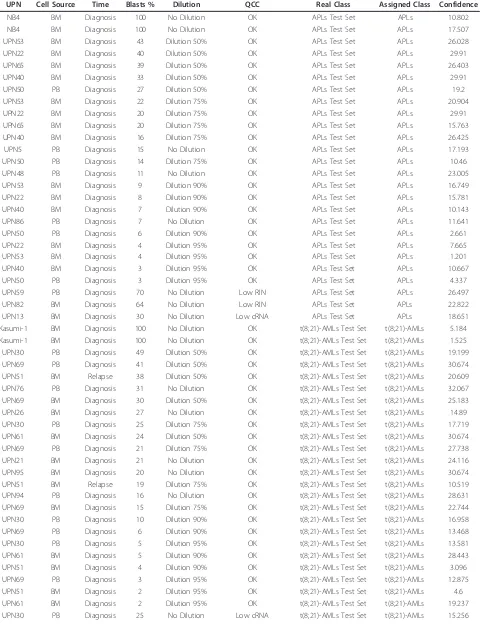
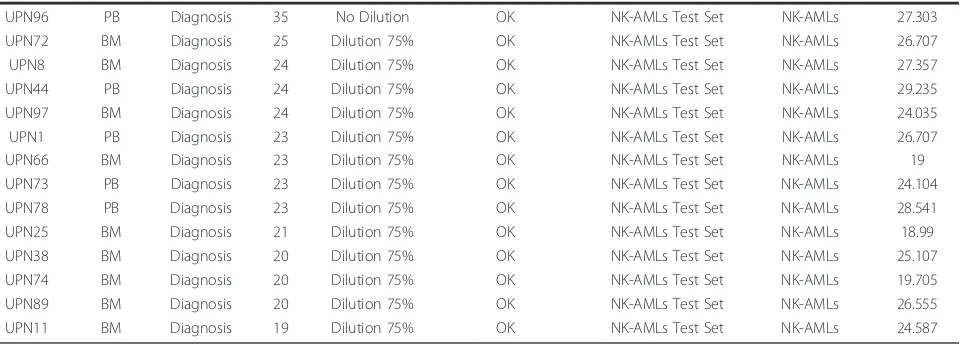
Table 3 Characteristics and class assignment of the 117 Test Set samples.
UPN Cell Source Time Blasts % Dilution QCC Real Class Assigned Class Confidence
NB4 BM Diagnosis 100 No Dilution OK APLs Test Set APLs 10.802
NB4 BM Diagnosis 100 No Dilution OK APLs Test Set APLs 17.507
UPN53 BM Diagnosis 43 Dilution 50% OK APLs Test Set APLs 26.028
UPN22 BM Diagnosis 40 Dilution 50% OK APLs Test Set APLs 29.91
UPN65 BM Diagnosis 39 Dilution 50% OK APLs Test Set APLs 26.403
UPN40 BM Diagnosis 33 Dilution 50% OK APLs Test Set APLs 29.91
UPN50 PB Diagnosis 27 Dilution 50% OK APLs Test Set APLs 19.2
UPN53 BM Diagnosis 22 Dilution 75% OK APLs Test Set APLs 20.904
UPN22 BM Diagnosis 20 Dilution 75% OK APLs Test Set APLs 29.91
UPN65 BM Diagnosis 20 Dilution 75% OK APLs Test Set APLs 15.763
UPN40 BM Diagnosis 16 Dilution 75% OK APLs Test Set APLs 26.425
UPN5 PB Diagnosis 15 No Dilution OK APLs Test Set APLs 17.193
UPN50 PB Diagnosis 14 Dilution 75% OK APLs Test Set APLs 10.46
UPN48 PB Diagnosis 11 No Dilution OK APLs Test Set APLs 23.005
UPN53 BM Diagnosis 9 Dilution 90% OK APLs Test Set APLs 16.749
UPN22 BM Diagnosis 8 Dilution 90% OK APLs Test Set APLs 15.781
UPN40 BM Diagnosis 7 Dilution 90% OK APLs Test Set APLs 10.143
UPN86 PB Diagnosis 7 No Dilution OK APLs Test Set APLs 11.641
UPN50 PB Diagnosis 6 Dilution 90% OK APLs Test Set APLs 2.661
UPN22 BM Diagnosis 4 Dilution 95% OK APLs Test Set APLs 7.665
UPN53 BM Diagnosis 4 Dilution 95% OK APLs Test Set APLs 1.201
UPN40 BM Diagnosis 3 Dilution 95% OK APLs Test Set APLs 10.667
UPN50 PB Diagnosis 3 Dilution 95% OK APLs Test Set APLs 4.337
UPN59 PB Diagnosis 70 No Dilution Low RIN APLs Test Set APLs 26.497
UPN82 BM Diagnosis 64 No Dilution Low RIN APLs Test Set APLs 22.822
UPN13 BM Diagnosis 30 No Dilution Low cRNA APLs Test Set APLs 18.651
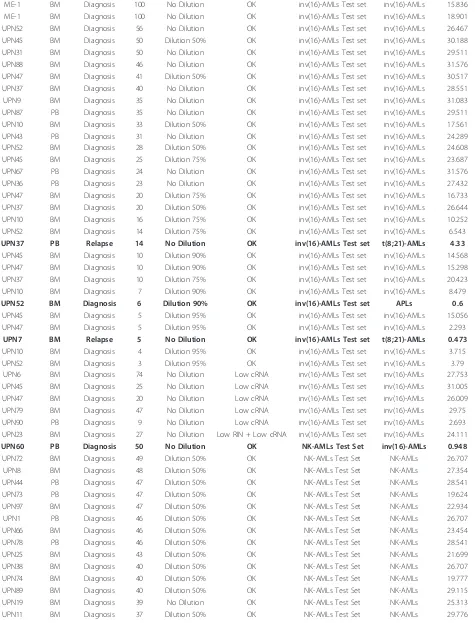
Table 3 Characteristics and class assignment of the 117 Test Set samples.(Continued)
ME-1 BM Diagnosis 100 No Dilution OK inv(16)-AMLs Test set inv(16)-AMLs 15.836 ME-1 BM Diagnosis 100 No Dilution OK inv(16)-AMLs Test set inv(16)-AMLs 18.901 UPN52 BM Diagnosis 56 No Dilution OK inv(16)-AMLs Test set inv(16)-AMLs 26.467 UPN45 BM Diagnosis 50 Dilution 50% OK inv(16)-AMLs Test set inv(16)-AMLs 30.188 UPN31 BM Diagnosis 50 No Dilution OK inv(16)-AMLs Test set inv(16)-AMLs 29.511 UPN88 BM Diagnosis 46 No Dilution OK inv(16)-AMLs Test set inv(16)-AMLs 31.576 UPN47 BM Diagnosis 41 Dilution 50% OK inv(16)-AMLs Test set inv(16)-AMLs 30.517 UPN37 BM Diagnosis 40 No Dilution OK inv(16)-AMLs Test set inv(16)-AMLs 28.551 UPN9 BM Diagnosis 35 No Dilution OK inv(16)-AMLs Test set inv(16)-AMLs 31.083 UPN87 PB Diagnosis 35 No Dilution OK inv(16)-AMLs Test set inv(16)-AMLs 29.511 UPN10 BM Diagnosis 33 Dilution 50% OK inv(16)-AMLs Test set inv(16)-AMLs 17.561 UPN43 PB Diagnosis 31 No Dilution OK inv(16)-AMLs Test set inv(16)-AMLs 24.289 UPN52 BM Diagnosis 28 Dilution 50% OK inv(16)-AMLs Test set inv(16)-AMLs 24.608 UPN45 BM Diagnosis 25 Dilution 75% OK inv(16)-AMLs Test set inv(16)-AMLs 23.687 UPN67 PB Diagnosis 24 No Dilution OK inv(16)-AMLs Test set inv(16)-AMLs 31.576 UPN36 PB Diagnosis 23 No Dilution OK inv(16)-AMLs Test set inv(16)-AMLs 27.432 UPN47 BM Diagnosis 20 Dilution 75% OK inv(16)-AMLs Test set inv(16)-AMLs 16.733 UPN37 BM Diagnosis 20 Dilution 50% OK inv(16)-AMLs Test set inv(16)-AMLs 26.644 UPN10 BM Diagnosis 16 Dilution 75% OK inv(16)-AMLs Test set inv(16)-AMLs 10.252 UPN52 BM Diagnosis 14 Dilution 75% OK inv(16)-AMLs Test set inv(16)-AMLs 6.543
UPN37 PB Relapse 14 No Dilution OK inv(16)-AMLs Test set t(8;21)-AMLs 4.33
UPN45 BM Diagnosis 10 Dilution 90% OK inv(16)-AMLs Test set inv(16)-AMLs 14.568 UPN47 BM Diagnosis 10 Dilution 90% OK inv(16)-AMLs Test set inv(16)-AMLs 15.298 UPN37 BM Diagnosis 10 Dilution 75% OK inv(16)-AMLs Test set inv(16)-AMLs 20.423 UPN10 BM Diagnosis 7 Dilution 90% OK inv(16)-AMLs Test set inv(16)-AMLs 8.479
UPN52 BM Diagnosis 6 Dilution 90% OK inv(16)-AMLs Test set APLs 0.6
UPN45 BM Diagnosis 5 Dilution 95% OK inv(16)-AMLs Test set inv(16)-AMLs 15.056 UPN47 BM Diagnosis 5 Dilution 95% OK inv(16)-AMLs Test set inv(16)-AMLs 2.293
UPN7 BM Relapse 5 No Dilution OK inv(16)-AMLs Test set t(8;21)-AMLs 0.473
UPN10 BM Diagnosis 4 Dilution 95% OK inv(16)-AMLs Test set inv(16)-AMLs 3.715 UPN52 BM Diagnosis 3 Dilution 95% OK inv(16)-AMLs Test set inv(16)-AMLs 3.79
UPN6 BM Diagnosis 74 No Dilution Low cRNA inv(16)-AMLs Test set inv(16)-AMLs 27.753 UPN45 BM Diagnosis 25 No Dilution Low cRNA inv(16)-AMLs Test set inv(16)-AMLs 31.005 UPN47 BM Diagnosis 20 No Dilution Low cRNA inv(16)-AMLs Test set inv(16)-AMLs 26.009 UPN79 BM Diagnosis 47 No Dilution Low cRNA inv(16)-AMLs Test set inv(16)-AMLs 29.75 UPN90 PB Diagnosis 9 No Dilution Low cRNA inv(16)-AMLs Test set inv(16)-AMLs 2.693 UPN23 BM Diagnosis 27 No Dilution Low RIN + Low cRNA inv(16)-AMLs Test set inv(16)-AMLs 24.111
UPN60 PB Diagnosis 50 No Dilution OK NK-AMLs Test Set inv(16)-AMLs 0.948
UPN72 BM Diagnosis 49 Dilution 50% OK NK-AMLs Test Set NK-AMLs 26.707
UPN8 BM Diagnosis 48 Dilution 50% OK NK-AMLs Test Set NK-AMLs 27.354
UPN44 PB Diagnosis 47 Dilution 50% OK NK-AMLs Test Set NK-AMLs 28.541
UPN73 PB Diagnosis 47 Dilution 50% OK NK-AMLs Test Set NK-AMLs 19.624
UPN97 BM Diagnosis 47 Dilution 50% OK NK-AMLs Test Set NK-AMLs 22.934
UPN1 PB Diagnosis 46 Dilution 50% OK NK-AMLs Test Set NK-AMLs 26.707
UPN66 BM Diagnosis 46 Dilution 50% OK NK-AMLs Test Set NK-AMLs 23.454
UPN78 PB Diagnosis 46 Dilution 50% OK NK-AMLs Test Set NK-AMLs 28.541
UPN25 BM Diagnosis 43 Dilution 50% OK NK-AMLs Test Set NK-AMLs 21.699
UPN38 BM Diagnosis 40 Dilution 50% OK NK-AMLs Test Set NK-AMLs 26.707
UPN74 BM Diagnosis 40 Dilution 50% OK NK-AMLs Test Set NK-AMLs 19.777
UPN89 BM Diagnosis 40 Dilution 50% OK NK-AMLs Test Set NK-AMLs 29.115
UPN19 BM Diagnosis 39 No Dilution OK NK-AMLs Test Set NK-AMLs 25.313
(version 1.8.0) were used for signal extraction and nor-malization (for the Training Set only). Briefly, the Invar-iant Rank normalization method was applied to the primary probe data obtained from the Training Set sam-ples. Processed probe data were then filtered according to the following criteria: minimal signal intensity fold change of 1.50 across all samples; minimal probe signal intensity absolute change of 150 across all samples (choice based on the maximum expression levels of XIST transcript in males, and CYorf15Btranscript in females); and maximal value for probe signal intensity of 50 000 across all samples. Among the 48 803 probes assessed on HumanHT-12 v3 Expression BeadChips, 11 779 satisfied these low stringency filtering criteria. Fil-tered data were then log-transformed and exported to appropriate softwares for the analyses. Regarding the Test Set samples processing, only data concerning the markers identified during the first analysis, restricted to the Training Set, were used. These raw data were log-transformed and merged to the one of the Training Set for class prediction analyses. The Class Prediction Mod-ule of ArrayMiner 5.3.3 (Optimal Design, Brussels, Bel-gium - http://www.optimaldesign.org), which uses a proprietary method based on grouping genetic algo-rithms, was used for all class prediction analyses (see additional file 1 for details) [24]. This module allowed calculating the confidence level of the class prediction for each sample, or for a given group of samples, and the fitness of the overall model. This estimator enabled optimizing the number of probes/markers to be used per class. Briefly, the confidence level of the class pre-diction analysis reflected the strength with which the probe/marker landed each sample into its predicted class. More precisely, for each sample, the following
happened: (1) each probe/marker casted its vote for the sample being in each of the train classes, (2) the votes were summed up over all probes/markers, yielding a vote for each of the classes, (3) the score of the winner class (call it S1) was compared to the second best (call it S2), and the confidence level of the classification of the sample was computed as (S1-S2)/(S1+S2). In the Cross-validation analysis, the same was performed, except that the probe/marker set was recomputed each time, leaving out the sample being tested in order to yield an honest estimate of the worth of the method. The fitness of a class prediction model was computed on the test samples only, in order to estimate how good the class prediction (of the“unclassified” samples) was, and reflected the success with which the model was able to correctly (re)classify the already“classified” samples. The fitness of the model was in fact the result of a cross-validation (as described above) on the Training samples, with the integral part being equal to the num-ber of correct (re)classifications, and the fractional part being computed as follows: (1) if all samples were cor-rectly classified, the average confidence level (as defined above) of all samples, (2) if some samples were missified, the average confidence level of the correctly clas-sified samples minus the average confidence level of the misclassified ones. If all samples were misclassified, the fitness of the model was zero. Omics Explorer 2.2 soft-ware (Qlucore, Lund, Sweden - http://www.qlucore. com) was used for principal-component analyses. S-Plus®8.0 Enterprise Developer software (Insightful Cor-poration, Seattle, USA) was used for all other statistical analyses. The two datasets (Training Set and Test Set) discussed in this publication have been deposited in NCBI’s Gene Expression Omnibus and are accessible
Table 3 Characteristics and class assignment of the 117 Test Set samples.(Continued)
UPN96 PB Diagnosis 35 No Dilution OK NK-AMLs Test Set NK-AMLs 27.303
UPN72 BM Diagnosis 25 Dilution 75% OK NK-AMLs Test Set NK-AMLs 26.707
UPN8 BM Diagnosis 24 Dilution 75% OK NK-AMLs Test Set NK-AMLs 27.357
UPN44 PB Diagnosis 24 Dilution 75% OK NK-AMLs Test Set NK-AMLs 29.235
UPN97 BM Diagnosis 24 Dilution 75% OK NK-AMLs Test Set NK-AMLs 24.035
UPN1 PB Diagnosis 23 Dilution 75% OK NK-AMLs Test Set NK-AMLs 26.707
UPN66 BM Diagnosis 23 Dilution 75% OK NK-AMLs Test Set NK-AMLs 19
UPN73 PB Diagnosis 23 Dilution 75% OK NK-AMLs Test Set NK-AMLs 24.104
UPN78 PB Diagnosis 23 Dilution 75% OK NK-AMLs Test Set NK-AMLs 28.541
UPN25 BM Diagnosis 21 Dilution 75% OK NK-AMLs Test Set NK-AMLs 18.99
UPN38 BM Diagnosis 20 Dilution 75% OK NK-AMLs Test Set NK-AMLs 25.107
UPN74 BM Diagnosis 20 Dilution 75% OK NK-AMLs Test Set NK-AMLs 19.705
UPN89 BM Diagnosis 20 Dilution 75% OK NK-AMLs Test Set NK-AMLs 26.555
UPN11 BM Diagnosis 19 Dilution 75% OK NK-AMLs Test Set NK-AMLs 24.587
UPN, unique patient number. BM, bone marrow. PB, peripheral blood. QCC, quality control criteria.
through GEO Series accession number GSE34823 http:// www.ncbi.nlm.nih.gov/geo/query/acc.cgi?acc=GSE34823. The dataset associated with the Training Set is also linked to the SubSeries accession number GSE34577. The dataset associated with the Test Set is also linked to the SubSeries accession number GSE34714.
Results
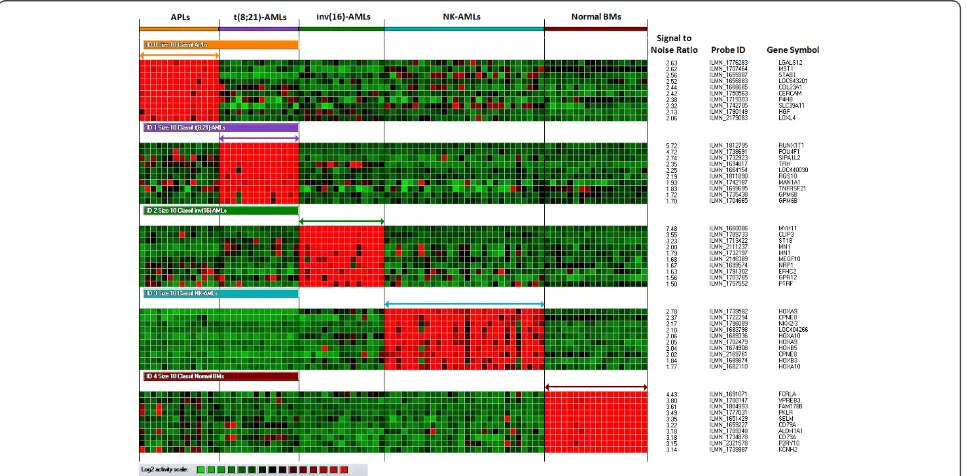
Identification of classifiers from optimal APL, t(8;21)-AML, inv(16)-AML and NK-AML samples
First, using the Class Prediction Module of ArrayMiner 5.3.3 software, classifiers associated with the APL, t (8;21)-AML, inv(16)-AML, NK-AML classes were defined based on 71 samples containing at least 60% of leukemic blasts and characterized by good quality con-trol criteria (Optimal samples - Training Set). At this stage, unique and pooled normal bone marrow samples were also included in the model as the objective was to enhance the predictive capacity of the classifiers, espe-cially for Test Set samples containing a majority of resi-dual normal cells and a low leukemic blast load. Evaluating classifiers which included from 1 to 100 mar-kers per class, all Training Set samples were assigned to the correct class when selecting from 3 to 46 markers per class (class prediction accuracy, sensitivity, specifi-city, negative and positive predictive values, 100% for each class - error rate, 0%), whether the source of leuke-mic cells was bone marrow or peripheral blood. The
best model fitness was obtained with 8, 9 or 10 markers per classifier. To select the optimal model among these three, a principal-component analysis was performed. The highest cumulative percent of variance accounted for by the first three components was obtained with the 10-marker classifiers (cumulative percent of variance with classifiers including 10 markers, 79 percent - addi-tional file 1, Figure S1), which led to select these for subsequent analyses (Figure 1). The best median confi-dence levels for the correct assignment of the Training Set samples were achieved with 10, 2, 1, and 9 markers for APLs, t(8;21)-AMLs, inv(16)-AMLs, and NK-AMLs, respectively (additional file 1, Figure S2). Regarding NK-AMLs and in agreement with previous reports, the high-est median confidence levels were observed for NK-AMLs with mutatedNPM1and the lowest ones for NK-AMLs with neither NPM1nor FLT3mutations (addi-tional file 1, Figure S3) [22-26].
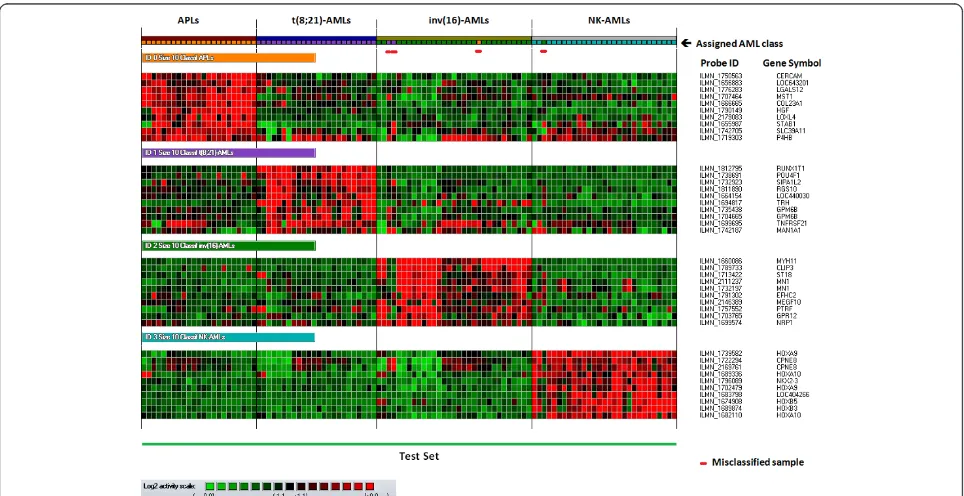
Class prediction analysis for suboptimal AML samples -Impact of the leukemic blast load
Using the 10-marker classifiers, the GGA-based super-vised method was subsequently applied to a series of 101 Test Set samples, with optimal quality control cri-teria, for which the leukemic blast load was originally below 60 percent or had been artificially lowered to less than 60 percent blasts by dilution series. Only the classi-fiers associated with one of the four AML classes were
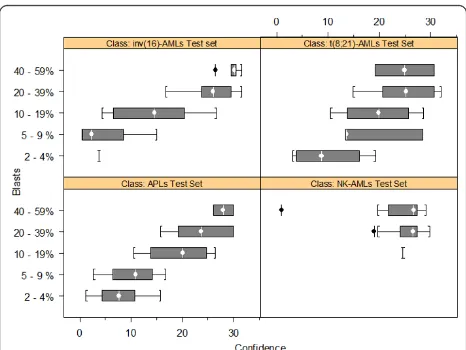
considered for this analysis. All APL and t(8;21)-AML Test Set samples were correctly classified, even when containing as low as 2 percent blasts (Table 3 - Figure 2). Twenty six of the 29 inv(16)-AML samples were assigned to the expected class, including the 95 percent-diluted ones which contained as low as 3 percent blasts (error rate, 10 percent). In all three inv(16)-AML Test Set samples that were incorrectly classified, CBFB -MYH11 fusion gene was detected by FISH assay. For APL, t(8;21)-AML and inv(16)-AML classes, the blast load significantly influenced the confidence level of the class assignment (Figures 3 - additional file 1, Figure S4). For NK-AMLs, all but 1 of the 29 Test Set samples were correctly classified (error rate, 3 percent) (Table 3). This misclassified sample, obtained at diagnosis from UPN60, had noNPM1, FLT3or CEBPA mutations. Its class assignment, characterized by a low confidence level (given its blast load - Table 1, additional file 1, Figure S4), was not confirmed as no PML/RARA fusion gene was detected by FISH analysis and RT-PCR assay. Across the range of leukemic blast loads studied in the Test Set, the confidence level associated with the class assignment of diluted AML samples was not different from the one achieved for undiluted low leukemic blast load samples (Table 3 - additional file 1, Figure S5). For those 101 AML Test set samples with low leukemic
blast load and optimal quality control criteria, the over-all error rate was 3.9 percent.
Class prediction analysis for suboptimal AML samples -Impact of quality control criteria
When the performance of the 10-marker classifiers was assessed on 10 samples that did not fulfill all quality control criteria, all suboptimal samples were assigned to the expected class, even though their leukemic blast content was as low as 9 percent (median, 55 percent; range 9 to 100 percent) (Table 3 - additional file 1, Fig-ure S6). The confidence level for the class assignment of these samples was not different from the one achieved for the other Test Set samples (Data not shown).
Overall, the error rate was 3.6 percent for the entire Test Set (excluding AML cell lines that were considered as controls), and for each class, sensitivity and specifi-city, negative and positive predictive values of the class assignments ranged from 91 to 100 percent (additional file 1, Figure S7).
Discussion
The integration of microarray-derived data to the cur-rent workflow dealing with the prognostic evaluation of AML patients requires the technology to deliver infor-mative data for the majority of samples, including those
with suboptimal characteristics. The current study focused on this kind of samples - either with a low leukemic blast load, poor quality control criteria or both -and the ability to identify favorable-risk karyotype AMLs in such situations, using microarray-based GEP and a class prediction method based on GGA. Apart from the study of de Ridder et al, which addressed the impact of random, fixed and group-specific impurities on the results of differential gene expression analyses, using a limited set of samples and computer simulations, the influence of the leukemic blast load on class prediction accuracy based on GEP data has never been specifically studied so far [25]. To evaluate the capacity of microar-ray-derived predictors to correctly assigned samples with a low leukemic blast load, besides using “real” AML samples with low blast percentage, i.e., less than 60 percent, a“dilution/mixture” approach was consid-ered [26,27]. This strategy has already been successfully applied to assess the efficiency of various normalization methods applied to microarray datasets. It consisted in diluting labeled cRNAs of originally high blast load AML samples within pools of normal bone marrow labeled cRNAs. This approach was also considered as in some AML subtypes, such as t(8;21)-AMLs, more differ-entiated cells (not counted as blasts) are frequently of leukemic origin, leading to under-estimate the leukemic
load of some“low blast content”samples. Consequently, it became possible to accurately control the percentage of leukemic blasts within the Test Set sample down to 2 percent.
Overall, considering the 111 Test Set samples with low leukemic blast load and/or suboptimal quality con-trol criteria, whether being peripheral blood or bone marrow samples, the predictive capacity of the GGA-derived model with 10-marker classifiers was encoura-ging, with specificities ranging from 0.98 to 1.00, and sensitivities ranging from 0.91 to 1.00. Moreover, con-sidering AML samples containing 20 to 56 percent blasts, the overall error rate was lower than 1.4 percent (1 misclassified NK-AML sample out of 72). Finally, APL, t(8;21)-AML, and inv(16)-AML samples containing as low as 2 percent blasts could be correctly classified, whether the classifiers mainly relied on a single marker, such as for inv(16)-AMLs and t(8;21)-AMLs, or on the overall set of 10 markers defining the classifier, as for APL samples. However, regarding APL, t(8;21)-AML and inv(16)-AML samples, the confidence level of the class assignment was correlated to the percentage of leukemic blasts within the studied samples. For NK-AML samples, such a finding was not observed, prob-ably because NK-AMLs represent a more heterogeneous group of leukemias as compared to t(8;21)-AMLs, inv (16)-AMLs or APLs in term of oncogenic processes. This heterogeneity likely led to a higher variance of gene expression profiles within the NK-AML class, to the detriment of the interclass variance, hence influen-cing the class prediction confidence level more than the leukemic blast load. This hypothesis was supported by the fact that, within the NK-AML class, the best predic-tive capacity of the GGA was achieved for NPM1 -mutated samples, in accordance with previous studies, and the worst one for samples with noNPM1andFLT3 mutations [28-31].
Unexpectedly, the worst results of the class prediction analysis were achieved for inv(16)-AML Test set samples (Sensitivity, 0.91; negative predictive value, 0.96). Among the three misclassified inv(16)-AML samples and for which the presence of CBFB/MYH11fusion gene was confirmed by FISH analysis, all contained less than 20 percent blasts and two were obtained at the time of relapse - from patients UPN7 and UPN37 -. Regarding these two samples, which respectively contained 5 and 14 percent blasts, they were characterized by a low expression level of most markers defining the inv(16)-AML specific signature; especially MYH11, which expression level was within the estimated background signal range. It is noteworthy that for one of those two patients, UPN37, the bone marrow sample obtained at diagnosis was correctly classified, even when diluted at 50 and 75 percent (blast content, 20 and 10 percent, Figure 3 Box plots of the confidence levels for the class
respectively). For this patient, a clonal evolution of the disease was suspected as CD2, CD13, CD34 and CD117 expression values, assessed by flow cytometry on gated leukemic cells, andMYH11expression level (microarray data) were significantly lower in the relapse sample as compare to the ones observed in the diagnostic sample. Verhaak et al in their study using Affymetrix GeneChips reported that MYH11expression level was sufficient to identify inv(16)-AMLs [10]. The present results suggest that the use of MYH11 as the sole marker for the inv (16)-AML class could lead to unstable results in a class prediction model, especially in low leukemic blast load samples or in case of a clonal evolution at relapse. Of note, the inv(16)-AML signature developed on the AMLProfiler™ kit http://www.skyline-diagnostics.com, which uses the Affymetrix™ platform, also includes a set of 19 markers [32].
As reported by Kohlmann et al., sub-optimal AML samples with poor quality control criteria, mainly because of low amounts of hybridized cRNAs, were all correctly classified, even though half of these contained less than 60 percent blasts (down to 9 percent for UPN90) [33]. Studying the impact of RNA degradation on GEP analyses, similar results have been recently reported by Opitz et al on a different microarray plat-form [34]. As in the present study, they showed that useful information could still be obtained from thermi-cally degraded RNA; at least to a certain extent, and depending on the length of the mRNA molecules. Inter-estingly, even AML samples for which a third of the required cRNA amount was hybridized on BeadChips could be assigned to the correct class in the present study, suggesting that the biological variance between the AML classes was higher than the one related to technical variability or artifacts. This result could also be related to the fact that, during the sample processing, the TotalPrep RNA Amplification kit that was used, did not required any fragmentation step, which could further alter poor quality RNA or lower the already reduced cRNA amounts. These encouraging results, on a limited set of poor quality samples, could also be related to the classification method used, as the GGA-based class prediction strategy aimed at finding the most influential markers for each AML class (top mar-kers with the highest inter-class variance and the lowest intra-class variance). This GGA-based class prediction method was indeed associated with the lowest error rate and the highest predictive accuracy when compared to other supervised methods, such as support vector machines, random forests, artificial neural networks, k-Nearest Neighbor or nearest shrunken centroids (also known as PAM) (data not shown).
Although, in most cases, these favorable prognostic chromosomal abnormalities and/or their related gene
products can be detected by karyotype, FISH or PCR assay, they represent main targets for a microarray-based class prediction analysis to be identified before considering GEP as a useful tool in a routine workflow for prognostic assessment of AML patients. The fact that the AMLProfiler, a microarray-derived kit based on the Affymetrix™ platform, has been recently commer-cialized with the aim of achieving a molecular diagnosis for APLs, t(8;21)-AMLs and inv(16)-AMLs, respectively using 27, 31 and 19 markers, emphasizes this assump-tion [32].
Finally, regarding the classifiers associated with APLs, t(8;21)-AMLs or inv(16)-AMLs, 18 of the 28 markers identified in this study (64 percent) had already been reported in previous studies using various microarray technologies (additional file 1, Table S1). These findings (1) confirm that the Illumina bead-based technology is as reliable, robust and sensitive as other microarray technologies developed by commercial manufacturers or academic facilities, and (2) suggest that the GGA-derived class prediction approach is a highly efficient one as it required a limited set of ten markers per class to achieve accurate class assignments. Furthermore, this study has identified new AML markers that will need further studies to delineate their role in the leukemo-genic events involved in APLs (CERCAM, COL23A1, LOC643201, LOXL4, SLC39A11), t(8;21)-AMLs (LOC440030,TNFRSF21), and inv(16)-AMLs (EFHC2, GPR12, MEGF10).
Conclusions
In more than 96 percent of the suboptimal cases, using a microarray-derived GEP approach and a GGA-based class prediction method, favorable cytogenetic risk AML samples with low leukemic blast load and/or poor qual-ity control criteria could be correctly assign to the appropriate class with a limited set of markers, allowing to consider GEP as a useful tool in a routine workflow for prognostic assessment of AML patients.
Additional material
Figure S3. Median confidence level of the class assignments for the NK-AML samples belonging to the Training Set according toFLT3andNPM1 mutational status and the number of markers per class (from 1 to 100 markers per class). Figure S4. Relationship between the percentage of leukemic blasts within the 101 Test Set samples (X axis) and the confidence level of their class assignments (Y axis) (samples with poor quality control criteria and AML cell lines were excluded). Figure S5. Confidence level of the class assignments according to the percentage of leukemic blasts including comparisons between diluted and not diluted samples. Figure S6. Results of the class assignment for the 10 AML Test Set samples with suboptimal quality control criteria based on the 10-marker classifiers characterizing the APL, t(8;21)-AML, inv(16)-AML and NK-AML classes. Figure S7. Sensitivity, specificity, negative and positive predictive values of the prediction model for the class assignment of the 111 Test Set samples (all AML samples with or without optimal quality control criteria - AML cell line samples excluded) to the APL, t(8;21)-AML, inv(16)-AML and NK-AML classes with 10-marker classifiers.
List of abbreviations used
APL: acute promyelocytic leukemia; AML: acute myeloid leukemia; GEP: gene expression profiling; GGA: grouping genetic algorithms; NK-AML:
cytogenetically normal acute myeloid leukemia; RIN: RNA integrity number.
Acknowledgements and funding
PhG from Plateforme SNP, Transcriptome & Epigénomique received a grant from La Ligue Contre le Cancer/Comité Départemental 49 to support this work.
Author details
1Plateforme SNP, Transcriptome & Epigénomique, Centre Hospitalier
Universitaire, Angers, France.2Institut National de la Santé et de la
Recherche Médicale, Unité 892, Centre de Recherche sur le Cancer Nantes Angers et UMR_S 892, Université d’Angers, Angers, France.3Laboratoire
d’Hématologie, Centre Hospitalier Universitaire, Angers, France.4Laboratoire d’Hématologie, Centre Hospitalier Universitaire, Reims, France.5Laboratoire
de Génétique, Centre Hospitalier Universitaire, Angers, France.6Service des
Maladies du Sang, Centre Hospitalier Universitaire, Angers, France.
Authors’contributions
PhG was the principal investigator and takes primary responsibility for the paper. DRB, OB and PhG contribute to the conception of design. DRB, PCL, AC, LB, FG, IL, MHB, AB, AST, MZ, YD, NI, OB, PhG contribute to the collection and assembly of data. DRB, OB, YD, MZ, NI, PhG contribute to the data analysis and interpretation. DRB, PhG contribute to manuscript writing. DRB, OB, PCL, AC, LB, FG, IL, MHB, AB, AST, MZ, YD, NI, PhG contribute to the drafting of the article, revise it and approved the final version. PhG coordinated the research.
Authors’information
PhG is the Head of Plateforme SNP, Transcriptome & Epigénomique, i.e., the genomic platform of Angers University Hospital, and is also an Associate Editor at BMC Genomics and a member of the American Society of Human Genetics.
Competing interests
The authors declare that they have no competing interests.
Received: 13 September 2011 Accepted: 30 January 2012 Published: 30 January 2012
References
1. Döhner H, Estey EH, Amadori S, Appelbaum FR, Büchner T, Burnett AK, Dombret H, Fenaux P, Grimwade D, Larson RA, Lo-Coco F, Naoe T, Niederwieser D, Ossenkoppele GJ, Sanz MA, Sierra J, Tallman MS, Löwenberg B, Bloomfield CD, European LeukemiaNet:Diagnosis and management of acute myeloid leukemia in adults: recommendations
from an international expert panel, on behalf of the European LeukemiaNet.Blood2010,115:453-74.
2. Baldus CD, Mrózek K, Marcucci G, Bloomfield CD:Clinical outcome of de novo acute myeloid leukaemia patients with normal cytogenetics is affected by molecular genetic alterations: a concise review.Br J Haematol2007,137:387-400.
3. Grimwade D, Walker H, Oliver F, Wheatley K, Harrison C, Harrison G, Rees J, Hann I, Stevens R, Burnett A, Goldstone A:The importance of diagnostic cytogenetics on outcome in AML: analysis of 1612 patients entered into the MRC AML 10 trial. The Medical Research Council Adult and Children’s Leukaemia Working Parties.Blood1998,92:2322-33. 4. Breems DA, Van Putten WL, De Greef GE, Van Zelderen-Bhola SL,
Gerssen-Schoorl KB, Mellink CH, Nieuwint A, Jotterand M, Hagemeijer A, Beverloo HB, Löwenberg B:Monosomal karyotype in acute myeloid leukemia: a better indicator of poor prognosis than a complex karyotype.J Clin Oncol2008,26:4791-7.
5. Iqbal S, Grimwade D, Chase A, Goldstone A, Burnett A, Goldman JM, Swirsky D:Identification of PML/RARalpha rearrangements in suspected acute promyelocytic leukemia using fluorescence in situ hybridization of bone marrow smears: a comparison with cytogenetics and RT-PCR in MRC ATRA trial patients. MRC Adult Leukaemia Working Party.Leukemia 2000,14:950-3.
6. Grimwade D, Biondi A, Mozziconacci MJ, Hagemeijer A, Berger R, Neat M, Howe K, Dastugue N, Jansen J, Radford-Weiss I, Lo Coco F, Lessard M, Hernandez JM, Delabesse E, Head D, Liso V, Sainty D, Flandrin G, Solomon E, Birg F, Lafage-Pochitaloff M:Characterization of acute promyelocytic leukemia cases lacking the classic t(15;17): results of the European Working Party. Groupe Français de Cytogénétique
Hématologique, Groupe de Français d’Hematologie Cellulaire, UK Cancer Cytogenetics Group and BIOMED 1 European Community-Concerted Action“Molecular Cytogenetic Diagnosis in Haematological Malignancies”.Blood2000,96:1297-308.
7. Mitterbauer M, Kusec R, Schwarzinger I, Haas OA, Lechner K, Jaeger U: Comparison of karyotype analysis and RT-PCR for AML1/ETO in 204 unselected patients with AML.Ann Hematol1998,76:139-43.
8. Rowe D, Cotterill SJ, Ross FM, Bunyan DJ, Vickers SJ, Bryon J, McMullan DJ, Griffiths MJ, Reilly JT, Vandenberghe EA, Wilson G, Watmore AE, Bown NP: Cytogenetically cryptic AML1-ETO and CBF beta-MYH11 gene
rearrangements: incidence in 412 cases of acute myeloid leukaemia.Br J Haematol2000,111:1051-6.
9. Mrózek K, Prior TW, Edwards C, Marcucci G, Carroll AJ, Snyder PJ, Koduru PR, Theil KS, Pettenati MJ, Archer KJ, Caligiuri MA, Vardiman JW, Kolitz JE, Larson RA, Bloomfield CD:Comparison of cytogenetic and molecular genetic detection of t(8;21) and inv(16) in a prospective series of adults with de novo acute myeloid leukemia: a Cancer and Leukemia Group B Study.J Clin Oncol2001,19:2482-92.
10. Verhaak RG, Wouters BJ, Erpelinck CA, Abbas S, Beverloo HB, Lugthart S, Löwenberg B, Delwel R, Valk PJ:Prediction of molecular subtypes in acute myeloid leukemia based on gene expression profiling.Haematologica 2009,94:131-4.
11. Valk PJ, Verhaak RG, Beijen MA, Erpelinck CA, Barjesteh van Waalwijk van Doorn-Khosrovani S, Boer JM, Beverloo HB, Moorhouse MJ, van der Spek PJ, Löwenberg B, Delwel R:Prognostically useful gene-expression profiles in acute myeloid leukemia.N Engl J Med2004,350:1617-28.
12. Bullinger L, Döhner K, Bair E, Fröhling S, Schlenk RF, Tibshirani R, Döhner H, Pollack JR:Use of gene-expression profiling to identify prognostic subclasses in adult acute myeloid leukemia.N Engl J Med2004, 350:1605-16.
13. Haferlach T, Kohlmann A, Wieczorek L, Basso G, Kronnie GT, Béné MC, De Vos J, Hernández JM, Hofmann WK, Mills KI, Gilkes A, Chiaretti S, Shurtleff SA, Kipps TJ, Rassenti LZ, Yeoh AE, Papenhausen PR, Liu WM, Williams PM, Foà R:Clinical utility of microarray-based gene expression profiling in the diagnosis and subclassification of leukemia: report from the International Microarray Innovations in Leukemia Study Group.J Clin Oncol2010,28:2529-37.
14. Haferlach T, Kohlmann A, Schnittger S, Dugas M, Hiddemann W, Kern W, Hiddemann W, Kern W, Schoch C:Global approach to the diagnosis of leukemia using gene expression profiling.Blood2005,106:1189-98. 15. Schoch C, Kohlmann A, Schnittger S, Brors B, Dugas M, Mergenthaler S,
reciprocal rearrangements can be distinguished by specific gene expression profiles.Proc Natl Acad Sci USA2002,99:10008-13. 16. Kohlmann A, Schoch C, Schnittger S, Dugas M, Hiddemann W, Kern W,
Haferlach T:Molecular characterization of acute leukemias by use of microarray technology.Genes Chromosomes Cancer2003,37:396-405. 17. Gutiérrez NC, López-Pérez R, Hernández JM, Isidro I, González B, Delgado M,
Fermiñán E, García JL, Vázquez L, González M, San Miguel JF:Gene expression profile reveals deregulation of genes with relevant functions in the different subclasses of acute myeloid leukemia.Leukemia2005, 19:402-9.
18. Ross ME, Mahfouz R, Onciu M, Liu HC, Zhou X, Song G, Shurtleff SA, Pounds S, Cheng C, Ma J, Ribeiro RC, Rubnitz JE, Girtman K, Williams WK, Raimondi SC, Liang DC, Shih LY, Pui CH, Downing JR:Gene expression profiling of pediatric acute myelogenous leukemia.Blood2004, 104:3679-87.
19. Gabert J, Beillard E, van der Velden VH, Bi W, Grimwade D, Pallisgaard N, Barbany G, Cazzaniga G, Cayuela JM, Cavé H, Pane F, Aerts JL, De Micheli D, Thirion X, Pradel V, González M, Viehmann S, Malec M, Saglio G, van Dongen JJ:Standardization and quality control studies of‘real-time’ quantitative reverse transcriptase polymerase chain reaction of fusion gene transcripts for residual disease detection in leukemia - a Europe Against Cancer program.Leukemia2003,17:2318-57.
20. Boissel N, Renneville A, Biggio V, Philippe N, Thomas X, Cayuela JM, Terre C, Tigaud I, Castaigne S, Raffoux E, De Botton S, Fenaux P, Dombret H, Preudhomme C:Prevalence, clinical profile, and prognosis of NPM mutations in AML with normal karyotype.Blood2005,106:3618-20. 21. Nakao M, Yokota S, Iwai T, Kaneko H, Horiike S, Kashima K, Sonoda Y,
Fujimoto T, Misawa S:Internal tandem duplication of the flt3 gene found in acute myeloid leukemia.Leukemia1996,10:1911-8.
22. Abu-Duhier FM, Goodeve AC, Wilson GA, Care RS, Peake IR, Reilly JT: Identification of novel FLT-3 Asp835 mutations in adult acute myeloid leukaemia.Br J Haematol2001,113:983-8.
23. Pabst T, Mueller BU, Zhang P, Radomska HS, Narravula S, Schnittger S, Behre G, Hiddemann W, Tenen DG:Dominant-negative mutations of CEBPA, encoding CCAAT/enhancer binding protein-alpha (C/EBPalpha), in acute myeloid leukemia.Nat Genet2001,27:263-70.
24. Falkenauer E:The grouping genetic algorithm.InGenetic Algorithms and Grouping Problems..First edition. Edited by: Falkenauer E. Chichester: Wiley J 1998:81-110.
25. de Ridder D, van der Linden CE, Schonewille T, Dik WA, Reinders MJ, van Dongen JJ, Staal FJ:Purity for clarity: the need for purification of tumor cells in DNA microarray studies.Leukemia2005,19:618-27.
26. Lemon WJ, Palatini JJ, Krahe R, Wright FA:Theoretical and experimental comparisons of gene expression indexes for oligonucleotide arrays.
Bioinformatics2002,18:1470-6.
27. Irizarry RA, Bolstad BM, Collin F, Cope LM, Hobbs B, Speed TP:Summaries of Affymetrix GeneChip probe level data.Nucleic Acids Res2003,31:e15. 28. Mullighan CG, Kennedy A, Zhou X, Radtke I, Phillips LA, Shurtleff SA,
Downing JR:Pediatric acute myeloid leukemia with NPM1 mutations is characterized by a gene expression profile with dysregulated HOX gene expression distinct from MLL-rearranged leukemias.Leukemia2007, 21:2000-9.
29. Verhaak RG, Goudswaard CS, van Putten W, Bijl MA, Sanders MA, Hugens W, Uitterlinden AG, Erpelinck CA, Delwel R, Löwenberg B, Valk PJ:Mutations in nucleophosmin (NPM1) in acute myeloid leukemia (AML): association with other gene abnormalities and previously established gene expression signatures and their favorable prognostic significance.Blood 2005,106:3747-54.
30. Alcalay M, Tiacci E, Bergomas R, Bigerna B, Venturini E, Minardi SP, Meani N, Diverio D, Bernard L, Tizzoni L, Volorio S, Luzi L, Colombo E, Lo Coco F, Mecucci C, Falini B, Pelicci PG:Acute myeloid leukemia bearing cytoplasmic nucleophosmin (NPMc+ AML) shows a distinct gene expression profile characterized by up-regulation of genes involved in stem-cell maintenance.Blood2005,106:899-902.
31. Kohlmann A, Bullinger L, Thiede C, Schaich M, Schnittger S, Döhner K, Dugas M, Klein HU, Döhner H, Ehninger G, Haferlach T:Gene expression profiling in AML with normal karyotype can predict mutations for molecular markers and allows novel insights into perturbed biological pathways.Leukemia2010,24:1216-20.
32. van Beers E, de Best L, van Vliet M, Brand J, Burgmer P, de Quartel L, Dumee B, Provoost A, Valk P, Delwel H, Büllinger L, van der Spek P,
Viëtor H, Döhner H, Löwenberg B:A validated diagnostic microarray for newly diagnosed adult AML patients., Oral Communication at European Hematology Association annual meeting London 2011. Abstract O469. 33. Kohlmann A, Schoch C, Dugas M, Rauhut S, Weninger F, Schnittger S,
Kern W, Haferlach T:Pattern robustness of diagnostic gene expression signatures in leukemia.Genes Chromosomes Cancer2005,42:299-307. 34. Opitz L, Salinas-Riester G, Grade M, Jung K, Jo P, Emons G, Ghadimi BM,
Beissbarth T, Gaedcke J:Impact of RNA degradation on gene expression profiling.BMC Med Genomics2010,3:36.
Pre-publication history
The pre-publication history for this paper can be accessed here: http://www.biomedcentral.com/1755-8794/5/6/prepub
doi:10.1186/1755-8794-5-6
Cite this article as:de la Blétièreet al.:Routine use of microarray-based gene expression profiling to identify patients with low cytogenetic risk acute myeloid leukemia: accurate results can be obtained even with suboptimal samples.BMC Medical Genomics20125:6.
Submit your next manuscript to BioMed Central and take full advantage of:
• Convenient online submission
• Thorough peer review
• No space constraints or color figure charges
• Immediate publication on acceptance
• Inclusion in PubMed, CAS, Scopus and Google Scholar
• Research which is freely available for redistribution