Research Journal
Volume 11, Issue 2, June 2017, pages 95–102
DOI: 10.12913/22998624/69149 Research Article
DETECTION OF DRIVER SLEEPINESS AND WARNING THE DRIVER IN
REAL-TIME USING IMAGE PROCESSING AND MACHINE LEARNING TECHNIQUES
İlhan Umut1, Ozan Aki1, Erdem Uçar1, Levent Öztürk2
1 Department of Computer Engineering, Faculty of Engineering, Trakya University, Ahmet Karadeniz Yerleşkesi,
Edirne, Turkey, e-mail: [email protected], [email protected], [email protected]
2 Department of Physiology, Faculty of Medicine, Trakya University, Balkan Yerleşkesi, Edirne, e-mail:
ABSTRACT
The aim of this study is to design and implement a system that detect driver sleepiness and warn driver in real-time using image processing and machine learning techniques. Viola-Jones detector was used for segmenting face and eye images from the camera-acquired driver video. Left and right eye images were combined into a single image. Thus, an image was obtained in minimum dimensions containing both eyes. Features of these images were extracted by using Gabor filters. These features were used to classifying images for open and closed eyes. Five machine learning algorithms were evaluated with four volunteer’s eye image data set obtained from driving simulator. Nearest neighbor IBk algorithm has highest accuracy by 94.76% while J48 decision tree algorithm has fastest classification speed with 91.98% accuracy. J48 decision tree algorithm was recommended for real time running. PERCLOS the ratio of number of closed eyes in one minute period and CLOSDUR the duration of closed eyes were calculated. The driver is warned with the first level alarm when the PERCLOS value is 0.15 or above, and with second level alarm when it is 0.3 or above. In addition, when it is detected that the eyes remain closed for two seconds, the driver is also warned by the second level alarm regardless of the PERCLOS value. Designed and developed real-time application can able to detect driver sleepiness with 24 FPS image process-ing speed and 90% real time classification accuracy. Driver sleepiness were able to detect and driver was warned successfully in real time when sleepiness level of driver is achieved the defined threshold values.
Keywords: driver, sleepiness, real time, image processing, machine learning.
INTRODUCTION
According to a report published by the Amer-ican Automobile Association (AAA) Foundation
of Traffic Safety, 41% of drivers are have dosed off or nodded off due to sleepiness while driving. It is also stated that 16.5% of the accidents result -ing in death and injury were caused by tired and
sleepy drivers [1]. Among respondents who fell
asleep, the median prevalence of sleep-related
ac-cidents was 7.0% (13.2% involved hospital care and 3.6% caused fatalities) [14].
According to the results of the study per-formed for commercial vehicle drivers in Edirne
district of Turkey, 22 out of 138 drivers (15.9%)
have experienced or survived a risk of at least one
traffic accident due to sleepiness [20]. According
to the results of a similar study involving Edirne
and Hatay districts, 49 out of 320 drivers (15.3%)
had or survived the risk of at least one accident
due to sleepiness [19]. As a result of a question -naire survey on commercial drivers, it is
conclud-ed that in 17% of drivers having an accident, the accidents were caused by sleepiness [21].
It is envisaged that a system in the vehicles which recognizes sleepiness states of drivers and
warns the driver can significantly reduce the traf
-fic accidents that may occur due to fatigue and sleepiness [5, 7, 11, 13].
In this study, it is aimed to design and imple-ment a system which discerns the sleepiness level of the driver and if sleepiness is detected, recom-mends the driver to stop and rest by a warning system, by using real time image processing tech-niques and machine learning algorithms.
MATERIAL AND METHOD
In this study, real-time camera image data of four volunteers were used to test the driver’s sleep-iness. Camera images are taken from a driving simulation. The driver images taken were reduced
to 320x240 spatial resolution and converted to gray scale with the formula shown in Equation 1.
(1)
In this Equation, Y represents pixel bright-ness, R is red, G is green and B is blue color brightness. Since color information is not used in
the image processing algorithms to be used, only the gray scale image is processed.
The face and eye images of the driver are de-tected and cropped by the Viola-Jones detector method. The Viola-Jones detector is an AdaBoost
classifier that uses Haar-like features. AdaBoost classifiers train T amount of ht weak classifiers
which usually consist of independent and single level binary decision trees. An αt weight value
is given for each classifier. As the input data set,
xi feature vectors labeled with a yi binary tag are
used, each of which is only -1 and +1. Finally, the
class of the xi input is calculated by Equation 2 [3].
(2)
In this equation, H(x) is the class of the x sample, ht is the weak classifier, and αt is the
clas-sifier coefficient. The Sign function returns 1 for all positive values and -1 for all negative values.
Zero values returned as zero. An example show-ing the application of Haar-like features to the
fa-cial image is shown in Figure 1.
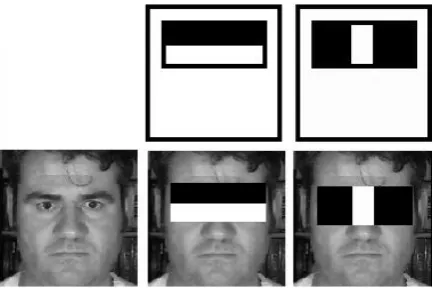
After finding the facial image, the left and
right eye areas were cropped using the geometric ratios of the face and the left and right eye images were simultaneously found in these areas using
parallel tasks [2]. The eye images were combined
to obtain a minimum size image containing both
eyes. 40 Gabor filters were used at eight differ
-ent angles and five differ-ent scales to extract the features of these images. Gabor filters define sine
and cosine functions within a Gaussian window. Two dimensional Gabor wavelets are obtained by using two dimensional forms of these functions. The real (even) and imaginary (odd) components of two-dimensional Gabor wavelets are denoted
by Equation 3 and Equation 4, respectively [4, 8].
Fig. 1. Applying Haar-like features to the a face image
(3)
(4)
In these equations, the ge function is the real (even) component, and the go function is the virtual (odd) component. The Gabor wavelets used to extract the feature in this study are shown in Figure 2.
(5)
In this equation, E is the energy level, x and y are the pixel coordinates, w and h are the image width and height, respectively. The function I(x,y) is the brightness value of the pixel at points x and y.
Four different data sets were obtained by extract
-ing the features of 1077 images of classified open
and closed eyes belonging to four volunteers with 40 Gabor wavelets. In order to improve the real-time
classification performance, the feature selection was
made according to the correlation values and it was
seen that 13 features with the highest correlation out
of 40 features were tested to be sufficient for clas
-sification without lowering the accuracy.
Data sets were tested using five different ma -chine learning algorithms with parametric varia-tions. Weka application was used to test machine
learning algorithms [15]. The accuracies obtained
Fig. 2. Gabor wavelets at eight different angles and five different scales
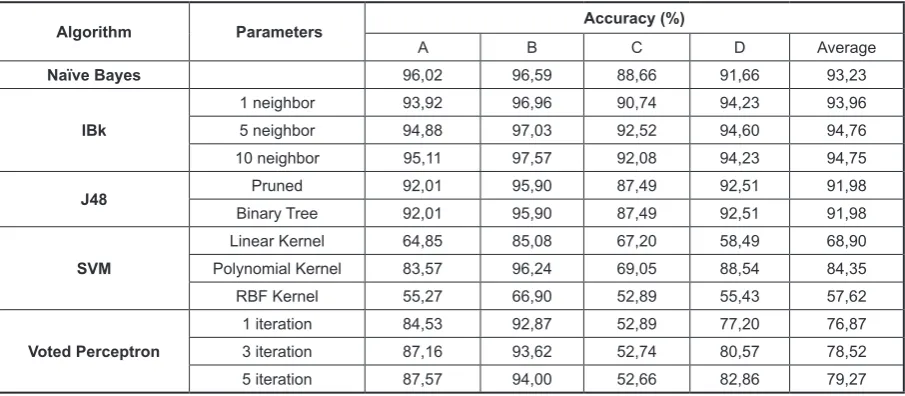
Table 1. Truth values of machine learning algorithms according to data sets
Algorithm Parameters Accuracy (%)
A B C D Average
Naïve Bayes 96,02 96,59 88,66 91,66 93,23
IBk
1 neighbor 93,92 96,96 90,74 94,23 93,96 5 neighbor 94,88 97,03 92,52 94,60 94,76 10 neighbor 95,11 97,57 92,08 94,23 94,75
J48 Pruned 92,01 95,90 87,49 92,51 91,98
Binary Tree 92,01 95,90 87,49 92,51 91,98
SVM
Linear Kernel 64,85 85,08 67,20 58,49 68,90 Polynomial Kernel 83,57 96,24 69,05 88,54 84,35 RBF Kernel 55,27 66,90 52,89 55,43 57,62
Voted Perceptron
1 iteration 84,53 92,87 52,89 77,20 76,87 3 iteration 87,16 93,62 52,74 80,57 78,52 5 iteration 87,57 94,00 52,66 82,86 79,27
for each data set from the test are shown in Table
1. In the Table, the highest two values for each
column are written in bold.
When the accuracies of the machine learning algorithms are examined, it is observed that the nearest neighbor IBk algorithm gives the highest
accuracy in all data sets. However, classification
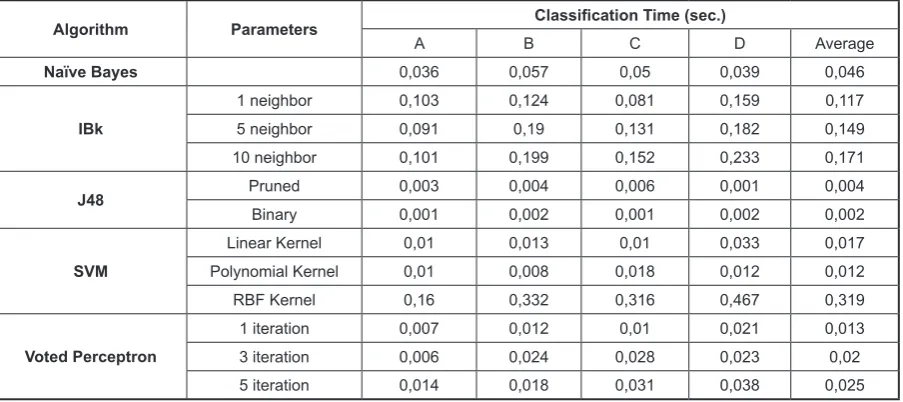
speeds have also been evaluated to see if the al-gorithms are suitable for real-time operation. The
classification speeds obtained are shown in sec -onds in Table 2. In this table, the lowest two val-ues for each column are written in bold.
According to classification speeds, the fastest classifier seems to be the J48 decision tree. The classification speed of the IBk algorithm, which
gives the highest accuracy value at 94.76%, is an
average of 147 milliseconds. The decision tree J48 algorithm has an average classification speed of 3 milliseconds with an accuracy of 91.98%.
The total duration of the spontaneous closing and opening phases of the human eyelid is
ap-proximately 334 milliseconds [23]. The classifi -cation speed of the IBk algorithm is almost half the speed of the blink time. However, the J48 de-cision tree has more than enough speed to catch an eye blink easily. For this reason, we concluded that the J48 algorithm, which is 2.78% lower in
accuracy, is suitable for real-time classification.
A real-time software has been developed for detection of driver drowsiness using personal data.
This software classifies the eyes as open or closed
measurements made over a period of one minute. When the data in the array is complete, the PER-CLOS (Percentage of Closure) value is calculated using the formula shown in Equation 6.
(6)
In this equation, N is the number of samples, S
is the sequence in which eye states are recorded. 1 is recorded for the open eye and -1 for the closed eye
on the status array. The PERCLOS value is used for the two-level warnings. The PERCLOS threshold
values for the warning levels are shown in Table 3.
Within one minute period, if the PERCLOS
value is equal or greater than 0.15, the driver is warned with the first level warning; if the PER
-CLOS value is equal or greater than 0.3, the driv -er is warned by the second level warning. In ad-dition, when it is detected that the eyes are closed for two seconds consecutively (CLOSDUR ≥ 2), the driver is warned by the second level alarm
regardless of the PERCLOS value [12, 18]. The flow chart showing the decision process used
for the warnings and driver warning messages is
shown in Figure 3.
RESULTS AND CONCLUSION
In this study, the real-time video images of the driver are cropped with the Viola-Jones by detecting face and eye images. Cropped eye
im-ages are classified as open or closed with machine
learning algorithms. The values of PERCLOS and CLOSDUR which show the closure ratio of the eyes within period and closed eye duration values are calculated. If the PERCLOS value is equal or
greater than the threshold value 0.15, the driver is warned with the 1st level warning, if the value is equal or greater than the 0.3 threshold value, the
driver is warned by the 2nd level warning. If the CLOSDUR value is 2 seconds or more, the driver is also warned by the 2nd level warning.
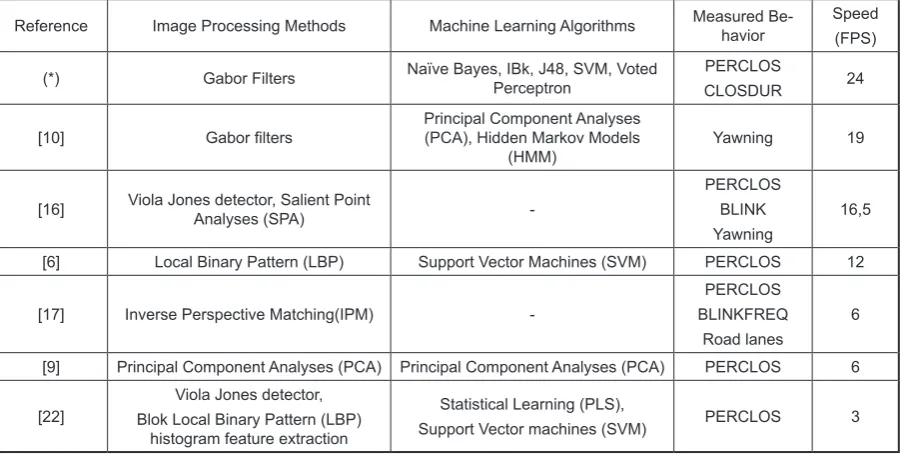
In real-time study tests, eye classification and
drowsiness detection rate was measured as 24 FPS (Frame per Second). This operating speed is considerably higher than the speeds of the studies often referred to as real-time. Table 4 compares the FPS type operating speeds with similar stud-ies that perceive driver drowsiness through image processing. The data in the table is sorted from high to law according to the FPS value.
According to the comparison result, it is seen that the operation speed obtained in this study is well above the real time operation speeds report-ed in similar studies.
A video image composed of 3477 frames re -corded with various drowsiness levels in order to
Table 2. Classification times in seconds of machine learning algorithms according to data sets
Algorithm Parameters Classification Time (sec.)
A B C D Average
Naïve Bayes 0,036 0,057 0,05 0,039 0,046
IBk
1 neighbor 0,103 0,124 0,081 0,159 0,117 5 neighbor 0,091 0,19 0,131 0,182 0,149 10 neighbor 0,101 0,199 0,152 0,233 0,171
J48 Pruned 0,003 0,004 0,006 0,001 0,004
Binary 0,001 0,002 0,001 0,002 0,002
SVM
Linear Kernel 0,01 0,013 0,01 0,033 0,017 Polynomial Kernel 0,01 0,008 0,018 0,012 0,012 RBF Kernel 0,16 0,332 0,316 0,467 0,319
Voted Perceptron
1 iteration 0,007 0,012 0,01 0,021 0,013 3 iteration 0,006 0,024 0,028 0,023 0,02 5 iteration 0,014 0,018 0,031 0,038 0,025
Table 3. PERCLOS threshold values used for the warning the driver
PERCLOS Status of Driver Warning Level 0,0 – 0,15 Attentive No warning
0,15 – 0,30 Un-attentive 1. level warning, rest recommended
Fig. 3. Flow chart for the two-level driver warning system
Table 4. Comparing speed of application developed in this study with other similar studies
Reference Image Processing Methods Machine Learning Algorithms Measured Be-havior Speed (FPS)
(*) Gabor Filters Naïve Bayes, IBk, J48, SVM, Voted Perceptron PERCLOS
CLOSDUR 24
[10] Gabor filters Principal Component Analyses (PCA), Hidden Markov Models
(HMM) Yawning 19
[16] Viola Jones detector, Salient Point Analyses (SPA)
-PERCLOS BLINK Yawning
16,5
[6] Local Binary Pattern (LBP) Support Vector Machines (SVM) PERCLOS 12
[17] Inverse Perspective Matching(IPM)
-PERCLOS BLINKFREQ
Road lanes
6
[9] Principal Component Analyses (PCA) Principal Component Analyses (PCA) PERCLOS 6
[22] Blok Local Binary Pattern (LBP) Viola Jones detector, histogram feature extraction
Statistical Learning (PLS),
test the classification accuracy. For testing pur
-poses, classified images were saved for counting the true and false classifications. The images clas
-sified during the test were visually inspected and
the confusion matrix shown in Table 5 is obtained. The performance results obtained from this confusion matrix are calculated as below: Accu-racy: 0.90 TP rate: 0.89 FP rate: 0.06 Precision:
0.97 Recall: 0.89 Sensitivity: 0.89 Specificity: 0.94 F-Measure: 0.93
The accuracy obtained in real time operation is close to the accuracy value obtained from the data sets and the machine learning algorithms, but is slightly lower in accuracy value. Due to the
different image conditions, a certain amount de -crease of accuracy is common.
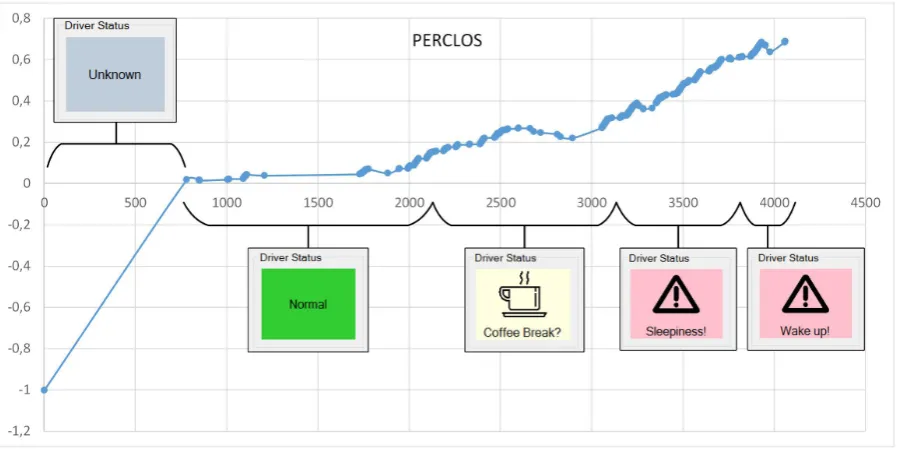
Alert points were marked by testing the driv-er warnings from the same video image on which
the classification was tested. The moments that
the driver is warned are shown in Figure 4.
In this video, the driver’s status is unknown
for the first minute during the completion of the
data in the array where the eye information is stored. The sleepiness state of the driver is indi-cated as normal and no warning is given until the
2113rd frame, until when the PERCLOS value does not exceed the threshold of 0.15. In between 2113rd to 3076th frames, the PERCLOS value has risen above 0.15, and the first level warning
with a message suggesting that the driver take a
break has been shown. After 3076th frame, due to
increase in sleepiness, the PERCLOS value
ex-ceeded the threshold level of 0.3 and the driver
was warned by the second level warning.
Along with the increase in the level of sleepi-ness, it has been observed that the duration of eye
closing also increased. From the 3901st frame
the CLOSDUR value has exceeded the threshold level of two, so that the eyes remaining closed for two seconds is determined and the driver is warned again with the second level warning.
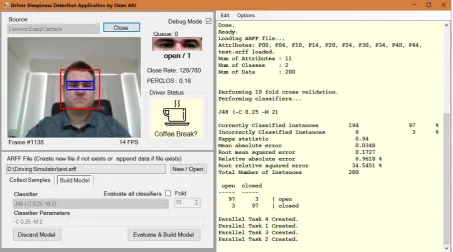
As a result of the aim of operation of the ap-plication developed in consequence of this test, through this software developed by using the im-age processing techniques and machine learning algorithms in order to detect the driver’s drowsi-ness and to warn the driver, driver’s drowsidrowsi-ness was detected in real time at 24 FPS speed and
90% classification accuracy and the driver was
warned. A screen capture of user interface of the developed application is shown in Figure 5.
Table 5. Confusion matrix obtained in the real-time operation test
Classified Eyes
Open Closed
Real State
Open 2271
(TP)
279 (FN)
Closed 60
(FP)
867 (TN)
REFERENCES
1. Association A.A. Asleep at the wheel: The preva-lence and impact of drowsy driving. Professional Safety, 56(1), 2011, 12-12.
2. Bozkir M. G., Karakas P., and Oguz Ö. Vertical and horizontal neoclassical facial canons in turkish young adults. Surgical and Radiologic Anatomy, 26(3), 2004, 212-219.
3. Bradski G. and Kaehler A. Learning opencv: Com-puter vision with the opencv library. “ O’Reilly Media, Inc.”, 2008.
4. Chao W.L. Gabor wavelet transform and its appli-cation. R98942073 (TFA&WT final project), 2010. 5. Cyganek B. and Gruszczyński S. Hybrid computer
vision system for drivers’ eye recognition and fatigue monitoring. Neurocomputing, 126, 2014, 78-94. 6. Dasgupta A., et al. An on-board vision based
system for drowsiness detection in automotive drivers. International Journal of Advances in En-gineering Sciences and Applied Mathematics, 5(2-3), 2013, 94-103.
7. Daza I. G., et al. Fusion of optimized indicators from advanced driver assistance systems (adas) for driver drowsiness detection. Sensors, 14(1), 2014, 1106-31.
8. Derpanis K.G. Gabor filters. York University, 2007. 9. Dhar S., et al. Implementation of real time visual
attention monitoring algorithm of human drivers on an embedded platform. Proceedings of the 2010 IEEE Students’ Technology Symposium, 2010.
10. Fan X., et al. Gabor-based dynamic representation for human fatigue monitoring in facial image sequences. Pattern Recognition Letters, 31(3), 2010, 234-243. 11. Forsman P., et al. Feasibility of force platform based
roadside drowsiness screening - a pilot study. Acci-dent analysis and prevention, 62, 2014, 186-90. 12. Gang L. and Wan-Young C. Detection of driver
drowsiness using wavelet analysis of heart rate variability and a support vector machine classifier. Sensors, 13(12), 2013, 16494-16511.
13. Garces Correa A., Orosco L., and Laciar E. Auto-matic detection of drowsiness in eeg records based on multimodal analysis. Medical engineering & physics, 36(2), 2014, 244-9.
14. Gonçalves M., et al. Sleepiness at the wheel across europe: A survey of 19 countries. Journal of Sleep Research, 24(3), 2015, 242-253.
15. Hall M., et al. The weka data mining software: An update. ACM SIGKDD explorations newsletter, 11(1), 2009, 10-18.
16. Jimenez-Pinto J. and Torres-Torriti M. Face salient points and eyes tracking for robust drowsiness de-tection. Robotica, 30, 2012, 731-741.
17. Li X. P., Seignez E., and Loonis P. Driver drowsi-ness estimation by fusion of lane and eye features using a multilevel evidence theory. International Conference on Cyber Technology in Automation, Control & Intelligent Systems, 2013, 411.
18. Miguel T.T. and Javier J.P. Optical flow and driv -er’s kinematics analysis for state of alert sensing. Sensors, 13(4), 2013, 4225-4257.
19. Özer C., Etcibaşı Ş., and Öztürk L. Daytime sleepi -ness and sleep habits as risk factors of traffic acci -dents in a group of turkish public transport drivers. International journal of clinical and experimental medicine, 7(1), 2014, 268-73.
20. Öztürk L., Pelin Z., and Özer C. Sürücülerde ep -worth uykuluk skoru ile geçirilmiş ya da atlatılan trafik kazası sayısı arasındaki İlişki. 6. Ulusal Uyku ve Bozuklukları Kongresi, 2004.
21. Öztürk L., Tufan Y., and Güler F. Self-reported traffic accidents and sleepiness in a professional
group of turkish drivers. Sleep and Hypnosis, 4(3), 2002, 106-110.
22. Selvakumar K., et al. Real-time vision based driver drowsiness detection using partial least squares analysis. Journal of Signal Processing Systems, 85(2), 2016, 263-274.