Using Eye Movement Analysis to Study Auditory Effects on
Visual Memory Recall
Ramtin Zargari Marandi 1*, Seyed Hojjat Sabzpoushan 1
1. Department of Biomedical Engineering, Iran University of Science and Technology, Narmak, Tehran, Iran.
* Corresponding Author: Ramtin Zargari Marandi, Ph.D.
Department of Biomedical Engineering, Iran University of Science and Technology, Narmak, Tehran, Iran E-mail: [email protected]
Recent studies in affective computing are focused on sensing human cognitive context using biosignals. In this study, electrooculography (EOG) was utilized to investigate memory recall accessibility via eye movement patterns. 12 subjects were participated in our experiment wherein pictures from four categories were presented. Each category contained nine pictures of which three were presented twice and the rest were presented once only. Each picture presentation took five seconds with an adjoining three seconds interval. Similarly, this task was performed with new pictures together with related sounds. The task was free viewing and participants were not informed about the task’s purpose. Using pattern recognition techniques, participants’ EOG signals in response to repeated and non-repeated pictures were classified for with and without sound stages. The method was validated with eight different participants. Recognition rate in “with sound” stage was significantly reduced as compared with “without sound” stage. The result demonstrated that the familiarity of visual-auditory stimuli can be detected from EOG signals and the auditory input potentially improves the visual recall process.
A B S T R A C T
Article info:Received: 01 May 2013
First Revision: 15 June 2013
Accepted: 29 August 2013
Key Words:
Memory Recall, Eye Movement Analysis, Cognitive Context, Auditory effect,
Electrooculography (EOG).
1. Introduction
onsiderable advances in sensing, infer-ring, and using context information were achieved by investigating different dimen-sions of context, such as physical activity (Davies et al., 2008), location (Want et al., 1992), or the psychophysiological and affective state of studied subjects (Healey et al., 2010). Cognitive context of a person lies beyond these common contextual dimen-sions not necessarily providing a complete background context of a person. Based on the insights from the ex-perimental psychology, the cognitive context comprises almost all aspects of mental processing, such as percep-tion, memory, knowledge, and learning (Bulling & Rog-gen, 2011).
C
nitive context assessment in an unobtrusive manner. This Recent context-aware systems have a long way to cog-is due to the fact that the cognitive context cog-is encoded in complex neural dynamics inside the brain and few ob-vious cues are accessible by non-invasive measurement techniques (Bulling & Roggen, 2011). Cognitive neuro-science uses techniques such as functional magnetic res-onance imaging (fMRI), (Chadwick et al., 2010) that are not suited for real-world applications. More potentially useful techniques investigating the cognitive context, such as electroencephalography EEG, (Bigdely-Shamlo et al., 2008), are not unobtrusive and robust enough for daily life setting applications.as attention (Liversedge & Findlay, 2000), memory (Hannula & Ranganath, 2009), learning (Heisz & Shore, 2008), or saliency determination (Henderson, 2003). Moreover, a firm relationship between eye movements and cognition makes eye movements a particularly prom-ising source of information on the cognitive context of a person, beyond the mere physical or visual activities.
A scenario to gain a good perspective on eye-based cognition-awareness was given by Bulling & Roggen, 2011, where attendees of a business reception wear eye trackers that are unobtrusively embedded into their gog-gles. By analyzing their eye movement patterns during conversations, cognition-aware memory assistants run-ning on their mobile phones assess whether the involved speakers have met before and still remember each other. Using this information, the systems then automatically provided real-time memory assistance about people fall-en into oblivion to prevfall-ent the embarrassing situations.
Eye movement research is of great interest in neurosci-ence and psychiatry studies, as well as ergonomics, ad-vertising and design as a window into observers’ visual and cognitive processes. For instance, researchers have utilized eye tracking to study behavior in such domains as image scanning e.g. (Noton & Stark, 1971), driving (Land & Lee, 1994), arithmetic (Suppes, 1990), anal-ogy (Salvucci & Anderson, 2001), and reading (Rayner, 1998). In these domains as well as others, researchers typically analyze eye movements in terms of fixations (pauses over informative regions of interest) and sac-cades (rapid movements between fixations).
Many researchers have started to study eye movements in natural environments in order to better understand the role which the visual system plays in the execution of everyday tasks (Hayhoe & Ballard, 2005). Human vision research has shown that unconscious eye movements are strongly related to the underlying cognitive and percep-tive processes. For example, it has been shown that vi-sual behavior is a good measure of vivi-sual engagement (Skotte et al., 2007), drowsiness (Schleicher et al. 2008), and cognitive load (Stuyven et al., 2000). Heisz et al. investigated changes in eye movement behavior across several exposures to face images (Heisz & Shore, 2008). They found that once a face becames more familiar, ob-servers look longer and more often at the eyes and less often at the nose, mouth or forehead.
Furthermore, it has been demonstrated that differences in eye movement patterns are linked to a number of men-tal disorders. Given this, eye tracking has been used to diagnose autism spectrum disorders (Boraston &
Blake-more, 2007). For instance, Klin et al. showed that people with autism tend to show fewer fixations to the eyes but more to the mouth (Klin et al., 2002). Similar links were found for schizophrenia (Ettinger et al., 2006) as well as Parkinson’s (Mosimann et al. 2005) and Alzheimer’s disease (Crawford et al., 2005).
All these studies suggest a close relationship between the visual behavior and cognition. These findings under -line the potential of eye movement analysis for cognitive context assessment. However no attempts were done to detect familiarity from the eye movements whether for example a particular face, was previously seen and re-membered. Along these lines, the emerging novel tech-nologies which enable research on human behavior dur-ing complex cognitive processes like memory recall is drawing much more attentions nowadays.
2. Methods
An experimental paradigm was used to the study deci-sion making process. the experiment conducted during this study comprised visual stimuli presentation to par-ticipants while recording their EOG signals. As it shown in Fig.1, the experiment was conducted in a dim-lit, quiet room. For distinct and near to real world eye movements, visual stimuli were presented on a 116×66 cm screen by a video projector. The resolution of presented pictures as visual stimuli was 640×480 pixels. The stimuli were designed and implemented using Adobe Flash software. Participants were instructed on how to do the tasks us-ing the interactive multimedia instructions runnus-ing on a computer before the experiment. Moreover, instructions were also shown to the participants in text format before the task onset. Participants were requested to sit on an armchair and adjust their position such that their eyes were facing the center of the screen. Participant’s dis-tance to the screen was between 160 and 170 cm. The experiment was conducted in Brain-Computer Interface laboratory of Iran Neural Technology Research Centre.
chosen and presented in association with the four picture categories. The sounds were chosen so that to help the memory recall process. Sounds of car passing, seashore, crowd talking and radio messages of spacemen were se-lected for building, landscape, face and abstract pictures, respectively.
2.1. Experiment
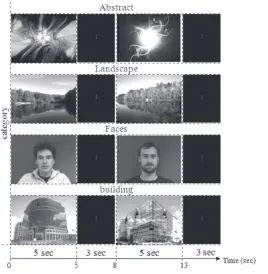
The experiment was performed in two sections. In the first section participants were presented four categories of pictures including faces, landscapes, abstract images and buildings without sound (Fig.2). Each category
con-tained nine pictures. Six pictures of each category were presented once and the remaining three pictures were presented twice. The pictures were presented randomly. As shown in Fig.2, each presentation took five seconds after which a black screen with a dot-shaped down-counter at the center was presented for three seconds. The second section of the experiment immediately fol-lowed the first part. The second part was similar to the first one while the pictures were different and sound-matched. Participant’s task in this experiment was free viewing. They were not informed about the aim of the experiment.
Figure 1. A participant during experiment
2.2. Participants
Fourteen participants (6 females and 8 males) volunteered for this experiment. Two male participants were excluded due to low quality EOG signal that prevented robust detec -tion of eye movements. The remaining participants were 22 to 29 years old (M=25.8, SD=±3.6). All participants had normal or corrected-to-normal vision. Most of the partici-pants were either undergraduate or graduate students from Iran University of Science and Technology.
2.3. Apparatus
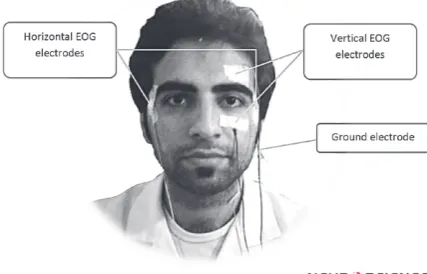
Neurophysiologic signals were recorded and filtered using a Simulink application. For the present study, a g.USBAmp amplifier (g.tec Medical Engineering GmbH, Austria) was used. This device represents a mul -timodal amplifier for electrophysiological signals such as EEG, EOG, EMG and ECG. EOG signals were cap -tured by 5 electrodes placed as in Fig. 3 and were re-corded using a bipolar configuration. For the horizontal EOG (HEOG) the electrodes were placed at the outer canthus of each eye and for the vertical EOG (VEOG) infra-orbital and supra-orbital electrodes were placed in line with the pupil of one eye. Ground electrode was placed on the earlobe. Sampling rate was adjusted to 256 Hz. High-purity gold (Au) electrodes with resistance of lower than 5 kΩ were used in this research.
Figure 3. Configuration of electrodes on a subject’s face for EOG signal acquisition.
2.4. Validation Study
The validation study used the same picture sets and ex-perimental procedure as the main study. In contrast to the main study, no eye movements were recorded from the participants. Instead, participants were asked for real-time feedback on whether or not each picture had been shown before by pressing two buttons on a keyboard. We
collected feedback from eight participants other than those participating in the main study - four male and four female - aged between 21 and 28 years (M = 24.3, SD = ±3.8).
2.5. Eye Movement Analysis
Eye movements can be analyzed using EOG signals. Before signal processing a preprocessing is critical to suppress extra information from EOG signals. Signal processing techniques helps removing unnecessary in-formation such as noise and baseline drift.
2.6. Noise and Baseline Drift Removal
Like other biological signals, EOG signals are often af -fected by noise and baseline drift. Noise in EOG signals may has several sources such as the residential power line, the measurement circuitry, electrodes, and wires, or other interfering physiological sources such as electro-myographic (EMG) signals. To cope with these artifacts, first of all EOG signals were low-pass filtered with cut-off frequency at 30 Hz integrated in the device.
Moreover an additional 50 Hz notch filter was applied to suppress the power line noise. The notch filter was ap -plied using G.tec’s Application Programming Interface (API) for MATLAB. This API contains commands which give full access to the amplifier. There are commands for reading the data, setting the band pass and notch filters, changing the sampling frequency of the amplifier, defin -ing bipolar derivations and calibrat-ing the system.
Baseline drift is a slow signal change superposing the EOG signal but mostly unrelated to eye movements. It has many possible sources such as interfering back-ground signals or electrode polarization. For baseline drift removal, firstly an approximated multilevel 1D wavelet decomposition at level twelve was performed using Daubechies wavelets on each EOG signal com -ponent. The reconstructed decomposition coefficients gave baseline drift estimation. Subtracting this estima-tion from each original signal component yielded the corrected signals with reduced drift offset.
2.7. Saccade Detection
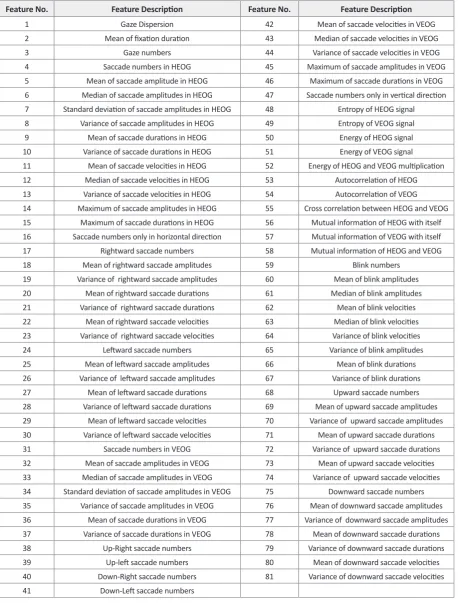
Table 1. Feature descriptions
Feature No. Feature Description Feature No. Feature Description
1 Gaze Dispersion 42 Mean of saccade velocities in VEOG
2 Mean of fixation duration 43 Median of saccade velocities in VEOG
3 Gaze numbers 44 Variance of saccade velocities in VEOG
4 Saccade numbers in HEOG 45 Maximum of saccade amplitudes in VEOG 5 Mean of saccade amplitude in HEOG 46 Maximum of saccade durations in VEOG 6 Median of saccade amplitudes in HEOG 47 Saccade numbers only in vertical direction
7 Standard deviation of saccade amplitudes in HEOG 48 Entropy of HEOG signal
8 Variance of saccade amplitudes in HEOG 49 Entropy of VEOG signal
9 Mean of saccade durations in HEOG 50 Energy of HEOG signal
10 Variance of saccade durations in HEOG 51 Energy of VEOG signal
11 Mean of saccade velocities in HEOG 52 Energy of HEOG and VEOG multiplication
12 Median of saccade velocities in HEOG 53 Autocorrelation of HEOG
13 Variance of saccade velocities in HEOG 54 Autocorrelation of VEOG
14 Maximum of saccade amplitudes in HEOG 55 Cross correlation between HEOG and VEOG
15 Maximum of saccade durations in HEOG 56 Mutual information of HEOG with itself
16 Saccade numbers only in horizontal direction 57 Mutual information of VEOG with itself
17 Rightward saccade numbers 58 Mutual information of HEOG and VEOG
18 Mean of rightward saccade amplitudes 59 Blink numbers
19 Variance of rightward saccade amplitudes 60 Mean of blink amplitudes
20 Mean of rightward saccade durations 61 Median of blink amplitudes
21 Variance of rightward saccade durations 62 Mean of blink velocities
22 Mean of rightward saccade velocities 63 Median of blink velocities
23 Variance of rightward saccade velocities 64 Variance of blink velocities
24 Leftward saccade numbers 65 Variance of blink amplitudes
25 Mean of leftward saccade amplitudes 66 Mean of blink durations
26 Variance of leftward saccade amplitudes 67 Variance of blink durations
27 Mean of leftward saccade durations 68 Upward saccade numbers
28 Variance of leftward saccade durations 69 Mean of upward saccade amplitudes
29 Mean of leftward saccade velocities 70 Variance of upward saccade amplitudes
30 Variance of leftward saccade velocities 71 Mean of upward saccade durations
31 Saccade numbers in VEOG 72 Variance of upward saccade durations
32 Mean of saccade amplitudes in VEOG 73 Mean of upward saccade velocities
33 Median of saccade amplitudes in VEOG 74 Variance of upward saccade velocities
34 Standard deviation of saccade amplitudes in VEOG 75 Downward saccade numbers
35 Variance of saccade amplitudes in VEOG 76 Mean of downward saccade amplitudes
36 Mean of saccade durations in VEOG 77 Variance of downward saccade amplitudes
37 Variance of saccade durations in VEOG 78 Mean of downward saccade durations
38 Up-Right saccade numbers 79 Variance of downward saccade durations
39 Up-left saccade numbers 80 Mean of downward saccade velocities
40 Down-Right saccade numbers 81 Variance of downward saccade velocities
2.8. Fixation Detection
Bulling et al. algorithm for fixation detection exploits the fact that fixation points tend to cluster together close -ly in time. Thus, by thresholding on the dispersion of these points, fixations can be detected (Widdel, 1984). Based on the output of the CWT-SD algorithm, disper-sion and duration values are calculated for each non-saccadic segment. If the dispersion is below a maximum threshold, and the duration above a minimum threshold, a fixation is detected.
2.9. Blink Detection
Blinks appear in vertical EOG signal component in the form of overshoots in signal amplitude. The Continu-ous Wavelet Transform - Blink Detection (CWT-BD) algorithm was used to detect blinks in VEOG. Similar to the algorithm for saccade detection, this algorithm uses thresholding of wavelet coefficients. In contrast to sac -cades, a blink is characterized by a short sequence of two large peaks in the coefficient vector, one positive and the other negative. The time between these peaks is much smaller than for saccades. Thus, blinks are distinguished from saccades by applying a maximum threshold on this time difference.
2.10. Feature Extraction and Selection
The two-class recognition problem of discriminating between pictures that were only seen once (class “non-repeated”) and pictures that were seen twice (class “re-peated”) by the participants were considered. After the removal of all eye movement data which belonged to the intervals, all picture instances (picture and correspond-ing eye movement data) of all scorrespond-ingle exposures to the “non-repeated” class, and picture instances of two times exposures were assigned to the “repeated” class.
Feature extraction was run on all picture instances. 81 features were extracted of which most having statistical features of saccades, blinks and fixations (see Table 1). The features were calculated on both HEOG and VEOG.
For feature selection a filter scheme over the commonly used wrapper approaches was used because of the lower computational costs and thus shorter runtime. Minimum redundancy maximum relevance algorithm (Peng et al., 2005) for feature selection was used in this work. The mRMR algorithm selects a feature subset of arbitrary size S best characterizing the statistical properties of the given target classes based on the ground truth.
2.11. Classification and Performance Evaluation
A support vector machine (SVM) with a linear kernel was used for classification. All parameters of the sac -cade, fixation, and blink detection algorithms were fixed to values common to all participants. For evaluation, a leave-one-person-out scheme was followed, by which the datasets of all but one participant were combined and used for training (the “training set”). The dataset of the remaining participant was used for testing (the “test set”). This was repeated for each participant. Feature se-lection was performed solely on the training set.
3. Results
3.1. Results for Each Picture Category
On average, participants from the validation study were able to correctly identify pictures that had previously been shown with an accuracy of 76.3% for the first part of the experiment. This accuracy was 91.1% for sound-matched pictures during the second part of the experi-ment. Given the above high accuracy, in the following analysis it could be assumed that participants in the main study perfectly remembered most of the pictures which were already presented.
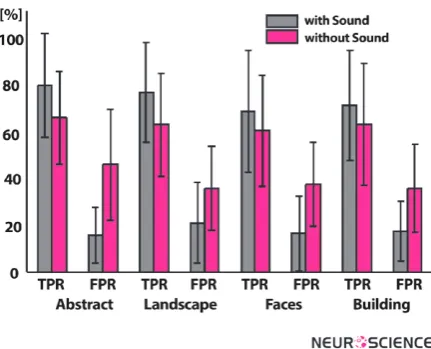
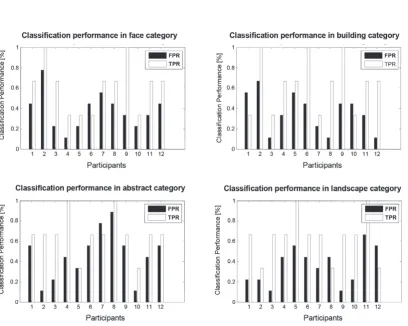
Based on the data recorded in the main study, Figure 4 summarizes the overall recognition performance us-ing person-independent parameters and trainus-ing for each picture category and each part of the experiment includ-ing picture presentation with and without sounds. The bars contrast true positive rate (TPR) to false positive rate (FPR). Figure 4 demonstrates a considerable
provement in recognition performance for the second part of the experiment where pictures presented with their related sounds compared with the first part of the experiment wherein pictures were presented without sound. This improvement is re-demonstrated through ROC space in figure 5. Recognition performance reduc -es if the points in ROC spac-es of figure 5 get closer to the up-left side.
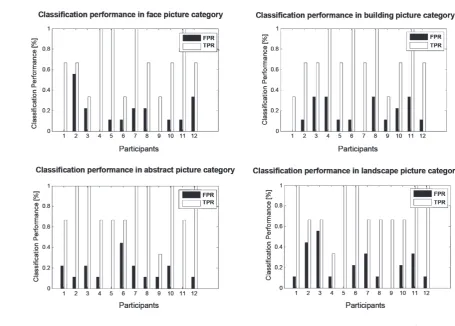
Figure 6 and 7 show the range of differences in rec-ognition performance for each individual participant respectively from the first to the second part of the ex -periment. A comparison between figure 6 and 7 shows considerable reductions and decrease respectively in TPR and FPR for most of the participants in the four pic-ture categories. These improvements are due to the audi-tory effect addition in the second part of the experiment. Figure 5. Recognition performance improvement in
partici-pants from the first part of the experiment that pictures were presented without sound (blue crosses) to the second part wherein pictures were presented with their related sound (red circles).
Figure 7. Classification performance of repeated and non-repeated pictures with sound in the four categories for all of the subjects
3.2. Further Analysis of the Faces Picture Category
Based on the cognition-aware memory assistant con-cept outlined in the introduction and the insights from the experiments done by Bulling and Roggen in 2011, the results for the faces picture category was analyzed in more detail.
3.3. Top discriminative EOG Features
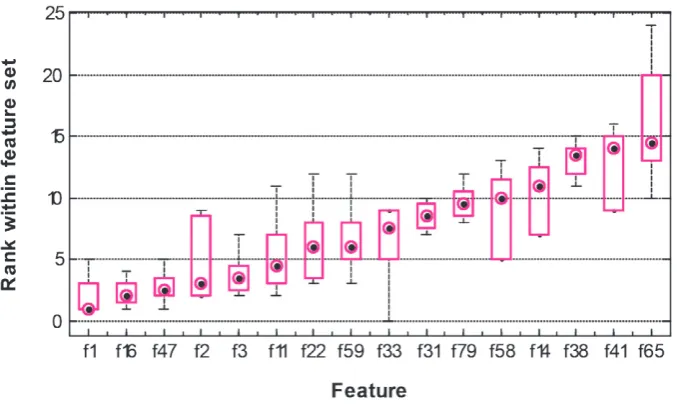
Feature rankings using mRMR was analyzed on each of the twelve leave-one-person-out training sets for the faces category. The rank of a feature is the position at which mRMR selected it within a set. The position cor-responds to the importance through which mRMR as-sesses a feature’s ability to discriminate between classes in combination with the features already selected. Fig-ures 8 and 9 show the top 16 featFig-ures according to the median rank over all sets (see table 1 for features’ de-scription). For each feature, the vertical bar represents the spread of mRMR ranks for the twelve training sets. The most useful features are those found with the high-est rank (close to one) for most training sets as indicated by shorter bars. As illustrated in figures 8 and 9, the top
discriminative features are mostly common for the two parts of the experiment.
4. Conclusion
Our findings indicated that adding auditory informa -tion improves discrimina-tion between familiar and un-familiar pictures in participants. Moreover, this auditory effect leaves an impact on EOG signal patterns so that to make reduction in recognition performance.
5. Discussion
Recognizing human cognitive-context from biosignals would be so promising in pervasive computing. The findings of this study were in line with those by Bulling & Roggen, 2011 on memory assistant realization. How-ever, utilizing a near-real world set up to achieve a robust and reliable memory assistant system is required to ad-dress remaining challenges.
labora-tory settings, these influences can be minimized by using a constrained experimental setup and well-defined visual stimuli. Meanwhile, the everyday settings can typically not be controlled in a similar fashion. It is therefore cru-cial to identify and separate these different sources of influence for robust recognition of visual memory recall and other cognitive processes. This problem could be addressed by using a multi-modal approach for context
recognition and annotation that incorporates additional modalities to eye tracking, such as proximity sensors, GPS for localization, inertial measurement units for head movements, or eye contact sensors (Dickie et al., 2004).
This leads to a second challenge. Personal encounters in daily life differ considerably from the situation inves-tigated here. In these settings, facial expressions of con-Figure 8. Top 16 eye movement features selected by mRMR for all twelve training sets for the
faces picture category. X-axis shows feature numbers and groups; the key on the right shows the corresponding feature names as described in Table 1; Y-axis shows the rank.
versational partners change continuously, the viewpoint is dynamic, and other visual stimuli may attract attention and lead to “random” saccades to other entities in the surrounding environment. In addition, personal encoun-ters may range from longer face-to-face discussions be-tween two people, over glances to faces of others while in transit, to looking at several faces of a group of people in succession. This will require advanced methods for robust detection of when and how people look at each other’s face. One possible solution to this problem is to augment the analysis of eye movement dynamics – as presented here - with a computer vision system for face detection and a wearable gaze tracker to identify the points while a subjects lookes at a face (Bulling & Rog-gen, 2011).
In the current experiment, participants were asked to to look at a large screen during which distinct eye move-ments were provoked and could easily be measured us-ing EOG. It remains to be investigated whether current wearable eye trackers - whether EOG- or video-based - are accurate enough to capture eye movement charac-teristics which reflect visual memory recall processes on smaller screens (e.g. on a mobile phone) or with the per-son being in transit (Bulling & Roggen, 2011).
It has been reported that someparticipants may feel bored or tired during such experiments (Bulling & Rog-gen, 2011). To address this problem we reduced the du-ration of picture presentation and the number of present-ed pictures in comparison to an earlier publishpresent-ed report (Bulling & Roggen, 2011) thus, none of the participants reported that they get bored during the experiment. An-other possible advantage of such modification was get -ting closer to real world situation.
Such findings may also open up new approaches to design lie detection systems. EOG signals in combina -tion with other biosignals would make reliable evidences for these systems. Due to the unobtrusive nature of wired biosignal acquisition systems, the application of cogni-tion-aware system using biosignals may be seen quite feasible in this field.
Acknowledgment
The authors would like to thank the Research Labo-ratory of Biomedical Signals and Sensors and the Iran Neural Technology Research Center of Iran University of Science and Technology for providing the EOG signal acquisition system used in this research.
References
Noton, D., & Stark, L. (1971). Scanpaths in saccadic eye move-ments while viewing and recognizing patterns. Vision re-search, 11(9), 929-IN8.
Land, M. F., & Lee, D. N. (1994). Where do we look when we steer. Nature.
Suppes, P. (1990). Eye-movement models for arithmetic and reading performance. Eye movements and their role in visu-al and cognitive processes, 4, 455-477.
Salvucci, D. D., & Anderson, J. R. (2001). Integrating analogical mapping and general problem solving: The path-mapping theory. Cognitive Science, 25(1), 67-110.
Rayner, K. (1998). Eye movements in reading and informa-tion processing: 20 years of research. Psychological bulletin, 124(3), 372.
Bulling, A., Ward, J. A., Gellersen, H., & Troster, G. (2011). Eye movement analysis for activity recognition using electroocu-lography. Pattern Analysis and Machine Intelligence, IEEE Transactions on, 33(4), 741-753.
Bulling, A., & Roggen, D. (2011, September). Recognition of visual memory recall processes using eye movement analy-sis. In Proceedings of the 13th international conference on Ubiquitous computing (UbiComp'11) (pp. 455-464).
Bigdely-Shamlo, N., Vankov, A., Ramirez, R. R., & Makeig, S. (2008). Brain activity-based image classification from rapid serial visual presentation. Neural Systems and Rehabilitation Engineering, IEEE Transactions on, 16(5), 432-441.
Boraston, Z., & Blakemore, S. J. (2007). The application of eye‐ tracking technology in the study of autism. The Journal of Physiology, 581(3), 893-898.
Duchowski, A. T. (2007). Eye tracking methodology: Theory and practice (Vol. 373). Springer.
Chadwick, M. J., Hassabis, D., Weiskopf, N., & Maguire, E. A. (2010). Decoding individual episodic memory traces in the human hippocampus. Current Biology, 20(6), 544-547.
Crawford, T. J., Higham, S., Renvoize, T., Patel, J., Dale, M., Suriya, A., & Tetley, S. (2005). Inhibitory control of saccadic eye movements and cognitive impairment in Alzheimer’s disease. Biological psychiatry, 57(9), 1052-1060.
Davies, N., Siewiorek, D. P., & Sukthankar, R. (2008). Activity-based computing. Pervasive Computing, IEEE, 7(2), 20-21.
Widdel, H. (1984). Theoretical and Applied Aspects of Eye Movement Research, chapter Operational problems in ana-lysing eye movements, 22–29.
Ettinger, U., Picchioni, M., Hall, M. H., Schulze, K., Toulopou-lou, T., Landau, S., ... & Murray, R. M. (2006). Antisaccade performance in monozygotic twins discordant for schizo-phrenia: the Maudsley twin study. American Journal of Psy-chiatry, 163(3), 543-545.
Hannula, D. E., & Ranganath, C. (2009). The eyes have it: hip-pocampal activity predicts expression of memory in eye movements. Neuron, 63(5), 592.
Healey, J., Nachman, L., Subramanian, S., Shahabdeen, J., & Morris, M. (2010). Out of the lab and into the fray: Towards modeling emotion in everyday life. In Pervasive Computing (pp. 156-173). Springer Berlin Heidelberg.
Heisz, J. J., & Shore, D. I. (2008). More efficient scanning for familiar faces. Journal of Vision, 8(1).
Henderson, J. M. (2003). Human gaze control during real-world scene perception. Trends in cognitive sciences, 7(11), 498-504.
Klin, A., Jones, W., Schultz, R., Volkmar, F., & Cohen, D. (2002). Visual fixation patterns during viewing of naturalistic social situations as predictors of social competence in indi-viduals with autism. Archives of general psychiatry, 59(9), 809.
Liversedge, S. P., & Findlay, J. M. (2000). Saccadic eye move-ments and cognition. Trends in cognitive sciences, 4(1), 6-14.
Mosimann, U. P., Müri, R. M., Burn, D. J., Felblinger, J., O'Brien, J. T., & McKeith, I. G. (2005). Saccadic eye movement changes in Parkinson's disease dementia and dementia with Lewy bodies. Brain, 128(6), 1267-1276.
Schleicher, R., Galley, N., Briest, S., & Galley, L. (2008). Blinks and saccades as indicators of fatigue in sleepiness warnings: looking tired?. Ergonomics, 51(7), 982-1010.
Skotte, J. H., Nøjgaard, J. K., Jørgensen, L. V., Christensen, K. B., & Sjøgaard, G. (2007). Eye blink frequency during differ-ent computer tasks quantified by electrooculography. Euro-pean journal of applied physiology, 99(2), 113-119.
Stuyven, E., Van der Goten, K., Vandierendonck, A., Claeys, K., & Crevits, L. (2000). The effect of cognitive load on sac-cadic eye movements. Acta psychologica, 104(1), 69-85.
Want, R., Hopper, A., Falcão, V., & Gibbons, J. (1992). The ac-tive badge location system. ACM Transactions on Informa-tion Systems (TOIS), 10(1), 91-102.
Peng, H., Long, F., & Ding, C. (2005). Feature selection based on mutual information criteria of max-dependency, max-rel-evance, and min-redundancy. Pattern Analysis and Machine Intelligence, IEEE Transactions on, 27(8), 1226-1238.
Stegmann, M. B., Ersboll, B. K., & Larsen, R. (2003). FAME-a flexible appearance modeling environment. Medical Imag-ing, IEEE Transactions on, 22(10), 1319-1331.