TECHNOLOGY DEVELOPMENT IN WATER
RESOURCE MANAGEMENT
Daniel J. Epstein
Larry E. Brazil
Gerald N. Day
Riverside Technology, inc.
ABSTRACT
In developed nations, technological adva ncem ents rap idly are changing every aspect of our lives: how we work, how we com munic ate with e ach o ther, and even how we are entertained. The influence of techno logy is rea dily app arent. The su btleties of technology an d its less apparent influence s also are trem endous. A dvances in computer technology, communications, and manufacturing are affecting all sectors, including engineering. In the arena of water resources, technological advances have helped to not only develop a better understanding of our physical systems but have allowed improved operational and institutional tools to be developed to support water managem ent. These ad vanc es hav e the p otentia l to provide large and meaningful benefits to less developed infrastructures.
The objective of this paper will be to describe several technological advances in water resou rces, sp ecifically in areas such as Flood W arning, Water Administration, and M ulti-Objective Water Management. Examples of technologies implemented which have direct app licability to developing infrastructures are d escrib ed. Imp ortan t to the discussion of these advances are the ways in which implementation and use of these technologies can protect and save live s, extend and o ptima lly use limited resources, and provide u seful inform ation to assist in the sustainab le growth and develop ment of our natural resources. FLOOD WARNING
In developed countries flood w arning and h ydro logic forecasting are integral activities of water and meteorological agencies, often within the jurisdiction of federal agenc ies. Da ta collection, m eteor olog ical ana lysis and forecasting, and hydrologic analysis and forecasting can offer information to emergency manage rs and civil defense agencies to provide lead time for emergency response and potentially even evacuation. The goals of such program s are to protect lives, p rop erty, and mitigate disaster. Most flood warning or forecasting programs typically contain a fundamental set of components, all of
which are essential to effective disaster mitigation. The se components include:
• Automatic Data Collection Networks • Da ta Pro cessing and A nalysis
• M eteorological and Hydrologic Forecasting (short-term and long-(short-term)
• Information Dissemination
The techno logy ad vanc es in data collection systems have greatly impro ved water m anag ers' ability to get bo th real-time and h istorical data and a nalysis auto matica lly. Data collection platforms (DCPs) are now affordable; can be placed in remo te loca tions with minimal maintenance; and provide the co mmunicatio ns cap ability either through dedicated phone lines, wirele ss pho ne, rad io freq uenc y, or even satellite pr otoc ols t o p r o v id e n e c essary climatological and hydrologic data to support warning, opera tions, and planning. Additional data sources include radar and satellite imagery. Data collection networks are integral to successful flood warning and forecasting and are typically the first component of a developing system. On the ba ck end of warn ing system s, the req uirem ents for information dissemination vary widely depending upon objectives of the flood forecasting or warning system, the size of the system, the available technology, and the needed lead times. Examples of information communication systems include a simple messaging from an ALE R T protocol d ata co llection sys tem wh ich co uld auto matica lly page or call an emergency manager when some warning threshold (precipitation depth over some duration might be an example) has been exceeded in the data collection network or as complicated as a hierarchy of warning from responsible agencies to m edia a nd civ il defense programs. The procedures and communication chan nels are often desc ribed in em ergency resp onse plans develop ed at regiona l and local scales.
58 indication of future hydro logic co ndition s. Her e we w ill examine two types of systems: short-term flash flood forecasting techno logy often applied in smaller basins where response times are short and personnel resources for operational support are minimal; and a more comprehensive system targeted at larger basins where the objectives are more comp licated, the timescales longer, and the institutional a nd infra structure requ ireme nts greater.
The objective of flash flood fore casting sys tems is typically to provide near re al-time forecas ts in areas of fast response. Data processing and tim e-step intervals may be on the order of minutes. Forecast horizons may be on the order of hours. App lications must integ rate with real-time data sources such as ALERT networks or radars and provide automated processing. The systems must often run stand-alone with little or no human intervention. An exam ple of such a system can be found in FLOOD W atch™ , a PC -based hyd rologic fore casting to ol that simulates the hydrologic response of a watershed as function of precipitation input. FLOOD W atch™ employs a variety of models to represent the physical processes controlling water movement. A state-space implementation of the Sacr ame nto m ode l is used to estimate runoff continuously by modeling the soil moisture water balance. The state-space implementation provides an efficient set of algorithms for real-time computation and has been extended to support real-time updating of model states based on streamflow observations. The Kalman filtering upda ting technique used with the Sacramento mod el pro vides an ob jective and a utom atic method to ensure that the model states stay on track. FLOOD Watch™ is typically used in conjunction with a databa se which is populated by a real-time data collection system. Eac h time the datab ase is up dated with new data, FLOOD W atch™ initiates a forecast simulation. An exam ple of FLO OD W atch™ implemented on top of an ALERT data collection network is prese nted in Figure 1. Th is type of system can be used to monitor and forec ast river and reservoir conditions in basins with short response times. It is an appropriate system for emergency management perso nnel wh o are not ex perts in hydrology and who have a limited amount of time for operational supervision. In add ition, it can b e used with read ily available P C hard ware and opera ting systems.
In large river systems with longer resp onse times, forecasting technology can be used to provide water management benefits as well as flood warning. Hyd rologic forecasts are needed for reservoir operation, water supp ly planning, nav igation sched uling, hydropower generation, environmental protection, recreation, and
fisheries management. Forecast time scales vary from hour ly to daily to even seasonal. The institutional as well as technology infrastructure requirements of supporting these larger, more complex systems are much greater than the flash flood forecast systems. Data collections systems coverin g much larger areas must be integrated into the system. An example of the large, multipurpose forecasting technology is the National W eather Service River Fo recast System (NWSRFS) developed by the U.S. National W eather Service (NW S). The NW S is the agency respo nsible for river forecasts and warnings for the protection of life and property as well as to support the management of the nation’s water resources. The NWS has recently undertaken a program to advance the technology within its operational forecasting op erations. Th is program is called the Advanced Hydrologic Prediction System (AHPS). Following the Great Flood of 1993 in the central U.S., a demonstration project was initiated in th e D es Moines Basin to showcase AHPS technolog ies. The four initial objectives of this project were to de mon strate new pro babilistic long-range forec ast prod ucts, to integrate long-range meteo rological clim ate forec asts into long-range hydrologic forecasts, to include short-term quantitative precipitation fore casts (QP Fs) into the hydro logic fo recas ts, and to demonstrate a flood inund ation m app ing tech nolo gy.
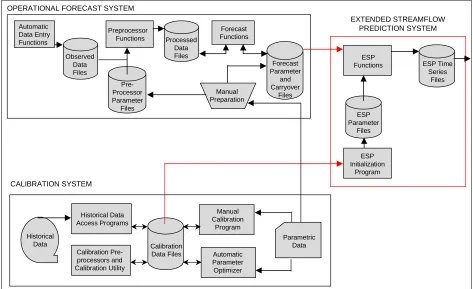
National Weather Service River Forecast System NW SRFS provides real-time predictions of river flows and other hydrometeorological variables used in river forecasting. The system includes a Calibration System (CS), an Op erational Fore cast System (OFS), and an Extended Streamflow Prediction (ESP) component. ESP produces probabilistic forecasts of streamflow based on the assumption that historical meteorological data are representative of po ssible futur e con ditions. Figure 2 outlines the interactions between the NWSRFS comp onents and database s.
hydrometeorological observations, processed areal time series estimates of precipitation and temperature, network and model parameter information, and current model states. The hydrologic, hydraulic, and u tility software that produce the fore casts in N W SRFS a re calle d op erations. An operation can be a hydrologic or hydraulic mo del, a time series computation program, or a statistical computation or display tool. The OFS includes an Interac tive Forecast Program (IFP) which is a GUI that lets the forecaster make run-time adjustments to the system in order to fine tune the fore cast based on the for ec aster's know ledge of the wa tershed and c urrent cond itions. The Extended Streamflow Prediction System: ESP uses the CS historical time series data and the OFS p arameters and current conditions to produce long-ra nge p rob abilistic hydro logic forecasts for user-specified periods. ESP is linked to OF S and CS b y datab ases an d ba sin param eters. ESP uses the basin and network parameters and the current watershed states from OFS comb ined with the historical time series of precipitation, temperature, and river d ata from CS. Simulations in ESP start with the current watershed states from OFS. The historical meteorological data time series are then applied to the basin, with each year of historical data producing a simulation trace. Traces are analyzed to produce probabilistic forecasts about watershed conditions ranging from one day to one year in the future based u pon cu rrent watershed states.
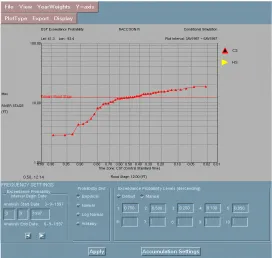
The Extended Streamflow Prediction Analysis and Display Program (ESPA DP ) was d evelo ped as part of AH PS to analyze ESP forecasts and to incorporate both short- and long-range climate pred iction and Q PF products into hydro logic forecasts. Products generated in ESPADP include time series realizations of future hydrologic cond itions, also called traces, pro bability interval plots, expected value plots, and exceedance probability plots for selected variables over var ying time in tervals . Temperature, precipitation, river stage, streamflow, and reserv oir pool elevation are just a few of the data types that can be analyzed. Users can compare model simulations (con ditional simulations), calibration simulations (historical simula tions) with obs erved data sets, and sta tistics ove r identic al analysis and time intervals. Risk-based forecast information is provided by examination of all the potential realizations, by analysis of exceedance histograms, and by statistical analysis using distributions to describe the forecast simulations. Figures 3 and 4 demonstrate example ESPADP risk-based analysis o utput.
Climatological Ad justm ents: ESP provides probab ilistic forecasts based on current watershed conditions and historical meteorological data. ESP also provides several mechanisms to incorporate weather and climate forecast information into the analysis. First, ES P allo ws a Q PF to
be included directly into the conditional simulation. W ithin the simulation, the Q PF is blend ed with historical precipitation for the short-duration p recipitation forecast using adjustable blend parameters. The blending period provides a smooth transition between future values and the historical data. Additionally, historical years can be weighted differen tly in the probab ilistic analysis if a forecaster has some knowledge about future climate. For example, year we ighting cou ld be used to condition the hydro logic forecast to El Niño signatures by excluding or weighting historica l years d ifferently. Season al snow melt forec asts can be shaped by forecaster knowledge of historical snowpacks and temperature and precipitation patterns. Automated procedures have also been developed to mod el adj ustme nts based up on the U.S . Clima te Prediction Center (CPC) long-term forecasts for precipitation and temperature.
Flood Inundation: Floo d inun datio n technology integrated into geo grap hic information systems (GIS) can provide a valuable linkage between hydrologic forecasting analysis and v isualizatio n for em ergen cy managem ent. The N W S has de velop ed to ols for overlaying contours of risk of inundation onto digital elevation models (DEM ). Other tools ha ve be en de veloped by a number of commercial entities to display inundation over GIS co verage's of cities, floodplains, etc. These dynamic maps can be valuable to emergency response planning and implementation. Figure 5 demonstrates an example of how flood inundation mapping might be displayed ope rationa lly.
Hydrologic forecasts from a system such as NWSRFS provide basic floo d warning info rmatio n and supp ort a variety of water management objectives. This system pro vides deterministic information for short-term operations and probab ilistic information for longer-term opera tions. The pro bab ilistic forecast information provides the basis for risk-based decisionmaking where decisions are based on the probability of future outcomes and the trade-off of one objectiv e versus ano ther. These systems require a much larger institutional commitment and technic al infrastruc ture to o pera te and mainta in on a daily basis; however, they pro vide the bes t possib le hydro logic fo recas t information to supp ort de cisions. WATER ADMINISTRATION AND PLANNING
60 feder al, and e ven lo cal (state /district) control and respo nsibility.
W hile technology cannot overcome many of the institutional issues facing developing countries in water man agem ent, the integration of technology and to ols into administrative and p lanning systems can provide consistent, reliable, and meaningful info rmatio n to decisionmakers in a timely manner. The availability of data and the ability to examine and visualize data and examine policy "wha t if" questions offers water managers the opportunity to look at potential impacts of decisions. There are many examp les of administration and planning systems in use in both developed and developing countries. Here we examine the Colorado River Decision Support System (CRDSS), developed and implemented by the Colorado State Engineers office and the Colorado W ater Conservation Board - the two primary agencies within Colorado for planning and administering water within the State of Colorado under the Prior Appropriation Doctrine of W estern U .S. wate r law, as w ell as numerous inter-state agreements and international water treaties. CRDSS was designed and developed to allow C olorado to enter a new era of water management that emphasizes cooperation among state agencies, water providers, and water users. T he C RD SS is a data-c entere d system that contains historic ta bular data such as stream flow, clim ate and diversions; spatial data such as topogr aphy, hydro grap hy, and irrigated acreage; and administrative data such as water rights and water mana gement p olicies. Da ta are keyed to locations in the river basin using a GIS. Th is computer-based system allows decision makers to access water resource data, simulate potential decisions and policies, and examine the co nseq uenc es with re gard to interstate compact policy, water resource planning, and water rights ad ministratio n.
A Data-Centered Approach
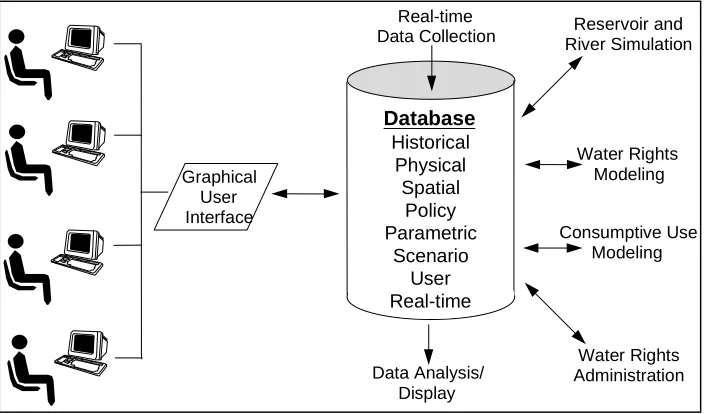
An essential requirement of CRDSS was that various database and modeling comp onents be developed and implemented over time. T his required that the da tabase design be scaleab le and flexible e noug h to allow gro wth and enhan cem ent. A model-generic approach was chosen, in which a core set of data are stored in a central database and are used by one or more applications. In this data-centered app roac h, the da tabas e bec ome s the rep ository for key data and consequently helps to maintain quality and consistency. Figure 6 illustrates the CRDSS data-centered approach where various tools share common data.
In order to impleme nt a data-centered system, there must be enough infrastructure in place to support and allow effective use of the system. The CRDSS database contains
all of the key water resources data needed for planning and administrative purposes for the State of Colorado and allows for “on e stop shop ping” for C olorado water d ata users. Utilities have been written to format data files for mod els and p rovid e effective data d isplays to users. Much of the data is available to Internet users via the CRDSS home page (www .cdss.c o.state.u s). Utilities are availab le that allow users to quick ly access and format data for use in other app lications.
It is important to note that the imple men tation of a data-centered approach in the CRDSS has not precluded the use of modular tools . Water resource planning models and other tools can run stand-a lone a nd ar e not tied direc tly to the datab ase. T his allows for distrib uted m ode ling efforts within the user com munity. In order to pro mote data sharing, standard data formats for time series and other data have been adopted. The data-centered approach, as adopted for the CRDSS, allows users to access data from a central location but perform analyses using accepted tools in a desktop enviro nme nt. As a p olicy, model output is not currently stored in the database but is kept in the standard mod el outp ut form ats. This simplifies mod el use and datab ase d esign an d de creas es the o verall size of the database. Exchange of data between models occurs using standard data form ats and file translation utilities, where nece ssary.
W ater Resource Planning
A water resource p lanning tool wa s imple men ted with CRDSS and is called StateM od. T his too l is a monthly water allocation and accounting model that had been developed by the state beginning in 1986. It is capable of making comparative analyses for the assessment of various historic and future wa ter ma nage men t policie s in a river basin using the Prio r Ap pro priatio n Do ctrine (first in time, first in right). StateMod’s operation is governed by hydro logy, water rights, and operating rules. It recognizes four types o f water rights: direct flow, instream flow, reserv oir storag e, and ope rationa l. Operational rights are used to co ntrol complex, multi-structure activities associated with reservoir releases, exchanges, and carrier ditch systems. Key features of the mo del re quire d to simulate the diverse operating conditions encountered on the western slope of Colorado include the following: • Simulates tributaries and main stem river systems
through the use of a tree-structured network
• Simulates direct flow, instream flow, storage and operation rights under the Prior Appropriation Doctrine as a func tion of w ater av ailability, priority, decreed amount, demand, structure capacity, and location
• Allows instream flows to be operated as a point or river reach
• Simulates a wide variety of operating agreements and exchanges between several users or structures • For a given structure, simulates one or more water
rights, with one or more return flow patterns returning to one or more stream nodes
• Uses an efficient direct solution algorithm that recognizes the impact of a diversion's return flows during the cu rrent time step with out ha ving to iterate • Estimates base or natural streamflow from gauged or
estimated streamflo w, dive rsion, and re servo ir data
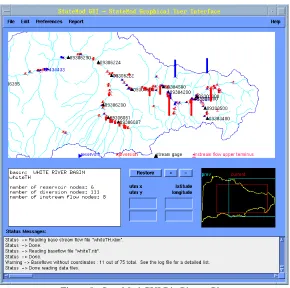
Da ta from the centralized database required in the planning proce ss includes streamflow, d iversions, baseflow, demand, and system efficiencies. These data are autom atically queried from the database and formatted for planning model use and ana lysis. The plann ing too l is based upon a node network topology. The model network describes the ph ysical co nnec tivity of the structures and gauges being modeled. StateMod uses a network file that describes model nodes in an upstream to downstream fashion. Figure 7 illustrates p art of the netwo rk for the W hite River basin. T his schematic re prese ntation of the network is useful for modeling and can be a ligned to close ly match the true orientation of the basin. Nodes are labeled with structure identifiers. The figure illustrates the use of stream flow gaug es, minimum streamflow reac hes, aggre gate d ema nds, an d ba seflow n ode s.
Figure 8 illustrates the Big Picture Plot feature of the StateMod GUI. This graphic shows the differ ence in diversions betwe en two policy allocation scenario s, with upward bars indicating that a diversion received more water under the second scenario, and downward bars indicating a decrease. The size of the bar indicates the mag nitude of the ch ange. Con sequ ently, water resources planning model users are able to see a b asin's response to an input change. This type of display illustrates the power of the CR DS S and its potential for helping make decisions at different levels. The Big P icture Plot can b e used by managers studying long-term average impacts, whereas hydrograph plots at a gauge might be more useful to someone studying the time varying impact at a location on the river (such as an instream flow study). CRD SS offers display tools fo r vario us outp ut levels to satisfy the needs of wate r managers.
The ability to visualize complex changes in water delivery or use in simple ways pro vides tremend ous benefit to water mana gers an d po licy makers when examining changes in operational or legal policy. In developing infrastructures, the ability to explore scenarios of water development allows d ecisionmakers greater understanding on the impacts of new development and the operations of
existing d evelo pme nt.
MULTI-OBJECTIVE WATER MANAGEMENT
Increased and competing demands on water resources typically result in a proliferation of water development activities in develop ing countries. A myriad of institutiona l, organizational, and funding programs often results in frac tured water m anag eme nt po licies as we ll as disjointed operation of existing reservoirs, water supply, and irrigation systems. D evelo pme nt of new systems is often planned an d imp lemented w ith little or no thoug ht to system integration and operation. As a consequence, decisionmakers find it increasingly d ifficult to op erate multipu rpo se rese rvoirs a nd ne twork s of rese rvoirs. Technology advances including computational power and efficiencies as well as modeling techniques have resulted in numerous develo pme nts in op timizatio n, multi-objective trade off analysis, risk analysis, a nd operations research. These develop ments have provided the foundation for multi-objective water management of reservoirs and systems allowing for operations which increase reliable yields, increasing power generation and revenues, secure more reliable water supp ly and irrigation supp ly, and provide more reliable operation for flood control and environmental considerations such as fisheries and sed iment flows.
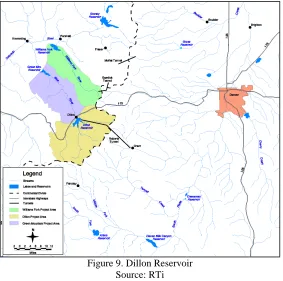
An exam ple o f how risk -based mu lti-objec tive ana lysis supp orts strategic planning over short-term and long-term horizons can be found in how the Denver, Colorado Water Department opera tes mountain reserv oirs for water supply, power, flood co ntrol, fisheries, and recreation be nefits. The Denver Water Department is responsible for providing water fo r the C ity and C ounty o f Den ver as w ell as 40 percent of the surround ing suburbs. T o do this, Denver W ater owns and manages 11 reservoirs on both the eastern and western slopes of the Continental Divide. Representing nearly half of Denver’s raw wate r supp ly, Dillon Reservoir (Figure 9) is considered one of Denver W ater’s most impo rtant water supply facilities.
Located on the western slope’s Blue River (Upper Colorado), with a live storage of 254,036 acre-feet, Dillon reserv oir is one of the largest lak es in Co lorad o. W ater is diverted from Dillon Reservoir to D enve r W ater’s treatment facilities via the 23.3 mile-long Roberts Tunnel under the Continental Divide. The water then flow s into the North Fork of the South Platte River.
62 (4) downstream recreation (fly fishing and white water rafting), an d (5) hydro pow er gen eration.
Forecast Information for Reservoir Operations
Reservoir opera tors rely on a variety of forecast information as input into the decisionm aking prog ress. Short-term forecasts (typically three to five days) give reserv oir ope rators impo rtant infor matio n abo ut reservoir inflows for real-time operations and short-term planning. Typ ically, short-term forecasts are deterministic in nature and represent the forecaster’s best estimate of future reserv oir inflow over severa l days. Exten ded probab ilistic forecasts (1- to 3-month outlooks) give operators impo rtant informatio n abo ut the unc ertainty and range of forec asts over an extended time horizon. The extended pro bab ilistic forecasts give d ecision mak ers inva luable information abo ut the distrib ution o f possib le reser voir inflows (i.e., timing and magnitude of peak inflow), as well as short-term and seasonal reserv oir inflow volumes. In the United States, the NW S issues short-term deterministic forecasts for over 3 ,000 fore cast points daily. For many reservoir decisionmakers, these fo recas ts provide essential information used in immediate real-time operational decisions. In addition to short-term deterministic forecasts, the N W S also provides a number of longer-range forecast products for reservoir planning. Seasonal forecasts of water supply used in the western United States a re pre pare d by the NWS a nd the Natural Resources Conservation Service (N RC S). T hese fo recas ts provide a mo st prob able v olum etric ou tlook along with reaso nable minimum and maximum vo lumes. The reasonable minimum and maximum vo lumes represent inflow volumes that are expected to be exceeded 90 perc ent and 10 p ercen t of the time , respe ctively. An important forecast product used in reservoir operations and developed by the NWS is the ESP forecast. ESP, described previously, provides probabilistic, or risk-based, information to rese rvoir o pera tors. Th ese p rob abilistic inflows are conditional and reflect the future variability of inflow base d on current hydro logica l conditions. Once streamflow realizations have been generated, a forecaster can us e the E SP AD P to gener ate oth er help ful pro ducts. Following is an example of a reser voir optimization model that uses ESP realizations of reservoir inflow to optimize operations at the multipurpose Dillon Reservoir.
Multi-Objective Optimization
A wide v ariety of reservoir o ptimization m ode ls exists to help decisionm akers formulate reservoir release strategies. Each of these models provides different levels of
information and utility, depending on reservoir system characteristics and operating goals. A Stochastic Linear Binding Method (SLBM) and a stocha stic linear re servo ir optimization mod el were deve lope d to a id the operators of the multipurpose Dillon Reservoir.
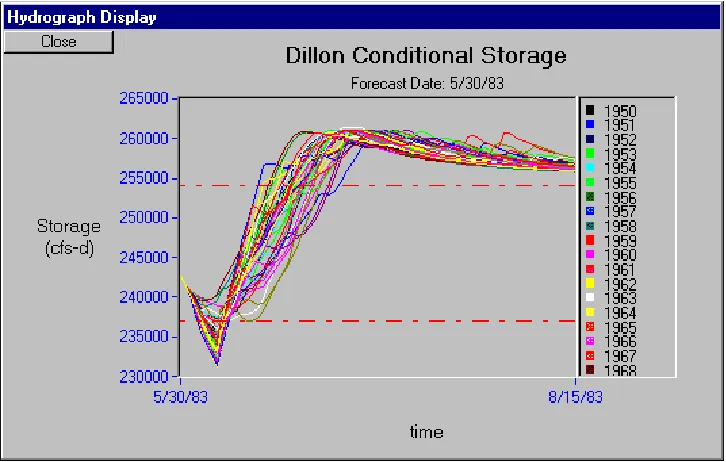
The stocha stic linear re servo ir optim ization model was created to aid decisionmakers with both short-term (one week) and long-term (seasonal) reservoir regulation decisions. The model helps reservoir decisionmakers explicitly quantify the benefits and risks asso ciated with different opera ting policies by identifying tradeoffs of operating benefits. With stochastic ESP inflows availab le for input, the reservoir optimization model was formulated as a multi-o bjec tive stoc hastic linear program ming m ode l, running on a d aily time step . The trade off curve depicted in Figure 10 illustrates a set of non-dominated optimal solutions for Dillon Reservoir. Each point on the curve defines an optim al alterna tive op erating policy, with each point representing the starting point for preferences between two con flicting ob jectives. Figures 11 and 12 dem onstra te the results for a single p oint on the trad eoff curve where the operating policy minimizes flood risk by initially releasin g 1,8 00 c ubic fe et per seco nd (c fs). The resulting discharge and storage under this policy, however, increase the risk or probability of not meeting a differe nt, non-commensurate objective.
The use of m ulti-objective tools to help manage multipurpo se reservoirs provides additional information to project operators which can greatly enhance yield, power revenues, and help minimize flood control and other objec tives. The use o f hydro logic fo recas t information can provide additional information into reservoir operations which allow better decisions to be made in the near-term which have longer-term effects. Furthermore, adding a pro bab ilistic compone nt to the analysis gives decisionmakers risk-based information up on wh ich to make decisions, greatly enhancing the ir ability to understand the inherent tradeoffs they must make.
C O N C LU S IO N
to assist in the sustainable growth and development of natural resource s.
Daniel J. Ep stein Mr. E pstein is a civil/software engineer specializing in project management, software design and development, water resources engineering, and hydro logic modeling. He has designed, developed, and implemented large comp uter ap plicatio ns for b oth rea l-time hydrometeorological operations as well as for planning purposes. He has experience in integrated decision support systems, including datab ases, ge ogra phic information systems, animation, and web application development. Mr. Ep stein’s computer engineering experience includes d esign, d evelo pme nt, qua lity assurance, project management, system administration, databa se adm inistration, and syste m utilities de velop men t. As a project manager, Mr. Epstein has extensive experience coordinating interdisciplinary software and engineering applications. He designs and coordinates development cycles to ensure quality products and client satisfaction.
Larry E. B raz il Dr. Brazil is the president and chief executive officer o f Rti Riverside Technology, inc.). He specializes in the development and evaluation of water management projects. In his technical role as a water resources engineer, he is involved in decision support system deve lopm ent, de terministic and stochastic hydro logic mod eling, hyd rom eteor olog ic forecast system design, and data analysis. He spent 11 years at the Hyd rologic Research Laboratory of the National Weather
Service where he de velop ed an d imp lemented c omp onents of real-time hydrometeorological monitoring and forecasting systems. Dr. Brazil’s experience in water management has inclu ded technic al assistance in forecasting water availability for operational purpo ses, such as irrigation management, hydropower prod uction, and water supply. Applications of his work also have included use of hydrometeorological forecast information for disaster and emergency response and preparedness. Dr. Brazil has 26 years of experience and has published over 40 papers in his areas of expertise.
64
Figure 1. FLOOD Watch Flood™ Forecasting Using ALERT-based Data Collection Network Source: RTi
OPERATIONAL FORECAST SYSTEM
Automatic Data Entry Functions
Observed Data Files
Preprocessor Functions
Pre-Processor Parameter Files
Processed Data Files
Forecast Functions
Manual Preparation
Forecast Parameter
and Carryover
Files
Historical Data
Historical Data Access Programs
Calibration Pre-processors and Calibration Utility
Calibration Data Files
Manual Calibration
Program
Automatic Parameter Optimizer
Parametric Data
ESP Functions
ESP Parameter
Files
ESP Initialization
Program
ESP Time Series
Files
EXTENDED STREAMFLOW PREDICTION SYSTEM
CALIBRATION SYSTEM
Figure 3. ESPADP Histogram Plot - 14th Street, Des Moines, IA Source: RTi
Figure 4. ESPADP Exceedance Probability Plot - 14th Street, Des Moines, IA
66
Figure 5. Flood Inundation Map - Chagres River below Madden Dam Source: RTi
Real-time
Data Collection River SimulationReservoir and
Water Rights Modeling
Consumptive Use Modeling
Database
Historical Physical
Spatial Policy Parametric
Scenario User Real-time Graphical
User Interface
Data Analysis/ Display
Water Rights Administration
Figure 7. Example of Part of a StateMod Network Diagram - the North Fork of the White River Source: RTi
68
Figure 9. Dillon Reservoir Source: RTi
Figure 11. Release Realizations for 1,800 cfs Source: RTi