125
Advances in Science and TechnologyResearch Journal
Volume 10, No. 29, March 2016, pages 125–131
DOI: 10.12913/22998624/61940 Research Article
Received: 2015.12.15 Accepted: 2016.02.01 Published: 2016.03.01
APPLYING CHAOTIC IMPERIALIST COMPETITIVE ALGORITHM FOR
MULTI-LEVEL IMAGE THRESHOLDING BASED ON KAPUR’S ENTROPY
Maryam Rouhani Nejad1, Mehdi Fartash1,*
1 Department of Electrical and Computer Engineering, Arak Branch, Islamic Azad University, Arak, Iran, e-mail:
* Corresponding author e-mail: [email protected]
ABSTRACT
Segmentation is one of the most important operations in image processing and com-puter vision. Normally, all image processing and comcom-puter vision applications are re-lated to segmentation as a pre-processing phase. Image thresholding is one of the most useful methods for image segmentation. Various methods have been represented for image thresholding. One method is Kapur thresholding, which is based on maximiz-ing entropy criterion. In this study, a new meta-heuristic algorithm based on imperial-ist competition algorithm was proposed for multi-level thresholding based on Kapur's entropy. Also, imperialist competitive algorithm is combined with chaotic functions to enhance search potency in problem space. The results of the proposed method have been compared with particle optimization algorithm and genetic algorithm. The find -ings revealed that the proposed method was superior to other methods.
Keywords: segmentation, thresholding, histogram, imperialist competitive algorithm, chaotic.
INTRODUCTION
Image segmentation as a pre-processing phase plays an important role in image processing and computer vision applications. In fact, segmenta-tion quality has great effects on other processing steps. Without proper segmentation, an efficient algorithm cannot operate efficiently. Hence, seg-mentation is constantly considered as an impor-tant phase for computer vision. There are various methods for segmentation. One method is ap-plying histogram. Histogram of an image repre-sents the way of intensity distribution of images. One segmentation method based on histogram is thresholding. Thresholding is an important tech-nique for performing image segmentation and is computationally efficient. The main purpose is to determine a threshold for bi-level thresholding or several thresholds for multi-level thresholding. Bi-level thresholding determines only one threshold which separates pixels into 2 groups while multi-level thresholding determines several thresholds which separate pixels into multiple groups.
In thresholding, maximizing entropy crite-rion is a common critecrite-rion for selecting optimal thresholds [1, 2, 3].
Thresholding based on entropy was first in-troduced by Pun. Pun proposed a method to se-lect image optimal thresholds through represent-ing new criterion of maximizrepresent-ing entropy between gray-levels of objects and gray-levels of image background. Another entropy-based method is Kapur's method. Kapur modified Pun's threshold-ing method by addthreshold-ing 2 gray-level probability distribution: one for background and another one for objects [1].
threshold-Advances in Science and Technology Research Journal Vol. 10 (29), 2016
126
ing. In their method, a multidimensional particle is changed into several one dimensional particles. The method prevents early convergence of particle optimization algorithm. This combined algorithm has increased efficiency of particle optimization algorithm in thresholding. The cost function used by them was based on Kapur's function. Musrrat Ali et al. [4] applied synergetic differential evo-lution, which is an improved version of differen-tial evolution for thresholding, and applied fitness function based on Kapur's function. Also, algo-rithms such as honey bee mating and tabu search [5] have been used for the purpose.
IMPERIALIST COMPETITIVE ALGORITHM
Imperialist competitive algorithm is an opti-mization algorithm introduced by Atashpaz and Lucas in 2007 [6]. This algorithm is inspired from a socio-political process started by some initial populations. In this algorithm, every element of population is called a country. The countries are divided into 2 classes: colonies and imperialists. Each imperialist colonizes and controls some countries. The core of this algorithm consists of a policy of attraction and colonial competition. According to policy of attraction historically ap-plied by imperialists, such as France and Eng-land in their colonies, imperialists made efforts to destroy culture, tradition, and language of their colonies (e.g. through building schools to teach their own languages). In this algorithm, the poli-cy is applied through moving colonies of an em-pire based on a specific relation. When a colony reaches a better position than the current imperi-alist, it replaces the current imperialist state of the empire. Also, the power of an empire consists of imperialist's power and a percentage of average of its colonies' power. Imperialist competition is another important part of this algorithm. During this process, weak empires lose their power and vanish. Finally, there is one empire which con-trols the world. In this situation, imperialist com-petitive algorithm reaches optimal point of objec-tive function and stops.
PROPOSED APPROACH
Thresholding through Kapur’s method
Let there be L gray-level in the image I and these gray-levels range {1, 2, …, L}. When the
pixels of an image are in L gray-level ([0, …, L]) and the number of pixels in i level is ni, normal histogram is as follows:
4
Imperialist competition is another important part of this algorithm. During this process,
weak empires lose their power and vanish. Finally, there is one empire which controls the
world. In this situation, imperialist competitive algorithm reaches optimal point of objective
function and stops.
3. Proposed Approach
3.1 Thresholding through Kapur's Method
Let there be L gray-level in the image I and these gray-levels range {1, 2, …, L}. When the
pixels of an image are in L gray-level ([0, …, L]) and the number of pixels in i level is ni,
normal histogram is as follows:
𝑝𝑝𝑖𝑖 = 𝑛𝑛𝑖𝑖⁄ , 𝑝𝑝𝑁𝑁 𝑖𝑖 ≥ 0 , ∑𝐿𝐿𝑖𝑖=1𝑝𝑝𝑖𝑖 = 1
Kapur's method maximizes criterion of entropy of histogram so that separated areas have
maximum central distribution [7]. The criterion is represented as follows for bi-level
thresholding:
Maximize 𝐽𝐽(𝑡𝑡) = H0+ H1
where
H0= − ∑𝑤𝑤𝑝𝑝𝑖𝑖 0 𝑡𝑡−1
𝑖𝑖=0
ln𝑤𝑤𝑝𝑝𝑖𝑖
0 , 𝑤𝑤0= ∑ 𝑝𝑝𝑖𝑖 𝑡𝑡−1
𝑖𝑖=0
(3)
H1= − ∑𝑤𝑤𝑝𝑝𝑖𝑖 1 𝐿𝐿−1
𝑖𝑖=𝑡𝑡
ln𝑤𝑤𝑝𝑝𝑖𝑖
1 , 𝑤𝑤1= ∑ 𝑝𝑝𝑖𝑖 𝐿𝐿−1 𝑖𝑖=𝑡𝑡 ( 1 ) ( 2 ) ( 3 ) (1) Kapur’s method maximizes criterion of en-tropy of histogram so that separated areas have maximum central distribution [7]. The criterion is represented as follows for bi-level thresholding: Maximize J(t) = H0 + H1 (2) where:
4
Imperialist competition is another important part of this algorithm. During this process,
weak empires lose their power and vanish. Finally, there is one empire which controls the
world. In this situation, imperialist competitive algorithm reaches optimal point of objective
function and stops.
3. Proposed Approach
3.1 Thresholding through Kapur's Method
Let there be L gray-level in the image I and these gray-levels range {1, 2, …, L}. When the
pixels of an image are in L gray-level ([0, …, L]) and the number of pixels in i level is ni,
normal histogram is as follows:
𝑝𝑝𝑖𝑖 = 𝑛𝑛𝑖𝑖⁄ , 𝑝𝑝𝑁𝑁 𝑖𝑖 ≥ 0 , ∑𝐿𝐿𝑖𝑖=1𝑝𝑝𝑖𝑖 = 1
Kapur's method maximizes criterion of entropy of histogram so that separated areas have
maximum central distribution [7]. The criterion is represented as follows for bi-level
thresholding:
Maximize 𝐽𝐽(𝑡𝑡) = H0+ H1
where
H0 = − ∑𝑤𝑤𝑝𝑝𝑖𝑖 0 𝑡𝑡−1
𝑖𝑖=0
ln𝑤𝑤𝑝𝑝𝑖𝑖
0 , 𝑤𝑤0 = ∑ 𝑝𝑝𝑖𝑖 𝑡𝑡−1
𝑖𝑖=0
(3)
H1 = − ∑𝑤𝑤𝑝𝑝𝑖𝑖 1 𝐿𝐿−1
𝑖𝑖=𝑡𝑡
ln𝑤𝑤𝑝𝑝𝑖𝑖
1 , 𝑤𝑤1 = ∑ 𝑝𝑝𝑖𝑖 𝐿𝐿−1 𝑖𝑖=𝑡𝑡 ( 1 ) ( 2 ) ( 3 ) 4
weak empires lose their power and vanish. Finally, there is one empire which controls the
world. In this situation, imperialist competitive algorithm reaches optimal point of objective
function and stops.
3. Proposed Approach
3.1 Thresholding through Kapur's Method
Let there be L gray-level in the image I and these gray-levels range {1, 2, …, L}. When the
pixels of an image are in L gray-level ([0, …, L]) and the number of pixels in i level is ni,
normal histogram is as follows:
𝑝𝑝𝑖𝑖 = 𝑛𝑛𝑖𝑖⁄ , 𝑝𝑝𝑁𝑁 𝑖𝑖 ≥ 0 , ∑𝐿𝐿𝑖𝑖=1𝑝𝑝𝑖𝑖 = 1
Kapur's method maximizes criterion of entropy of histogram so that separated areas have
maximum central distribution [7]. The criterion is represented as follows for bi-level
thresholding:
Maximize 𝐽𝐽(𝑡𝑡) = H0+ H1
where
H0= − ∑𝑤𝑤𝑝𝑝𝑖𝑖 0 𝑡𝑡−1
𝑖𝑖=0
ln𝑤𝑤𝑝𝑝𝑖𝑖
0 , 𝑤𝑤0= ∑ 𝑝𝑝𝑖𝑖 𝑡𝑡−1
𝑖𝑖=0
(3)
H1= − ∑𝑤𝑤𝑝𝑝𝑖𝑖 1 𝐿𝐿−1
𝑖𝑖=𝑡𝑡
ln𝑤𝑤𝑝𝑝𝑖𝑖
1 , 𝑤𝑤1= ∑ 𝑝𝑝𝑖𝑖 𝐿𝐿−1 𝑖𝑖=𝑡𝑡 ( 1 ) ( 2 ) ( 3 ) (3)
Maximum threshold is a threshold that maxi-mizes the previous equation. In fact, H0 and H1 are entropies of each part. The objective of Ka-pur’s method is to maximize this sum (maximiz-ing the entropy).
Kapur’s criterion of optimization for multi-level thresholding has developed. This criterion is defined as follows. Multi-level thresholding is supposed as an m dimensional optimization prob-lem. We want to determine m for thresholding [t1, t2, …, tm]. The objective is to determine the maxi-mum of the following function:
5
Maximum threshold is a threshold that maximizes the previous equation. In fact, H0 and H1
are entropies of each part. The objective of Kapur's method is to maximize this sum
(maximizing the entropy).
kapur's criterion of optimization for multi-level thresholding has developed. This criterion
is defined as follows. Multi-level thresholding is supposed as an m dimensional
optimization problem. We want to determine m for thresholding [t1, t2, …, tm]. The
objective is to determine the maximum of the following function:
𝐽𝐽([𝑡𝑡1, 𝑡𝑡2, … , 𝑡𝑡𝑚𝑚]) = H0+ H1+ H2+ ⋯ + Hm
H0= − ∑ 𝑤𝑤𝑝𝑝𝑖𝑖 0 𝑡𝑡1−1
𝑖𝑖=0
ln𝑤𝑤𝑝𝑝𝑖𝑖
0 , 𝑤𝑤0= ∑ 𝑝𝑝𝑖𝑖 𝑡𝑡1−1
𝑖𝑖=0
H1= − ∑𝑡𝑡𝑖𝑖=𝑡𝑡2−11𝑤𝑤𝑝𝑝1𝑖𝑖ln 𝑝𝑝𝑖𝑖
𝑤𝑤1 , 𝑤𝑤1= ∑ 𝑝𝑝𝑖𝑖 𝑡𝑡2−1 𝑖𝑖=𝑡𝑡1
H2= − ∑ 𝑤𝑤𝑝𝑝𝑖𝑖 2 𝑡𝑡3−1
𝑖𝑖=𝑡𝑡2
ln𝑤𝑤𝑝𝑝𝑖𝑖
2 , 𝑤𝑤2= ∑ 𝑝𝑝𝑖𝑖 𝑡𝑡3−1
𝑖𝑖=𝑡𝑡2
Hm= − ∑ 𝑤𝑤𝑝𝑝𝑖𝑖 𝑚𝑚 𝐿𝐿−1
𝑖𝑖=𝑡𝑡𝑚𝑚
ln𝑤𝑤𝑝𝑝𝑖𝑖
𝑚𝑚 , 𝑤𝑤𝑚𝑚= ∑ 𝑝𝑝𝑖𝑖 𝐿𝐿−1
𝑖𝑖=𝑡𝑡𝑚𝑚
3.2 Chaotic Imperialist Competitive Algorithm
In the proposed method, asequence generated by chaotic maps is used in theparameters of
imperialist competitive algorithm instead of a random sequence of numbers. In this section,
initial countries are generated as a repetition of chaotic maps. In this algorithm, N and i
denote the number of dimensions of the problem and a country in the population,
respectively. Varmin and varmax are lower and upper bounds, respectively. Also, xi,j (5) (4) (4)
5
Maximum threshold is a threshold that maximizes the previous equation. In fact, H0 and H1
are entropies of each part. The objective of Kapur's method is to maximize this sum
(maximizing the entropy).
kapur's criterion of optimization for multi-level thresholding has developed. This criterion
is defined as follows. Multi-level thresholding is supposed as an m dimensional
optimization problem. We want to determine m for thresholding [t1, t2, …, tm]. The
objective is to determine the maximum of the following function:
𝐽𝐽([𝑡𝑡1, 𝑡𝑡2, … , 𝑡𝑡𝑚𝑚]) = H0+ H1+ H2+ ⋯ + Hm
H0= − ∑ 𝑤𝑤𝑝𝑝𝑖𝑖 0 𝑡𝑡1−1
𝑖𝑖=0
ln𝑤𝑤𝑝𝑝𝑖𝑖
0 , 𝑤𝑤0= ∑ 𝑝𝑝𝑖𝑖 𝑡𝑡1−1
𝑖𝑖=0
H1= − ∑𝑡𝑡𝑖𝑖=𝑡𝑡2−11𝑤𝑤𝑝𝑝1𝑖𝑖ln 𝑝𝑝𝑖𝑖
𝑤𝑤1 , 𝑤𝑤1= ∑ 𝑝𝑝𝑖𝑖 𝑡𝑡2−1 𝑖𝑖=𝑡𝑡1
H2= − ∑ 𝑤𝑤𝑝𝑝𝑖𝑖 2 𝑡𝑡3−1
𝑖𝑖=𝑡𝑡2
ln𝑤𝑤𝑝𝑝𝑖𝑖
2 , 𝑤𝑤2= ∑ 𝑝𝑝𝑖𝑖 𝑡𝑡3−1
𝑖𝑖=𝑡𝑡2
Hm= − ∑ 𝑤𝑤𝑝𝑝𝑖𝑖
𝑚𝑚 𝐿𝐿−1
𝑖𝑖=𝑡𝑡𝑚𝑚
ln𝑤𝑤𝑝𝑝𝑖𝑖
𝑚𝑚 , 𝑤𝑤𝑚𝑚= ∑ 𝑝𝑝𝑖𝑖 𝐿𝐿−1
𝑖𝑖=𝑡𝑡𝑚𝑚
3.2 Chaotic Imperialist Competitive Algorithm
In the proposed method, a sequence generated by chaotic maps is used in the parameters of
imperialist competitive algorithm instead of a random sequence of numbers. In this section,
initial countries are generated as a repetition of chaotic maps. In this algorithm, N and i
denote the number of dimensions of the problem and a country in the population,
respectively. Varmin and varmax are lower and upper bounds, respectively. Also, xi,j (5) (4)
Chaotic imperialist competitive algorithm In the proposed method, a sequence generated by chaotic maps is used in the parameters of im-perialist competitive algorithm instead of a ran-dom sequence of numbers. In this section, initial countries are generated as a repetition of chaotic maps. In this algorithm, N and i denote the
127
Advances in Science and Technology Research Journal Vol. 10 (29), 2016ber of dimensions of the problem and a country in the population, respectively. Varmin and varmax are lower and upper bounds, respectively. Also, xi,j denotes jth dimension of ith country in the
popu-lation. Pseudo-code of initial population genera-tion algorithm using chaotic maps is as follows:
6
denotes jth dimension of ith country in the population. Pseudo-code of initial population
generation algorithm using chaotic maps is as follows:
3.3 Overall Structure of the Proposed Algorithm for Image Segmentation
The proposed algorithm based on chaotic imperialistic competition for multi-level
thresholding is described in this section.
Step 1: Give initial values to ICA including NumOfCountries, NumOfImp, and NumOf
Col. The relationship between these parameters is as follows:
NumofCountries= NumofImp + NumofCol (6)
Step 2: Produce initial countries by continuous repetition of chaotic map.
Step3: Compute cost function for each country based on Kapur's method.
Step 4: Select NumOfImp of the strongest countries as imperialist, and the rest are Num
OfCol. To establish an initial empire, the normalized cost of the empire can be defined as
follows:
MCI= the maximum number of chaotic iteration
i =0
while (i population size )
Randomly initialize the first chaotic variables j =0
while (j<N)
generate chaotic variable cmi j, according to the selected map
xi j, var min cm (var max var min) i j,
j j 1
end while
i =i+1
end while
Overall structure of the proposed algorithm for image segmentation
The proposed algorithm based on chaotic im-perialistic competition for multi-level threshold-ing is described in this section.
• Step 1: Give initial values to ICA including Num Of Countries, Num Of Imp, and Num Of Col. The relationship between these param-eters is as follows:
Num of Countries= Num of Imp + Num of Col (6) • Step 2: Produce initial countries by continuous
repetition of chaotic map.
• Step3: Compute cost function for each country based on Kapur’s method.
• Step 4: Select Num Of Imp of the strongest countries as imperialist, and the rest are Num Of Col. To establish an initial empire, the nor-malized cost of the empire can be defined as follows:
max{ }
k i i k
C = c −c (7)
Where ckis the cost of the kth empire and C
k is its normalized cost. Finally, the normalized pow-er of each empire is defined as follows:
7
Where ckis the cost of the kth empire and Ck is its normalized cost. Finally, the normalized
power of each empire is defined as follows:
𝑝𝑝𝑘𝑘
= |
𝐶𝐶𝑘𝑘∑𝑁𝑁𝑁𝑁𝑁𝑁𝑁𝑁𝑁𝑁𝑁𝑁𝑁𝑁𝑁𝑁𝑖𝑖=1 𝐶𝐶𝑖𝑖
|
The normalized power of an empire represents the number of initial colonies that should be
conquered by an imperialist and is defined as follows. N.Cndenotes the initial number of
colonies of the nth empire.
Step 5: Colonies turn into imperialists chaotically.
Step 6: Apply revolution operator on each colony. In each repetition, produce a random
number between 0 and 1 for each imperialist. Next, the result is compared with probability
of revolution rate.When the random number is less than the revolution rate, the revolution
is produced.
Step 7: Calculate the cost of all colonies and imperialists of the empire. In previous steps, if
there is a colony in the empire which has lower cost than the imperialist, that colony takes
the control of the empire.
Step 8: Obtain the total power of all empires.
Step 9: Perform imperialistic competition.
Step 10: Remove the weakest empire. When an empire is removed, all its colonies are
removed too.
Step 11: Add one unit to Dec value.
Step 12: When Dec value is more than maxDec (Dec>maxDec), you can stop; otherwise return to
step 6.
max{ }
k i i k
C c c
. n ( .n )
N C round p NumOfCol (9) (7)
(8) (8)
The normalized power of an empire repre-sents the number of initial colonies that should be conquered by an imperialist and is defined as fol-lows. N.Cn denotes the initial number of colonies of the nth empire.
. n ( .n )
N C =round p NumOfCol (9)
• Step 5: Colonies turn into imperialists chaoti-cally.
• Step 6: Apply revolution operator on each colo-ny. In each repetition, produce a random number between 0 and 1 for each imperialist. Next, the result is compared with probability of revolu-tion rate. When the random number is less than the revolution rate, the revolution is produced. • Step 7: Calculate the cost of all colonies and
imperialists of the empire. In previous steps, if there is a colony in the empire which has low-er cost than the implow-erialist that colony takes the control of the empire.
• Step 8: Obtain the total power of all empires. • Step 9: Perform imperialistic competition. • Step 10: Remove the weakest empire. When an
empire is removed, all its colonies are removed too.
• Step 11: Add one unit to Dec value.
• Step 12: When Dec value is more than maxDec (Dec>maxDec), you can stop; otherwise return to step 6.
EXPERIMENTAL RESULTS AND
COMPARATIVE PERFORMANCES
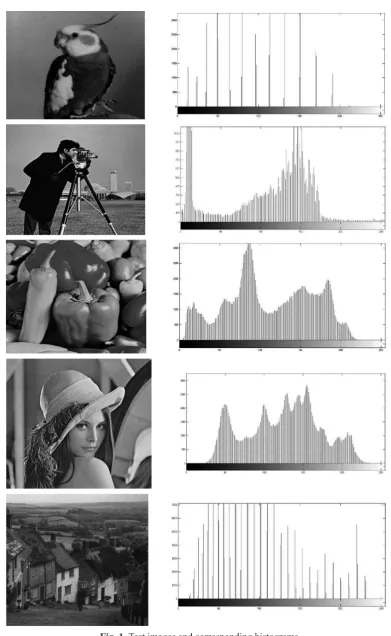
Five pictures: “Lena”, “Pepper”, “Bird”, “Camera”, and “Goldhill”, were applied to evalu-ate the performance of the proposed algorithm. These test images and corresponding histograms are shown in Figure 1.
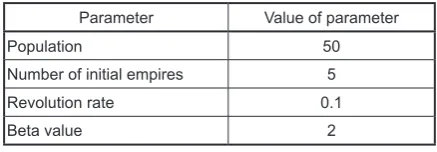
We implemented the proposed algorithm in language of Matlab (2014) under a computer with 2GHz CPU, 1 G RAM with Windows 8.1 sys-tem. The size of “Camera” and “Pepper” image is 256×256 and the size of other images is 512×512. The most appropriate parameters of the algorithm to conduct experiments are shown in Table 1.
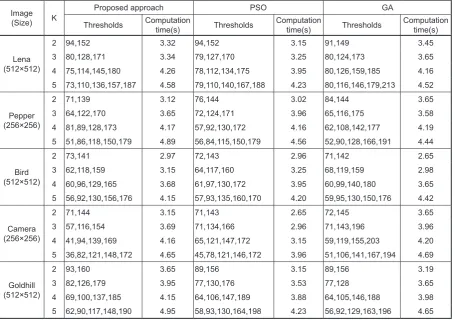
Computation time and thresholds
In this section, computation time and thresh-olds are obtained using the particle optimization algorithm and genetic algorithm. In obtaining thresholds using meta-heuristic algorithm, time
Table 1. Parameters used for thresholding images
Parameter Value of parameter
Population 50
Number of initial empires 5
Revolution rate 0.1
128
is one of the major aspects. By increasing the number of thresholds, computation time increas-es. Table 2 demonstrates optimal thresholds and computation times based on entropy criterion.
129
Advances in Science and Technology Research Journal Vol. 10 (29), 2016times of the proposed algorithm are often a little more than that of PSO and genetic algorithm due to using chaotic functions in producing random numbers.
Analysis of signal to noise ratio
The popular performance indicator, peak sig-nal to noise ratio (PSNR) is used to compare seg-mentation results by threshold techniques of mul-tilevel image [8–10]. PSNR criterion has been investigated as an evaluation criterion of quality of thresholding. Increased value of PSNR results in higher quality of thresholding. We define the criterion, measured in decibel (dB) as:
10 255
20log ( )
PSNR
RMSE
= (10)
where: RMSE (root mean-squared error) is de-fined as follows:
2
1 1
( ( , ) ( , ))
M N
i j
I i j I i j RMSE
MN ∧
= =
−
=
∑∑
(11)I and I^ are original and segmented images of
size M×N, respectively.
Table 2. Optimal thresholds and computation times based on entropy criterion
GA PSO
Proposed approach K
Image
(Size) Computation
time(s) Thresholds
Computation time(s) Thresholds
Computation time(s) Thresholds
3.45 91,149
3.15 94,152
3.32 94,152
2 Lena (512×512)
3.65 80,124,173
3.25 79,127,170
3.34 80,128,171
3
4.16 80,126,159,185
3.95 78,112,134,175
4.26 75,114,145,180
4
4.52 80,116,146,179,213
4.23 79,110,140,167,188
4.58 73,110,136,157,187
5
3.65 84,144
3.02 76,144
3.12 71,139
2 Pepper (256×256)
3.58 65,116,175
3.96 72,124,171
3.65 64,122,170
3
4.19 62,108,142,177
4.16 57,92,130,172
4.17 81,89,128,173
4
4.44 52,90,128,166,191
4.56 56,84,115,150,179
4.89 51,86,118,150,179
5
2.65 71,142
2.96 72,143
2.97 73,141
2 Bird (512×512)
2.98 68,119,159
3.25 64,117,160
3.15 62,118,159
3
3.65 60,99,140,180
3.95 61,97,130,172
3.68 60,96,129,165
4
4.42 59,95,130,150,176
4.20 57,93,135,160,170
4.15 56,92,130,156,176
5
3.65 72,145
2.65 71,143
3.15 71,144
2 Camera (256×256)
3.96 71,143,196
2.96 71,134,166
3.69 57,116,154
3
4.20 59,119,155,203
3.15 65,121,147,172
4.16 41,94,139,169
4
4.69 51,106,141,167,194
3.96 45,78,121,146,172
4.65 36,82,121,148,172
5
3.19 89,156
3.15 89,156
3.65 93,160
2 Goldhill (512×512)
3.65 77,128
3.53 77,130,176
3.95 82,126,179
3
3.98 64,105,146,188
3.88 64,106,147,189
4.15 69,100,137,185
4
4.65 56,92,129,163,196
4.23 58,93,130,164,198
4.95 62,90,117,148,190
5
Table 3 shows that by increasing the number of thresholding, signal to noise ratio increases. The results show that the proposed method often presents higher PSNR. Also, most of the time, the genetic algorithm has lower accuracy compared with other methods.
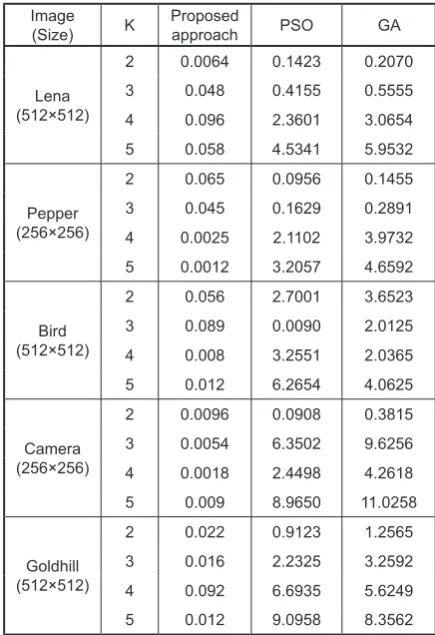
Cost values
The purpose of all meta-heuristic algorithms is to maximize or minimize a function which is called fitness function or cost function. In this study, an entropy based cost function is used, and the pur-pose is to maximize this function. Table 4 shows the value of cost using the entropy based method.
As shown in Table 4, the cost function increas-es by increased number of thrincreas-esholds. Also, the values of the cost function of the proposed method were higher compared with other methods except for “Goldhill” image and the threshold of 4.
Stability analysis
130
Table 3. Signal to noise ratio for thresholding 5 images using entropy criterion
GA PSO Proposed approach K Image (Size) 12.33 12.34 12.39 2 Lena (512×512) 14.99 15.33 15.65 3 17.08 17.83 17.96 4 19.54 20.44 20.46 5 12.51 12.51 12.58 2 Pepper (256×256) 14.71 15.09 15.96 3 17.69 18.09 18.65 4 20.06 20.73 21.09 5 12.13 12.20 12.32 2 Bird (512×512) 14.90 15.30 15.25 3 16.69 17.91 18.11 4 19.65 20.01 20.65 5 11.94 12.25 12.65 2 Camera (256×256) 14.82 15.21 15.29 3 17.16 18.00 18.69 4 19.79 20.96 21.62 5 12.11 12.34 12.44 2 Goldhill (512×512) 14.75 14.90 14.96 3 16.96 17.90 17.95 4 19.96 19.90 20.93 5 2 1 ( ) k i i std k δ µ = −
=
∑
(12)This formula is used to obtain standard devia-tion. Standard deviation shows the distribution of data. K denotes the number of implementations of algorithm (10 implementations), and δiindicates the optimal value for objective function in each imple-mentation. Also, the average of δ values is denoted by µ. Lower standard deviation results in higher stability of algorithm. Table 5 shows the standard deviations using the entropy based method.
As shown in table 5, all standard deviations are low, which shows higher stability of the pro-posed method compared with other methods. Higher stability means that the results of different implementations are closer while lower stability means that the results are not close.
CONCLUSIONS
In this study, we proposed a maximizing en-tropy criterion based method to select multi-level thresholds using chaotic imperialist competitive algorithm. Imperialist competitive algorithm is
Table 4. Value of cost using the entropy based method
GA PSO Proposed approach K Image (Size) 12.3545 12.3544 12.3545 2 Lena (512×512) 15.7862 15.7625 15.7963 3 18.5421 18.5523 18.5796 4 21.2693 21.2469 21.2560 5 12.6235 12.6296 12.6354 2 Pepper (256×256) 15.8061 15.8109 15.8209 3 18.3465 18.3261 18.3546 4 21.0125 21.0012 21.0192 5 5.2864 5.2904 5.3085 2 Bird (512×512) 6.2032 6.2142 6.2241 3 6.5412 6.8514 6.8666 4 7.6214 7.6232 7.6554 5 12.1542 12.2365 12.2465 2 Camera (256×256) 15.2156 15.2261 15.2325 3 18.2765 18.2874 18.2931 4 20.9235 20.9123 20.9564 5 6.3921 6.3541 6.3962 2 Goldhill (512×512) 7.3965 7.4021 7.4105 3 8.1521 8.1536 8.1445 4 8.6935 8.3564 8.7974 5
131
Advances in Science and Technology Research Journal Vol. 10 (29), 2016a new meta-heuristic algorithm impressed from imperialistic competition between countries. In this algorithm, each solution is called a country. Imperialists attempt to attract colonies toward themselves, and this process continues until there is only one imperialist. This algorithm has been proved efficient for different optimization prob-lems. The purpose of this study was to segment images using chaotic imperialist competitive al-gorithm. Thereby, using chaotic functions, the ef-ficiency of the imperialist competitive algorithm was improved. Using chaotic functions for pop-ulation production the variety of the poppop-ulation increased. Next, the new algorithm was used for image segmentation through thresholding. Ka-pur-based cost function which applies the entropy criterion was used as fitness function. The results were applied on some images. Several criteria in-cluding time, signal to noise ratio, fitness function and standard deviation were applied to evaluate the efficacy. The results revealed that the algo-rithm is superior to other algoalgo-rithms in efficacy. Also, applying chaos results in a variety of initial results and increased efficacy of the algorithm.
REFERENCES
1. Kapur J.N., Sahoo P.K., Wong A.K.C. A new meth-od for gray-level picture thresholding using the en-tropy of the histogram. Computer Vision Graphics Image Processing 3, 1985, 273–285.
2. Portes de Albuquerque M., Esquef I.A. Gesualdi Mello A.R. Image thresholding using Tsallis entro-py. Pattern Recognition Letters 2004, 1059–1065. 3. Pal N.R., Pal S.K. Entropic thresholding. Signal
Processing 1989, 97–108.
4. Maitra M, Chatterjee A. A hybrid cooperative–com-prehensive learning based PSO algorithm for image segmentation using multilevel thresholding. Expert Systems with Applications 2008, 2, 1341–1350. 5. Ali M., Ahn C.W., Pant M. Multi-level image
thresholding by synergetic differential evolution. Applied Soft Computing2014, 1–11.
6. Jiang Y., Tsai P., Hao Z., Cao L. Automatic mul-tilevel thresholding for image segmentation using
stratified sampling and Tabu Search. Soft Comput -ing2014, 1–13.
7. Atashpaz-Gargari E., Lucas C. Imperialist com-petitive algorithm: an algorithm for optimization inspired by imperialistic competition. In: Proceed-ings Evolutionary Computation, CEC 2007 IEEE Congress on, 25-28 sept 2007, Singapore 2007, 4661–4667.
8. Horng M.H. A multilevel image thresholding using the honey bee mating optimization. Applied Math-ematics and Computation 9, 2010, 3302–3310. 9. Dirami A., Hammouche K., Diaf M., Siarry P. Fast
multilevel thresholding for image segmentation through a multiphase level set method. Signal Pro-cessing 1, 2013, 139–153.
10. Raja N., Rajinikanth V., Latha K. Otsu based