Copyright © 2015 IJECCE, All right reserved
Data Fusion for Urban Feature Extraction from LiDAR
and Hyperspectral Data
Dr. Seyed Yousef Sadjadia
Geomatics Department, School of Civil Engineering, Tafresh University, Tafresh, I.R. Iran
Emails: sysadjadi@hotmail.com
Omid Aienehb
Geomatics Department, School of Civil Engineering, Tafresh University, Tafresh, I.R. Iran
Email: aieneh.omid@gmail.com
Abstract – The main problems of hyperspectral data are the large number of bands, high dependency between them and different signal to noise ratio in each band. In order to reduce the dimensions of the feature space, minimizing noise and spectral dependence between bands, the MNF method has been used for achieving better results in this paper. Finally, by applying this algorithm, the 144 bands of hyperspectral data was reduced to 19 suitable bands. Then from LiDAR data, the image height and intensity of the return signal received from the first and the last pulse of the laser were produced by LiDAR sensor. At last, The 19 spectral bands extracted from hyperspectral data have been fusion with 4 images of LiDAR data at the pixel level to create 23 suitable spectral bands . In order to detect and extract any feature study of the area on 23 spectral bands, seven different SVM method were applied and finally by majority voting in the decision level between 7 obtained results, the class of each pixel was turned out. Then , morphology closing transform for repairing buildings and Hough transform for reconstructing the network effects of the fragmentation of land transportation were used on the results of pixels basis SVM method to disciplined side structure built by man as well as the individual pixels is reduced. The results in this paper indicates the 99.52% overall accuracy and .958 kappa coefficient which compared to the GRSS chosen institution method .06 Kappa coefficient has been improved. The data used in this paper are air-borne LiDAR and hyper-spectral scenes requested and downloaded from the organized of a recent contest in data fusion domain. The data have been gathered and are available from Houston University in 2012 by Geoscience and Remote Sensing Society (GRSS), a branch of IEEE institute.
Keywords – MNF, SVM, LiDAR, Hyperspectral, Majority, Voting, Fusion, Extraction.
I.
I
NTRODUCTIONOne of the powerful methods for improving classification performance is data and sensor fusion. In recent years, different remote sensing sensors are provided a wide spectrum of data. For many applications, the information provided by single sensors are incomplete and imprecise, multiple sensors can provide complementary data and fusion of information from different sensors can provide the better information from desired area which is not possible with individual sensors (Simon, 2002. Pohl and Van Genderen, 1998). Fusion of multiple datasets can be performed at the signal, pixel, feature and decision level (Esteban, 2004, Pohl, 1998). In signal level fusion, signals from multiple sensors are combined together to create new signal with a better signal-to-noise ratio than the input signals. In pixel level fusion, the information from different images on a pixel by pixel are merged to
Copyright © 2015 IJECCE, All right reserved medical diagnosis and machine fault diagnosis (fault
diagnosis in transformer and induction motor). Zheng et al. (2005) used Bayesian-based fusion to integrate results from different image processing approaches for diagnosing diseases. McArthur et al. (2004) combined k-means clustering, back-propagation neural network and userwritten rules based on Bayesian approach to diagnose faults in a power transformer. Dempster–Shafer-based fusion has also been widely used in various fields. Parikh et al. (2001, 2003) used the Dempster–Shafer evidence theory to combine the outputs of multiple primary classifiers to improve overall classification performance. The effectiveness of this approach was demonstrated for detecting failures in a diesel engine cooling system. There are several other decision fusion strategies including behavior knowledge space (Huang and Suen 1993, 1995) which uses a lookup table that lists the most common correct classes for every possible class combinations given by the classifiers, decision templates (Kuncheva et al. 2001) which compute a similarity measure between the current decision profile of the unknown instance and the average decision profiles of instances from each class. A detailed overview of various decision fusion strategies is available in Kuncheva (2004). With the development of the remote sensing imaging technology, application of decision fusion approaches for fusion of images from different sensors is becoming more and more widespread in remote sensing. Recently, new researches focus on decision fusion strategies to overcome the weaknesses of single remote sensing sensors (Simone et al. 2002, Hsu and Burke 2003). As hyperspectral images provide a detailed description of the spectral signatures of classes without any height information, fusion of this data with LIDAR data may improve classification results. In Lidar data object detection is possible as well as prediction about height of objects. Fusion of these both datasets is expected to increase the classification accuracy. Simental et al. (2003) showed that fusion of hyperspectral and LiDAR data can enhance overall detection and classification performance in vegetation classes. As HSI provide a widespread description of the spectral information in some classes without any height information such as building, street and vegetation, fusion of this data with LiDAR data may improve classification results in areas with different height. Lemp et al. (2005) fused hyperspectral and LiDAR data for improving classification of urban areas. They used LiDAR data for segmentation and hyperspectral data for classification tasks. Delponte et al. (2008) investigate the joint of hyperspectral and LiDAR data with classification based on SVM for rainforest areas. They applied a band reduction strategy to select the best features from hyperspectral data. Then, they added a LiDAR data to selected features from hyperspectral data for the classification. In recent years, Zhao et al. (2013) applied four features: Principal Component Analysis (PCA), Minimum Noise Fraction (MNF), Normalized Difference Vegetation Index (NDVI) and GLCM on hyperspectral data. Next, non-ground and ground points on LiDAR data are separated based on the algorithm proposed by Axelsson (Zhao, 2013). After that they applied three
classifiers on features of hyperspectral data and LiDAR data. Finally, they fused all classifiers using majority voting (Zhao, 2013). This paper proposes a classifier fusion system based on SVM classifier and dimension reduction methods for fusion of hyperspectral and LiDAR data. At first, different features are extracted from both datasets to generate features spaces on hyperspectral and LiDAR data. Then, classification based on SVM is applied on hyperspectral and LiDAR data features and by using a classifier fusion method, the outputs of SVM classifiers for producing final image will be fused. At last, final image will be reconstructed.
II.
P
ROPOSEDM
ETHODThis paper proposes a classification method based on SVM and dimension reduction for fusion of hyperspectral and LiDAR data. In first section, Minimum Noise Fraction (MNF) method is applied on hyperspectral images for dimensionally reduction and then several features are extracted from LiDAR data. In second section, Features extracted from the LiDAR data and hyperspectral images are fused at the pixel level and then, Support Vector Machine method for classification is applied on features fusion. In third section, the classifiers which are obtained from SVM method will be fused together by using a fusion method and then final image will be provided. In final section, morphology closing transform for repairing buildings and Hough transform for reconstructing the network effects of the fragmentation of land transportation will be used on the final image to discipline side structure built by man. General diagram for proposed method is shown in figure 1.
2.1 Feature Extraction
In this step, as shown in the figure 1, different features are extracted from LiDAR and hyperspectral data. These features must contain useful information for improving accuracy of classification process.
2.1.1 Dimension Reduction on Hyperspectral Data
Copyright © 2015 IJECCE, All right reserved One of the main steps of classification process on
hyperspectral is extraction of proper features from dataset. These features must contain useful information to identify different regions of the surface. MNF have been utilized to reduce the dimension of spectral bands. The first 19th features or bands contain the most information of the hyperspectral images. Because the variances of bands in the first 19th ones are higher than the others.
2.1.2 Feature extraction on LiDAR data
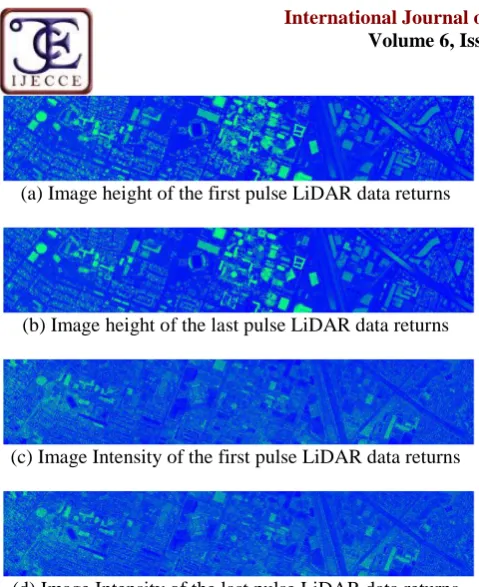
Extraction of proper features from LiDAR data is one of main steps in classification process. On LiDAR data, the image height and intensity of the return signal received from the first and the last pulse of the laser were produced by LiDAR sensor.
2.2 SVM based classification
One of the most popular classification methods are SVMs defined by Vapnik (1998), a large margin-based classifier with a good generalization capacity in the small-size training set problem with high-dimensional input space. SVMs discriminate two classes by fitting an optimal linear separating hyper- plane to the training samples of two classes in a multidimensional feature space. The optimization problem being solved is based on structural risk minimization and aims to maximize the margins between the optimal separating hyper-plane and the closest training samples – the so-called „support vectors‟. A detailed description on the general concept of SVM is given by Burges (1998) and Schölkopf and Smola (2002). It is worth underlining that the kernel-based implementation of SVMs involves the problem of the selection of multiple parameters, including the kernel parameters (e.g., parameters for the Gaussian and polynomial kernels) and the regularization parameter C. In our proposed method, the kernel of each individual classifier is adjusted according to the corresponding feature space properties. This paper utilized one-against-all multiclass SVM with RBF kernel (RBF is one of the most popular kernel function for SVM classifier) as base classifier.
2
2
( ,i j) exp i , 0
k x x x x (1)
Grid search is a well-known technique for model selection which performs exhaustive search and selects a set of parameters values with the best fitness (Hsu et al. 2010). In this paper, LIBSVM software has been used for multi-classification.
2.3 Fusion of Hyperspectral and LiDAR data
In first section, after producing Hyperspectral images with suitable bands and producing images height and intensity of the first and the last return from LiDAR data, SVM classifiers are applied on features fusion. For this purpose, seven different methods of machine learning SVM on the images are used. Finally by majority voting in the decision level between SVM obtained results from seven different methods, the class of each pixel is turned out.
III.
R
ESULT3.1 Data Set
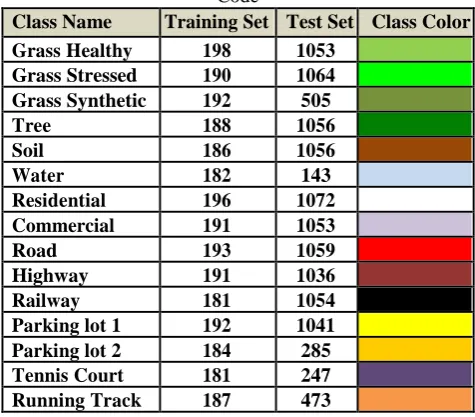
In this paper, we present a fusion method for improvement of classification results on urban areas. The proposed approach was applied on two data sets. A Hyperspectral and a LiDAR derived digital surface model (DSM); both data sets with spatial resolution of 2.5 m which is shown in figure 2. The Hyperspectral consists of 144 spectral bands. The data sets have captured over the University of Houston campus and the neighboring urban area and have been acquired by the National Science Foundation (NSF)- funded Centre for Airborne Laser Mapping (NCALM). The ground truth of this data set which was provided by NCALM have 15 different land cover classes; grass healthy, grass stressed, grass synthetic, tree, soil, water, residential, commercial, road, highway, railway, parking lot 1, parking lot 2, tennis court, running track. These classes are shown in table 1.
(a)
(b)
Fig.2. Data sets: a) hyperspectral Image, b) LiDAR derived DSM
Table 1: Classes, Training and Test Samples, and Color Code
Class Name Training Set Test Set Class Color
Grass Healthy 198 1053 Grass Stressed 190 1064 Grass Synthetic 192 505
Tree 188 1056
Soil 186 1056
Water 182 143
Residential 196 1072
Commercial 191 1053
Road 193 1059
Highway 191 1036
Railway 181 1054
Parking lot 1 192 1041
Parking lot 2 184 285
Tennis Court 181 247
Running Track 187 473
3.2 Results and Experiment
Copyright © 2015 IJECCE, All right reserved (a) Image height of the first pulse LiDAR data returns
(b) Image height of the last pulse LiDAR data returns
(c) Image Intensity of the first pulse LiDAR data returns
(d) Image Intensity of the last pulse LiDAR data returns Figure 3. Some of extracted features on LiDAR data
In next step, classification based on SVM is applied on hyperspectral and LiDAR data. After classification of hyperspectral and LiDAR data, majority voting will be applied on the outputs of the classifiers as classifier fusion method.
To investigate the effects of mining in data fusion and the using them individually, the results of feature extraction are investigated in four different modes: (a) feature extraction from hyperspectral images with 19 spectral bands with the voting results of the class of seven different method of svm, (b) feature extraction from four images LiDAR data with voting between seven different methods of svm, (c) feature extraction from LiDAR and hyperspectral image data fusion using a svm, (d) feature extraction from LiDAR and hyperspectral image data fusion with voting between seven different methods of svm, are illustrated in Figure 4. Table 2 and 3 illustrates the accuracies of classification results on all fifteen classes of data sets in four different modes. Figure 5(d) demonstrates the classifier fusion strategy on hyperspectral and LiDAR data.
(a)
(b)
(c)
(d)
Fig.4. results of feature extraction are investigated in four different modes
Table 2: Overall Accuracy of classification results on all classes
Class Name Mode Mode Mode Mode
(a) (b) (c) (d)
Grass Healthy 97.53 94.07 97.28 98.06 Grass Stressed 99.58 91.24 97.03 99.68 Grass Synthetic 100 98.94 100 100
Tree 99.68 87.25 74.65 100
Soil 99.75 92.97 99.29 99.89
Water 98.02 93.75 96.29 98.02 Residential 98.66 95.02 98.20 99.68 Commercial 91.60 94.07 95.34 100
Road 9866 90.36 98.78 98.94
Highway 99.72 91.35 99.19 99.96 Railway 99.58 91.84 99.54 100 Parking lot 1 98.91 88.42 97.81 99.19 Parking lot 2 97.85 93.29 95.27 99.40 Tennis Court 99.79 95.97 98.87 100 Running Track 99.93 96.93 99.79 100
Table 3: Kappa Coefficient of classification results on all classes
Class Name Mode Mode Mode Mode
(a) (b) (c) (d)
Grass Healthy .773 .537 .745 .829 Grass Stressed .966 .395 .702 .974 Grass Synthetic 1 .911 1 1
Tree .974 .434 .263 1
Soil .98 .466 .939 .991
Water .808 .059 .579 .808
Residential .889 .554 .843 .975 Commercial .56 .418 .455 1
Road .892 .3 .813 .913
Highway .977 .26 .932 .997 Railway .965 .408 .961 1 Parking lot 1 .914 .213 .811 .936 Parking lot 2 .809 .19 .424 .948 Tennis Court .982 .565 .897 1 Running Track .994 .749 .983 1
Copyright © 2015 IJECCE, All right reserved distances lower than 3 pixels on the roof of the buildings
are fixed and their shape will be regular.
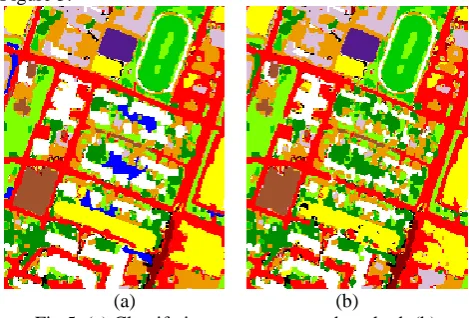
The trees can be divided into two distinct classes: the individual tree and rows of trees. The rest of the vegetation, such as green plants and plant vegetation dry and combination of green and dried plants can be considered in the category of green space that surface range. In order to determine the point or row linearity of the trees, a neighborhood radius around of 5 pixels is considered around each tree. If at least three trees are in a row by using Hough transform, they are as a row of trees. Also, another method for identification of row of trees, is the number of pixels forming the side of the tree considering length to width ratio. If the number of pixels forming the feature of the tree is more than 5 and its width ratio is greater than 3, In that case, this feature is considered as a row of trees. The result is illustrated in Figure 5.
(a) (b)
Fig.5. (a) Classify images to proposed method, (b) Restorative complications are extracted using the definition of the object instead of feature, The only difference is that the feature of tree rows are shown in
blue.
IV.
C
ONCLUSIONFusion of hyperspectral and LiDAR data in decision level is the important aim of our proposed method. In this level, complexities of hyperspectral and LiDAR data are considered. Because HSIs provide a detailed description of the spectral signatures of objects but no information on the height of ground covers, whereas LiDAR data provide detailed information about the height of objects but no information on the spectral signatures. So the elevation information of LiDAR data is very effective for the separation of objects with similar spectral signatures. Also the spectral information of hyperspectral data is very effective for discrimination of similar elevation objects but different spectral information. Based on the results of our proposed method, fusion of classifiers on two data sets improves classification accuracy. The overall accuracy (OA) and kappa coefficient of this strategy are shown in Table 4. Based on these results, proposed classifier fusion on hyperspectral and LiDAR data improves the classification accuracy. The object-based feature extraction in image, of the individual pixels is prevented. In other words, it is possible that pixel-based SVM method
consider different classes for a few pixels that are adjacent to each other, this leads to a rupture in the results. But by using feature extraction method based on object for each individual pixel class finds the nearest neighbors. Because SVM classification method cannot extract the feature continuously. Therefore, due to the reasons provided, to regulate the construction feature and also the extracted continuous road, morphology close transform used with Hough transform. Then be sure to check whether adding images LiDAR to hyperspectral image data is improving or not. If you use the LiDAR image , overall accuracy and kappa coefficient for the classification of 93.03 and .431 respectively and the use of hyperspectral images to a classification of 98.62 and .899 respectively, were calculated. As a result, an increase from .899 to .958 kappa coefficient of hyperspectral image by adding LiDAR data, show a broadly favorable effect of using LiDAR imagery to improve the results of the classification. A comparison of the proposed method and tournament favorite institution is given in Table 4. a. The selected method of data integration in international competition IEEE.
b. Hyperspectral imaging with seven SVM. c. LiDAR imaging with seven SVM.
d. Hyperspectral and LiDAR imaging with one SVM. e. Hyperspectral and LiDAR imaging with seven SVM. f.
Table 4
a b c d e
Overall 90.03 98.62 93.03 90.49 99.52
Accuracy
Kappa .895 .899 .431 .757 .958 Coefficient
R
EFERENCES[1] G.Simone, A.Farina, F.C.Morabito, S.B.Serpico and L.Bruzzone. “Image Fusion Techniques For Remote Sensing Applications”,
Technical Report # DIT-02-0025, Also: appeared on Information Fusion, Vol. 3, No. 2, March 2002.
[2] Pohl, C. and Van Genderen, J.L. (1998), “Review article Multi sensor image fusion in remote sensing: concepts, methods and applications,” International Journal of Remote Sensing, 19(5),
pp. 823-854.
[3] Esteban, J., Starr, A., Willetts, R., Hannah, P. and Bryanston- Cross, P. (2004), “A review of data fusion models and architectures: Towards engineering guidelines,” Journal of
Neural Computing and application, 14(4), pp. 273-281. [4] Du, P., Liu, S., Xia, J., Zhao, Y., 2013. “Information fusion
techniques for change detection from multi temporal remote sensing images”. Information Fusion, 14(1), 19-27.
[5] Dong, J., Zhuang, D., Huang, Y., Fu, J., 2009. “Advances in Multi-Sensor Data Fusion: Algorithms and Applications.”
Journal of Sensors, 9(10), 7771-7784.
[6] Yun, Z., 2004. Understanding image fusion. Photogrammetry Engineering and Remote Sensing, 6(1), 657–661.
[7] Lam, L. and Suen, S.Y., 1997. Application of majority voting to pattern recognition: an analysis of its behvior and performance. IEEE Transactions on Systems, Man, and Cybernetics – Part A: Systems and Humans, 27 (5), 553–568. doi: 10.1109/3468.618255.
Copyright © 2015 IJECCE, All right reserved
[9] Lin, X., et al., 2003. Performance analysis of pattern classifier combination by plurality voting. Pattern Recognition Letters, 24, 1959–1969. doi:10.1016/S0167-8655(03)00035-7.
[10] Rahman, A.F.R., Alam, H., and Fairhurst, M.C., 2002. Multiple classifier combination for character recognition: revisiting the majority voting system and its variations. In: IAPR workshop on document analysis systems, Vol. 2423, August 2002 Princeton, NJ. Berlin: Springer, 167–178.
[11] Kuncheva, L., 2004. Combining pattern classifiers methods and algorithms. Hoboken, NJ: John Wiley & Sons.
[12] Littlestone, N. and Warmuth, M., 1994. The weighted majority algorithm. Information and Computation, 108, 212–261. doi:10.1006/inco.1994.1009.
[13] Benediktsson, J.A. and Kanellopoulos, I., 1999. Classification of multisource and hyperspectral data based on decision fusion. IEEE Transactions on Geoscience and Remote Sensing, 37 (3), 1367– 1377. doi:10.1109/36.763301.
[14] Zheng, M.M., Krishnan, S.M., and Tjoa, M.P., 2005. A fusion-based clinical decision support for disease diagnosis from endoscopic images. Computers in Biology and Medicine, 35, 259 274.doi:10.1016/j.compbiomed.2004.01.002.
[15] McArthur, S.D.J., Strachan, S.M., and Jahn, G., 2004. The design of a multi-agent transformer condition monitoring system. IEEE Transactions on Power Systems, 19 (4), 1845–1852. doi:10.1109/TPWRS.2004.835667.
[16] Parikh, C.R., Pont, M.J., and Jones, N.B., 2001. Application of Dempster–Shafer theory in condition monitoring applications: a case study. Pattern Recognition Letters, 22, 777– 785.doi:10.1016/ S0167-8655(01)00014-9.
[17] Parikh, C.R., et al., 2003. Improving the performance of CMFD applications using multiple classifiers and a fusion framework. Transactions of the Institute of Measurement and Control, 25 (2), 123–144. doi:10.1191/0142331203tm080oa.
[18] Huang, Y.S. and Suen, C.Y., 1993. Behavior-knowledge space method for combination of multiple classifiers. In: Proceedings of IEEE computer vision and pattern recognition. New York, NY: IEEE, 347–352
[19] Huang, Y.S. and Suen, C.Y., 1995. A method of combining multiple experts for the recognition of unconstrained handwritten numerals. IEEE Transactions on Pattern Analysis and Machine Intelligence, 17 (1), 90–94. doi:10.1109/34.368145.
[20] Kuncheva, L.I., Bezdek, J.C., and Duin, R., 2001. Decision templates for multiple classifier fusion: an experimental comparison. Pattern Recognition, 34 (2), 299–314. doi:10.1016/S0031-3203 (99)00223-X.
[21] Simone, G., et al., 2002. Image fusion techniques for remote sensing applications. Information Fusion, 3 (1), 3–15. doi:10.1016/S1566-2535(01)00056-2.
[22] Hsu, S. and Burke, H., 2003. Multisensor fusion with hyperspectral imaging data detection and classification. Lincoln Laboratory Journal, 14 (1), 145–159.
[23] Simental, E., Ragsdale, D. J., Bosch, E., Dodge, R., Jr., and Pazak, R., “Hyperspectral dimension reduction and elevation data for supervised image classification,” in Proc. 14th ASPRS Conf., Anchorage, AK, May 3-9, 2003.
[24] Lemp, D. and Weidner, U., “Improvements of roof surface classification using hyperspectral and laser scanning data,” in
Proc. ISPRS Joint Conf.: 3rd Int. Symp. Remote Sens. Data Fusion Over Urban Areas (URBAN), 5th Int. 8
[25] Symp. Remote Sens. Urban Areas (URS), Tempe, AZ, Mar. 14– 16, 2005.
[26] Dalponte, M., Bruzzone, M., Gianelle, D., “Fusion of Hyperspectral and LIDAR Remote Sensing Data for Classification of Complex Forest Areas,” IEEE Trans. Geosci. Remote Sens., vol. 46, no. 5, pp. 1416–1427, May 2008. [27] Zhao, B., Zhong, Y., Zhao, J. and Zhang L. (2013), Outcome of
the “Best Classification Challenge” of the 2013 IEEE GRSS