Turkish Journal of Fisheries and Aquatic Sciences 17: 735-744 (2017)
www.trjfas.org ISSN 1303-2712 DOI: 10.4194/1303-2712-v17_4_09
RESEARCH PAPER
© Published by Central Fisheries Research Institute (CFRI) Trabzon, Turkey in cooperation with Japan International Cooperation Agency (JICA), Japan
Relationship between Seasonal Variations in Body and Proximate
Compositions of Chub Mackerel
Scomber japonicas
from the Korean Coast
Introduction
In Korea, the per capita consumption of fish and shellfish was 54.9 kg/person in 2013, with 3.9 g of mackerel Scombridae spp. being consumed per person per day, according to the nutrition surveys of people in Korea in 2013 (NOAA, 2014; KCDC, 2014; Kweon et al., 2014). Mackerel, one of the most important commercial fishes in the Pacific Ocean (Cha et al., 2010), has good flavor and is inexpensive. Accordingly, annual chub mackerel Scomber japonicus catches were 150,762 M/T in 2011 but decreased to 131,206 M/T in 2014 (KSIS, 2014).
Mackerel are widespread in subtropical and tropics fishing zones and age caught by the general fishing industry. However, although production cannot be planned owing to variable climate changes, chub mackerel are caught all-round the year, with the highest and lowest Korean production recorded in November and May, respectively (Hwang, Kim, & Lee, 2008). In Korea, closure of fishing seasons from the end of April and early May rely on participation of cooperating fishermen to conserve resources. Although this season is widely known as the spawning period, some mackerel are continually
harvested due to the absence of regulations. The nutritional quality of fish might be influenced by various factors including types of feed sexual cycle, age, stage of maturity, environment, organs and spawning periods (Norouzi, & Bagheri, 2015; Roy & Lall, 2006). Specifically, multiple mackerel fish oils have been identified, and this fish represents one of the most important natural sources of polyunsaturated fatty acids, including eicosapentaeoic acid and docosahexaenoic acid, which have demonstrated beneficial effects on human health (Boran & Karaçam, 2011; Saoud, Batal, Ghanawi, & Lebbos, 2008; Rafflenbeul, 2001). The knowledge of proximate composition of fish species is important for applying technological processes to ensure quality of raw materials, sensory attributes, and storage stability (Isam et al., 2013; Huss, 1988).
Lipids, the primary energy storage material in fish, are stored as surplus energy for future maintenance, growth, and reproduction (Edirisinghe, Cumaranatunga, Radampola, & Kirindearachchige, 2013). However, lipid content of marine fish was subject to differ with size, sex, maturity, and sampling locations (Edirisinghe et al., 2013). Lipid appears to be the component most affected by these factors
Kilbo Shim
1,*, Nayoung Yoon
1, Chiwon Lim
1, Mina Kim
1, Sukyung Kang
2, Kwangho Choi
2,
Taegyun Oh
21 National Institute of Fisheries Science, Food Safety and Processing Research Division, Busan 46083, Korea. 2National Institute of Fisheries Science, Costal Water Fisheries Resources Research Division, Busan 46083, Korea.
* Corresponding Author: Tel.: 82.517 202650; Fax:82.517 202669 ; E-mail: kilbo1221@korea.kr
Received 02 August 2016 Accepted 03 January 2017
Abstract
Seasonal variations of proximate and body compositions of chub mackerel Scomber japonicus from the coastal waters of Korea were correlated with gonad morphology were determined in this study. Crude lipid content was 4.99–19.27 g/100 g, with the highest and lowest values observed in December and March, respectively. Correlations (r2 values) with total length,
body weight, and crude lipid content were relatively high (0.71–0.81) from September to December. In subsequent group analyses of total length (<25, 25–30, 30–35, 35–40, and >40 cm), crude lipid content trends were investigated, and number of mackerel with total length of >35 cm was the lowest at the start of spawning season in April. In addition, the highest gonadosomatic index (GSI) was observed at this time, and it differed significantly in <35 cm long mackerel from that during the other months. Crude protein content was also the highest in April and was strongly associated with total length and body weight. Moreover, GSI was correlated with crude protein content, with r2 values of 0.72 in April and 0.59 in May. Thus,
seasonal variations in proximate composition were intimately related with the spawning season and total length of mackerel was coincided with the maturation stage of the fish.
736 K. Shim et al. / Turk. J. Fish. Aquat. Sci. 17: 735-744 (2017)
owing to energy demands associated with overwintering starvation in juvenile and mature fish and eventual gonad maturation in sexually mature fish. However, although protein and ash content are also associated with energy demands, they are not as dynamic as lipids (Brown & Murphy, 1991). Fish body composition is generally assessed using chemical proximate analyses to indirectly monitor lipid and protein levels at various stages of growth (Brown & Murphy, 1991). Accordingly, crude lipid content and lipid types are important descriptors of food quality; in addition, fish protein has high nutritional value as an excellent source of the essential amino acids lysine and methionine.
In the present study, seasonal variations in proximate composition and size of mackerel were recorded and empirical relationships between body composition, total length, body weight and gonadosomatic index (GSI) of females were determined. In addition, we discussed relative prey values based on variations in body composition and relative spawning.
Material and Methods
Sample Collection
Chub mackerel Scomber japonicus were caught from the south sea in Korea off the coast of Jeju island between March 2012 and February 2013 (Figure 1) and a total of 480 samples were collected from the Busan cooperative fish market at 40 samples/month according to the scale size (Table 1).
Total length, body weight, sexes, and gonad weight (GW) of all fish samples were determined. Subsequently, GSI was calculated as the gonad proportion of total body weight (Borge & Gordo, 1991).
Proximate Composition
Moisture content was determined by drying the fish in an oven at 105°C until a constant weight was obtained (AOAC, 1995). Crude protein content was calculated by converting nitrogen content by the Kjeldahl method (6.25 × N, Gerhardt Kjeldahl Nitrogen Equipment, Gerhardt GmbH & Co., Königswinter, Germany) (AOAC, 1995). Crude lipid content was determined using the method described by the AOAC using a Soxhlet system (ST243 Soxtec, FOSS, Hillerød, Denmark). Ash content was determined by dry ashing in a furnace oven at 525°C for 24 h.
Statistical Analyses
Data were analyzed using analysis of variance (ANOVA) with a general linear model procedure. Differences between means were identified using Duncan’s multiple-range test (P<0.05). Relationships between proximate and body compositions were identified using Pearson’s correlation coefficients. Differences and correlations were considered significant when <0.05 or <0.01 were obtained. All statistical analyses were performed using SAS for windows (SAS Enterprise Guide 4.3)
Results
Seasonal Variations in Proximate Composition
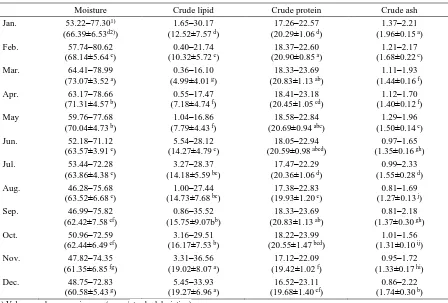
Seasonal variations in proximate composition of mackerel from the southern coastal areas of Korea are shown in Table 2. The average moisture content in March was 73.07 g/100 g and was the highest during the year. Moisture content decreased gradually thereafter to 60.58 g/100 g in December and then increased progressively during January (66.39 g/100 g) and February (68.14 g/100 g).
Moisture was decreased from April and reached minimum in December followed by increase in March. However, moisture content was negatively correlated with crude lipid content, which was lowest at 4.99 g/100 g in March and increased to 7.18 and 7.83 g/100 g in April and May, respectively. Moreover, crude lipid content was 14.2–15.74 g/100 g from June to September and did not vary significantly. In contrast, crude lipid content was the highest in November and December (19.01 and 19.26 g/100 g, respectively), and it decreased to 12.52 and 10.32 g/100 g in January and February, respectively. Crude protein content was 19.42–20.90 g/100 g; it was the highest in February (20.90 g/100 g). Protein content increased in the March and decreased in April to reach minimum in November. Ash content was
1.26–1.96 g/100 g. It was the highest in November and lowest in August; it decreased from January to August, followed by an increase in November and remained unchanged in December.
Relationship between Crude Lipid Content and Body Composition Parameters
Distribution of crude lipid content, total length, and body weight are shown Figures 2 and 3. During January, the minimum and maximum crude lipid content was 1.65 g/100 g and 30.17 g/100 g, respectively. However, the maximum crude lipid content was low in February (15 g/100 g) and no significant correlation was observed between total length and crude lipid content. In contrast, maximum crude lipid content in May was similar to that in March and April (Figures 2 and 3). Moreover, crude lipid content tended to correlate with total length from June to February. After grouping mackerel by length (<25, 25–30, 30–35, 35–40, and >40 cm), crude lipid content (Figure 4) of <25 cm long mackerel caught in April, May, and July was 0.53–2.17 g/100 g, with no significant seasonal variations observed (Figure 4A). However, crude lipid content in 25–30 cm long mackerel was 3.06–3.87 g/100 g from January to April, but was maximally 5.82 g/100 g in March.
In July, the lowest crude lipid content (1.16
Table 1. Profiles of chub mackerel samples from the Korean coast
Season
Total length Body length Body weight Sex No. M F Immature
Jan. 25.9–40.8 (34.0±4.2)
23.8–37.4 (31.5±3.8)
103.5–790.6 (418.2±199.4)
8 32 - 40
Feb. 25.7–40 (34.4±4.7)
23.6–36.7 (31.6±4.4)
123.5–678.4 (425.2±188.2)
6 21 13 40
Mar. 26.1–42.1 (35.0±3.6)
23.8–38.2 (32.1±3.4)
138.8–683.7 (411.4±147.5)
13 27 - 40
Apr. 22.1–41.4 (32.5±5.2)
20.2–37.6 (29.6±4.8)
82.6–836.6 (362.9±201.5)
20 20 - 40
May 22.0–39.6 (32.5±5.1)
20.0–35.8 (29.6±4.6)
96.3–761.9 (409.0±195.0)
19 21 - 40
Jun. 27.0–40.0 (34.8±3.2)
25.5–36.7 (32.1±2.8)
184.8–702.6 (469.0±141.3)
11 29 - 40
Jul. 20.90–39.80 (32.4±5.0)
19.0–36.5 (29.5±4.4)
67.70–767.80 (359.4±180.4)
5 35 10 50
Aug. 25.3–40.0 (34.4±4.8)
23.3–36.2 (31.6±4.3)
135.3–795.1 (459.3±198.1)
0 40 - 40
Sep. 30.7–42.7 (36.1±3.2)
28.2–39.1 (33.0±2.9)
283.9–848.3 (515.2±161.2)
16 24 - 40
Oct. 28.1–41.0 (35.5±3.5)
25.9–27.2 (32.6±3.2)
186.1–778.4 (488.6±159.2)
15 25 - 40
Nov. 26.0–40.8 (35.9±4.2)
23.5–37.9 (32.8±3.9)
106.2–757.4 (500.0±191.2)
1 39 - 40
Dec. 29.9–41.7 (36.0±3.5)
27.1–38.0 (33.1±3.0)
254.6–863.4 (503.2±170.5)
738 K. Shim et al. / Turk. J. Fish. Aquat. Sci. 17: 735-744 (2017)
g/100 g) was observed and total fish length was <25.5 cm (Figure 4B). Among 30–35 cm long fish, crude lipid content was the lowest in March (6.77 g/100 g) and highest in September (27.39 g/100 g; Figure 4C). In contrast, among 35–40 cm long fish, crude lipid content was the lowest in April (6.46 g/100 g) and ranged between 19.17 and 21.06 g/100 g from July to December (Figure 4D); it differed significantly between spring season (March to April) and all other seasons. Finally, >40 cm long mackerel were caught only in January, March, April, September, October, November, and December and had crude lipid content of 19.17–21.06 g/100 g (Figure 4e).
Relationships between Proximate Composition and Body Composition Parameters
Relationships between moisture, crude protein, and crude lipid content of mackerel was stratified by total length and body weight (Table 3). In these analyses, moisture content was negatively correlated with crude lipid content, total length, and body weight. In particular, the correlation coefficient (r2) of
moisture content with total length in March, April, and June was −0.34, −0.60, and −0.53 and that with body weight was −0.36, −0.61, and −0.56, respectively. Except that month, relationship between total length and body weight corresponds to a very negative correlation and is high significant
relationship which was −0.70, −0.80, −0.67, and −0.88. These correlations were the weakest in March and the strongest in July.
Crude lipid content was positively correlated with total length and body weight from January to March, with r2 values of 0.7–0.8 and 0.62–0.82,
respectively. In April, these correlation coefficients decreased to 0.46 and 0.43, respectively, and in May, they restored to 0.74 and 0.75 and to 0.51 and 0.55 in June, respectively. Significant linear relationships between total length and crude lipid content and between body weight and crude lipid content were observed from July to December (r2 = 0.71–0.83 and
0.78–0.87, respectively). Crude protein content was also positively correlated with total length and body weight in March (r2 = 0.73 and 0.70, respectively).
However, these correlation coefficients were weakened in April and May to 0.56 and 0.51, and 0.60 and 0.53, respectively, and they were negative from July (r2 = −0.77 and −0.74, respectively).
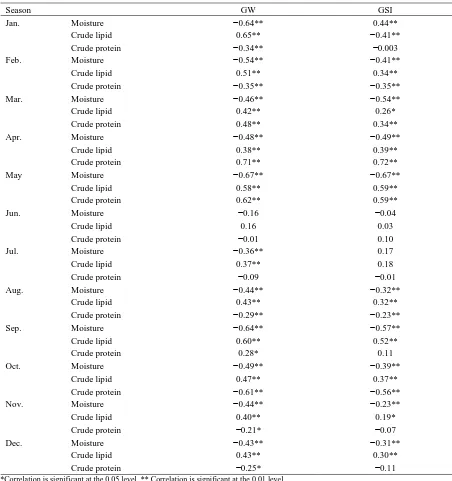
Relationships between Proximate Composition, GW, and GSI
Relationships between proximate composition, GW, and GSI of female mackerel are presented in Table 4. In these analyses, moisture content was negatively correlated with GW, with r2 values of -0.65
– -0.16 over the entire year. This relationship was the
Table 2. Monthly changes in proximate composition of chub mackerel from the Korean coast
Moisture Crude lipid Crude protein Crude ash Jan. 53.22–77.301)
(66.39±6.53d2))
1.65–30.17 (12.52±7.57 d)
17.26–22.57 (20.29±1.06 d)
1.37–2.21 (1.96±0.15 a)
Feb. 57.74–80.62 (68.14±5.64 c)
0.40–21.74 (10.32±5.72 e)
18.37–22.60 (20.90±0.85 a)
1.21–2.17 (1.68±0.22 c)
Mar. 64.41–78.99 (73.07±3.52 a)
0.36–16.10 (4.99±4.01 g)
18.33–23.69 (20.83±1.13 ab)
1.11–1.93 (1.44±0.16 f)
Apr. 63.17–78.66 (71.31±4.57 b)
0.55–17.47 (7.18±4.74 f)
18.41–23.18 (20.45±1.05 cd)
1.12–1.70 (1.40±0.12 f)
May 59.76–77.68 (70.04±4.73 b)
1.04–16.86 (7.79±4.43 f)
18.58–22.84 (20.69±0.94 abc)
1.29–1.96 (1.50±0.14 e)
Jun. 52.18–71.12 (63.57±3.91 e)
5.54–28.12 (14.27±4.79 c)
18.05–22.94 (20.59±0.98 abcd)
0.97–1.65 (1.35±0.16 gh)
Jul. 53.44–72.28 (63.86±4.38 e)
3.27–28.37 (14.18±5.59 bc)
17.47–22.29 (20.36±1.06 d)
0.99–2.33 (1.55±0.28 d)
Aug. 46.28–75.68 (63.52±6.68 e)
1.00–27.44 (14.73±7.68 bc)
17.38–22.83 (19.93±1.20 e)
0.81–1.69 (1.27±0.13 j)
Sep. 46.99–75.82 (62.42±7.58 ef)
0.86–35.52 (15.75±9.07bb)
18.33–23.69 (20.83±1.13 ab)
0.81–2.18 (1.37±0.30 gh)
Oct. 50.96–72.59 (62.44±6.49 ef)
3.16–29.51 (16.17±7.53 b)
18.22–23.99 (20.55±1.47 bcd)
1.01–1.56 (1.31±0.10 ij)
Nov. 47.82–74.35 (61.35±6.85 fg)
3.31–36.56 (19.02±8.07 a)
17.12–22.09 (19.42±1.02 f)
0.95–1.72 (1.33±0.17 hi)
Dec. 48.75–72.83 (60.58±5.43 g)
5.45–33.93 (19.27±6.96 a)
16.52–23.11 (19.68±1.40 ef)
0.86–2.22 (1.74±0.30 b) 1) Values are shown as min–max (mean±standard deviation)
strongest in January and September and the lowest in June. In contrast, crude lipid content and GSI showed r2 values of 0.19–0.59 over the entire year, and these
values were maximum in May and minimum in June. Specifically, correlations of crude protein content with GW and GSI showed r2 values of 0.71
and 0.72, respectively, in April and 0.58 and 0.59, respectively, in May, and they did not vary significantly between June and April of the following year but were increased to 0.48 and 0.34, respectively, since March.
Discussion
Chub mackerel from the Korean coast start maturing in March, and spawning occurs primarily in May and is finished by June (FAO, 2000; Hwang et al., 2008). Fishing intensity in the Korean purse-seine fishery was high during December to February (when
chub mackerel aggregate on the wintering ground) and was low during April to July (during spawning and northward migration) (Hwang et al., 2008).
According to Borges and Gordo (1991) the spawning season of this species occurs during the first semester of the year and reflects low crude lipid content. Hence, large variations in proximate composition of fish species reflects physiological processes and changes in environmental conditions that together dictate spawning, migration, and starvation or heavy feeding activities (Boran & Karaçam, 2011; Costa, 2013).
Previous analyses of seasonal variations in crude lipid content of mackerel S. scombrus L from the western English Channel showed that the lowest mean fat content occurs in May. This study also showed that feeding resumes in May/June and fat reserves accumulate throughout the summer, culminating in high mean crude lipid content at the end of the year in
Total length (cm)
0 20 25 30 35 40 45
Cr u d e li p id (g/ 100g ) 0 5 10 15 20 25 30 35 40 K
Total length (cm)
0 20 25 30 35 40 45
Cr u d e li p id (g/ 100g ) 0 5 10 15 20 25 30 35 40 L
Total length (cm)
0 20 25 30 35 40 45
Cr u d e li p id (g/ 100g ) 0 5 10 15 20 25 30 35 40 J
Total length (cm)
0 20 25 30 35 40 45
Cr u d e li p id (g/ 100g ) 0 5 10 15 20 25 30 35 40 E
Total length (cm)
0 20 25 30 35 40 45
Cr u d e li p id (g/ 100g ) 0 5 10 15 20 25 30 35 40 H
Total length (cm)
0 20 25 30 35 40 45
Cr u d e li p id (g/ 100g ) 0 5 10 15 20 25 30 35 40 I Total length (cm)
0 20 25 30 35 40 45
Cr u d e li p id (g/ 100g ) 0 5 10 15 20 25 30 35 40 F
Total length (cm)
0 20 25 30 35 40 45
Cr u d e li p id (g/ 100g ) 0 5 10 15 20 25 30 35 40 G Total length (cm)
0 20 25 30 35 40 45
Cr u d e li p id (g/ 100g ) 0 5 10 15 20 25 30 35 40 D Total length (cm)
0 20 25 30 35 40 45
Cr u d e li p id (g/ 100g ) 0 5 10 15 20 25 30 35 40 A
Total length (cm)
0 20 25 30 35 40 45
Cr u d e li p id (g/ 100g ) 0 5 10 15 20 25 30 35 40 B
Total length (cm)
0 20 25 30 35 40 45
Cr u d e li p id (g/ 100g ) 0 5 10 15 20 25 30 35 40 C
740 K. Shim et al. / Turk. J. Fish. Aquat. Sci. 17: 735-744 (2017)
Body weight (g)
0 100200 300400 500600 700 800900 1000
Cr u d e li p id (g/ 100g ) 0 5 10 15 20 25 30 35 40 J
Body weight (g)
0 100 200 300400 500600 700800 900 1000
Cr u d e li p id (g/ 100g ) 0 5 10 15 20 25 30 35 40 K
Body weight (g)
0 100 200300 400500 600700 800 900 1000
Cr u d e li p id (g/ 100g ) 0 5 10 15 20 25 30 35 40 L Body weight (g)
0 100200 300400 500600 700 800900 1000
Cr u d e li p id (g/ 100g ) 0 5 10 15 20 25 30 35 40 G
Body weight (g)
0 100 200 300400 500600 700800 900 1000
Cr u d e li p id (g/ 100g ) 0 5 10 15 20 25 30 35 40 H
Body weight (g)
0 100 200300 400500 600700 800 900 1000
Cr u d e li p id (g/ 100g ) 0 5 10 15 20 25 30 35 40 I Body weight (g)
0 100200 300400 500600 700 800900 1000
Cr u d e li p id (g/ 100g ) 0 5 10 15 20 25 30 35 40 D
Body weight (g)
0 100 200 300400 500600 700800 900 1000
Cr u d e li p id (g/ 100g ) 0 5 10 15 20 25 30 35 40 E
Body weight (g)
0 100 200300 400500 600700 800 900 1000
Cr u d e li p id (g/ 100g ) 0 5 10 15 20 25 30 35 40 F Body weight (g)
0 100200 300400 500600 700 800900 1000
Cr u d e li p id (g/ 100g ) 0 5 10 15 20 25 30 35 40 A
Body weight (g)
0 100 200 300400 500600 700800 900 1000
Cr u d e li p id (g/ 100g ) 0 5 10 15 20 25 30 35 40 B
Body weight (g)
0 100 200300 400500 600700 800 900 1000
Cr u d e li p id (g/ 100g ) 0 5 10 15 20 25 30 35 40 C
Figure 3. Scatter plots of the relationship between crude lipid content and body weight of chub mackerel from Korean coastal areas. A-L refer to the months from January to December.
fish of all length and weight categories. Subsequently, fat content gradually decrease through the winter, reflecting limited feeding and use of fat energy stores. Maturing mackerel then begin to move from their wintering areas towards spawning grounds and gonads are enlarged in preparation (Wallace, 1991).
In a previous study, crude lipid content of Indian mackerel Restrelliger kanagurta from the shallow waters of Pakistani coastal areas was the highest in December and the lowest in January and June (Nisa and Ksadullah, 2011). Moreover, crude lipid content was the lowest and protein content the highest during the primary spawning season in March. In addition,
proximate composition was closely correlated with the spawning season and rates of recovery after spawning depended on feeding conditions, reportedly reflecting depletion of stock energy during spawning (Love, 1970).
In the present study, correlations between crude lipid content and total length were the lowest in March; in contrast, correlations between crude lipid and crude protein content was higher in March than in other months. Moreover, number of >35-cm long mackerel was the lowest in April, but it did not significantly vary in case of <35-cm long mackerel between January and June. Previous studies on
Table 3. Pearson’s correlation coefficients of proximate and body composition variables
Season Total length Body weight Sex
Jan. Moisture −0.75** −0.67** −0.34**
Crude lipid 0.70** 0.62** 0.34**
Crude protein −0.40** −0.50** −0.27**
Feb. Moisture −0.82** −0.82** 0.54**
Crude lipid 0.80** 0.82** −0.47**
Crude protein 0.09 0.03 0.15
Mar. Moisture −0.34** −0.36** 0.17
Crude lipid 0.77** 0.82** 0.20*
Crude protein 0.73** 0.70** −0.03
Apr. Moisture −0.60** −0.61** −0.27**
Crude lipid 0.46** 0.49** 0.24**
Crude protein 0.56** 0.57** 0.03
May Moisture −0.8** −0.81** −0.01
Crude lipid 0.74** 0.75** 0
Crude protein 0.51** 0.53** −0.08
Jun. Moisture −0.53** −0.56** −0.05
Crude lipid 0.51** 0.55** 0.04
Crude protein −0.30** −0.37** −0.07
Jul. Moisture −0.85** −0.88** 0
Crude lipid 0.83** 0.87** 0
Crude protein −0.38** −0.43** 0.07
Aug. Moisture −0.74** −0.79** 0.16
Crude lipid 0.71** 0.78** −0.15
Crude protein −0.33** −0.45** 0.15
Sep. Moisture −0.79** −0.82 0.30**
Crude lipid 0.77** 0.81** −0.29**
Crude protein 0.60** 0.62** −0.25**
Oct. Moisture −0.78** −0.77** 0.28**
Crude lipid 0.78** 0.76** −0.29**
Crude protein −0.77** −0.74** 0.41**
Nov. Moisture −0.83** −0.86** 0.30**
Crude lipid 0.77** 0.80** −0.30**
Crude protein −0.42** −0.48** 0.38**
Dec. Moisture −0.70** −0.77** −0.34**
Crude lipid 0.71** 0.77** 0.35**
Crude protein −0.53** −0.60** −0.26**
742 K. Shim et al. / Turk. J. Fish. Aquat. Sci. 17: 735-744 (2017)
mackerel from the Pacific coast showed that fork length was 28–30 cm among females of 50% maturity at 1–3 years of age (Hwang et al., 2008; Usami, 1973). Among these fish, seasonal variations in crude lipid content in <35 cm long mackerel were not significant, reflecting inability to spawn.
GSI increases with maturation of fish and is the highest during spawning, and it decrease after spawning (Iqbal and Batool, 2013; Alam and Pathak, 2010; Lone and Hussain, 2009). Moreover, because maximum GSI values indicate peak maturity, these can generally be used to estimate reproductive conditions (Stoumboudi, Villvock, Sela, & Abraham,
1993). Accordingly, relationships between proximate composition and total length, body weight, GW, and GSI of female S. japonicus mackerel were significant in the present study. However, crude lipid content was not strongly correlated with GSI, and crude protein content was only significantly elevated in March. Moreover, although GSI was only weakly correlated with total length in January and February, it increased from March to May. Similarly, GW was highly correlated with total length during March to May, and significant seasonal variations in maximum GSI were previously reported during the same months (Hwang & Lee, 2005; Cha et al., 2002). Accordingly, larger
Table 4. Pearson’s correlation coefficients of proximate composition, gonad weight (GW) and gonadosomatic index (GSI)
Season GW GSI
Jan. Moisture −0.64** 0.44**
Crude lipid 0.65** −0.41**
Crude protein −0.34** −0.003
Feb. Moisture −0.54** −0.41**
Crude lipid 0.51** 0.34**
Crude protein −0.35** −0.35**
Mar. Moisture −0.46** −0.54**
Crude lipid 0.42** 0.26*
Crude protein 0.48** 0.34**
Apr. Moisture −0.48** −0.49**
Crude lipid 0.38** 0.39**
Crude protein 0.71** 0.72**
May Moisture −0.67** −0.67**
Crude lipid 0.58** 0.59**
Crude protein 0.62** 0.59**
Jun. Moisture −0.16 −0.04
Crude lipid 0.16 0.03
Crude protein −0.01 0.10
Jul. Moisture −0.36** 0.17
Crude lipid 0.37** 0.18
Crude protein −0.09 −0.01
Aug. Moisture −0.44** −0.32**
Crude lipid 0.43** 0.32**
Crude protein −0.29** −0.23**
Sep. Moisture −0.64** −0.57**
Crude lipid 0.60** 0.52**
Crude protein 0.28* 0.11
Oct. Moisture −0.49** −0.39**
Crude lipid 0.47** 0.37**
Crude protein −0.61** −0.56**
Nov. Moisture −0.44** −0.23**
Crude lipid 0.40** 0.19*
Crude protein −0.21* −0.07
Dec. Moisture −0.43** −0.31**
Crude lipid 0.43** 0.30**
Crude protein −0.25* −0.11
mackerel often exceeded the spawning ages, and maturity and GSI are related in chub mackerel from the Korean coast during spawning from April to May. Therefore, <20 cm long juvenile chub mackerel and <35 cm long spawning fish did not show marked variability of proximate composition. Moreover, proximate composition varied significantly with season in <35 cm long adult fish. In particular, crude lipid content was markedly correlated with the seasons, whereas the relationship between total length and crude lipid content was limited during the spawning season.
Taken together, the present data provide evidence for estimates of self-regulation within a closed season of chub mackerel in Korea. Specifically, adult mackerel are likely the most abundant nutrient source, except during the spawning season when catching fish <35 cm in length is prohibited and nutritional value is low.
Conclusion
In the present study, seasonal variations in composition variables were correlated with gonad morphology, and marked correlations of moisture, crude lipid, and crude protein content were identified. Significant linear relationships between total length and crude lipid content and between body weight and crude lipid content were observed from July to December (r2 = 0.71–0.83 and 0.78–0.87,
respectively). The correlations of crude protein content with GW and GSI showed r2 values of 0.71
and 0.72, respectively, in April and 0.58 and 0.59, respectively, in May, and they did not vary significantly between June and April of the following year but were increased to 0.48 and 0.34, respectively, since March. The proximate composition varied significantly with season in >35 cm long adult fish. These analyses indicate high seasonal variability of nutritional components in chub mackerel and the best fish condition, high lipid content, was recorded for those specimens with length of more than 35 cm (TL) that was coincided with the maturation stage of fish.
Acknowledgements
This study was supported by a grant from the National Institute of Fisheries Science (R2016060).
References
Alam, M., & Pathak, J.A. (2010). Assessment of fecundity and gonadosomatic index of a commercially important fish Labeo rohita from Ramganga River.
International Journal of Pharma and Bio Sciences, 1(3), 1-6. Retrieved from http://ijpbs.net/issue-3/42.pdf.
AOAC. (1995). Official method of analysis of AOAC international. 16th. Association of Official Analytical Chemistry, Washington DC. U.S.A., 69-74.
Boran, G., & Karaçam, H., (2011). Seasonal changes in proximate composition of some fish species from the Black sea. Turkish Journal of Fisheries and Aquatic Sciences, 11(1), 1-5.
http://dx.doi.org/10.4194/trjfas. 2011.0101.
Borge, F., & Gordo, L.S. (1991). Spatial distribution by season and some biological parameters of horse mackerel (Trachurus trachurus L) in the Portuguese continental water (Division IXa). ICES. CM. 1991/H, 54,16pp.
Brown, M.L., & Murphy, B.R. (1991). Relationship of relative weight (Wr) to proximate composition of juvenile striped bass and hybrid striped bass. Transactions of the American Fisheries Society, 120(4), 509-518.
http://dx.doi.org/10.1577/15488659 (1991) 120%3C0509:rorwtp%3E2.3.co;2.
Cha, H.K., An, H.S., Choi, J.H., Kang, S.K., Park, J.Y., & Kim, K.K. (2010). Isolation and characterization of polymorphic microsatellite markers for genetic analysis of chub mackerel (Scomber japonicus). Conservation Genetics Resources, 2(1), 7-9. http://dx.doi.org/10.1007/s12686-0009-9123-7. Cha, H.K., Choi, Y.M., Park, J.H., Kim, J.Y., & Sohn, M.H.
(2002). Maturation and spawning of the chub mackerel Scomber japonicas Hottuyn in Korean waters. Journal of the Korean Society of Fisheries Resources, 5(1), 24-33 (In Korean with English abstract).
Costa, A.M. (2013). Somatic condition, growth and reproduction of Hake, Merluccius merluccius L., in the Portuguese Coast. Journal of Marine Science, 3(1), 12-30
http://dx.doi.org/10.4236/ojms.2013. 31002.
Edirisinghe, D.M.A., Cumaranatunga, P.R.T., Radampola, K., & Kirindearachchige, P.T. (2013). Analysis of proximate composition and consumer preference of three reef fish species. Sri Lanka Journal of Aquatic Sciences, 18(1), 27-36.
http://dx.doi.org/10.4038/sljas.v18i0.7037.
FAO. (2000). Synopsis of biological data on the chub mackerel (Scomber japonicas Houttuyn, 1782). FAO Fisheries Synorsis. No. 157. FAO, Rome, Italy. Retrieved FAO Fisheries Synorsis. No. 157. Rome, FAO.
Huss, H.H. (1988). Fresh fish-quality and quality changes, FAO Fisheries Series No. 29, FAO, Rome, Italy, 28-59.
Hwang, S.D., Kim, J.Y., & Lee, T.W. (2008). Age, growth, and maturity of chub mackerel off Korea. North American Journal of Fisheries Management, 28(5), 1414-1425. http://dx.doi.org/10.1577/M07-063.1. Hwang, S.D., & Lee, T.W. (2005). Spawning dates and
early growth of chub mackerel Scomber japonicus as indicated by otolith microstructure of juveniles in the inshore nursery ground. Fisheries Science, 71(5), 1188–1191.
http://dx.doi.org/10.1111/j.1444-2906. 2005.01081.x. Iqbal, A., & Batool, A. (2013). Fecundity of Labeo rohita
(Teleosei: Cyprinidae) reared in earthen pond in Lahore. Canadian Journal of Pure and Applied Sciences, 7(2), 2391-2395. http://www.cjpas.net/wp-content/uploads/pdfs/7/2/previous_previous_issue_12. pdf.
744 K. Shim et al. / Turk. J. Fish. Aquat. Sci. 17: 735-744 (2017)
30, 2016)
Kweon, S.H., Kim, Y.N., Jang, M.J., Kim, Y.J., Kim, K.R., Choi, S.H., Chun, C.M., Khang, Y.H., & Oh, K.W. (2014). Data resource profile: the Korea National Health and Nutrition Examination Survey (KNHANES). International Journal of Epidemiology, 43(1), 69-77. http://dx.doi.org/10.1093/ije/dyt228. Lone, K.P., & Hussain, A. (2009). Seasonal and age related
variations in the ovaries of Labeo rohita (Hamilton, 1822): A detailed gross and histological study of gametogenesis, maturation and fecundity. Pakistan Journal of Zoology, 41(3), 217-239. Retrieved from http://zsp.com.pk/pdf1/217-234%20_8.pdf.
Love, R.M. (1970). The chemical biology of fishes. Academic Press, Inc. London, U.K. 547pp.
Korea Centers for Disease Control and Prevention (KCDC). (2014). Korea Health Statistics 2013. Seoul: Ministry of Health and Welfare of Korea. Retrieved from http://knhanes.cdc.go.kr.
Norouzi, M., & Bagheri, M. (2015). The chemical composition of golden grey mullet Liza aurata in southern Caspian Sea during sexual rest and sexual ripeness. Aquaculture, Aquarium, Conservation & Legislation International Journal of the Bioflux Society, 8(4), 517-525.
Nisa, K., & Asadullah, K. (2011). Seasonal variation in chemical composition of the Indian mackerel (Rastrelliger kanagurta) from Karachi Coast. Iranian Journal of Fisheries Sciences, 10(1), 67-74. Retrieved from http://www.jifro.ir/files/site1/user_files_eb12be/ admin-A-10-1-60-dfd8239.pdf.
NOAA. (2014). Fisheries of the United States 2013. Retrieved from http://www.st.nmfs.noaa.gov/Assets/ commercial/fus/fus13/09_percapita2013.pdf.
Rafflenbeul, W. (2001). Fish for a healthy heart. European Journal of Lipid Science and Technology. 103(5), 315-317.
http://dx.doi.org/10.1002/1438-9312(200105) 103 :5 <315 ::AID-EJLT315>3.0.CO;2-H.
Roy, P.K., & Lall, S. P. (2006). Mineral nutrition of haddock Melanogrammus aeglefinus (L.): a comparison of wild and cultured stock. Journal of Fish Biology, 68(5), 1460-1472.
Saoud, I.P., Batal, M., Ghanawi, J., & Lebbos, N. (2008). Seasonal evaluation of nutritional benefits of two fish species in the eastern Mediterranean Sea. International Journal of Food Science & Technology, 43(3), 538-542.
http://dx.doi.org/10.1111/j.1365-2621.2006. 01491.x. Stoumboudi, M.T., Villvock, W., Sela, J., & Abraham, M.
(1993). Gonadosomatic index in Barbus longiceps,
Capoeta damascina and their natural hybrid (Pisces, Cyrinidae), versus spermatozoan index in parental males. Journal of Fish Biology, 43(6), 865-875. http://dx.doi.org/10.1111/j.1095-649.1993.tb01161.x. Usami, S. (1973). Ecological studies of life pattern of the
Japanese mackerel, Scomber japonicas Houttuyn on the adult of the Pacific subpopulation. Bulletin of Tokai RegionalFisheries Research Laboratory, 76(1), 71-76 (In Japanese with English abstract).