27
Evidence of the existence of
socioeconomic-related inequality in South African diets: A
quantitative analysis of the 2017 General
Household Survey
Coretta M. P. Jonah*, DST-NRF Centre of Excellence in Food Security, University of the
Western Cape, South Africa, [email protected].
Julian D. May, DST-NRF Centre of Excellence in Food Security, University of the Western
Cape, South Africa.
*Correspondence to Coretta M P Jonah, DST-NRF Centre of Excellence in Food Security,
Institute for Social Development, University of the Western Cape. School of Government
Building, Robert Sobukwe Road / Private Bag X17, Bellville (7535), South Africa. Email:
Acknowledgments
The authors would like to thank the DST-NRF Centre of Excellence in Food Security Grant UID: 91490 for funding and Statistics South Africa and Data first for access to GHS data.
Declaration of interests:
Authors declare no competing interests.
Funding
28
Abstract
Introduction
: In South Africa, high levels of chronic undernutrition, especially in children, coexist with increasing rates of obesity and overweight. The quality of diets is often presented as a possible reason for these high levels of malnutrition. Together with the increasing cost of food, high levels of poverty and inequality mean many households are unable to consume a diverse diet.Methods
: We use cross-sectional data from the 2017 General Household Surveys and inequality analysis to study differences in dietary intake at the household level in South Africa. We measure socioeconomic status (SES) using income and a relative asset index. The dietary intake is based on the consumption of ten food groups.Results
: We demonstrate the existence of a consistent pro-rich socioeconomic gradient in food consumption in South Africa, irrespective of the measure of SES used and for all population categories examined. Consumption of grains and sweets is generally high in the country for all socioeconomic groups. Our findings suggest that households in the low SES group reported having a lower consumption of fruits, vegetables and meats; while households with a high SES reported consuming more vegetables, meat, fruits and legumes. Inequality in both diversity and frequency of consuming all categories of food generally favours the rich.Conclusion
: Dietary intake amongst households in higher SES groups tended to be closer to national and global recommendations. Government efforts need to be focused on all social and economic groups to ensure all South Africans have access to healthy and nutritious diets, especially children.29
Introduction
Due to high and rising levels of global inequalities, there is renewed interest in inequalities from both policymakers and academics. Africa’s high levels of poverty and deprivation, are compounded by relatively high level of inequalities. When inequality is measured using the Gini coefficient, a widely used inequality index (Cowell, 2011), the continent records a value of 0.43, compared to an average of 0.39 for other parts of the developing world (UNDP, 2017) and it is rising.
However, the growth in inequality on the continent has not been observed for all countries. While some countries record disproportionately high levels of inequality, thus driving up the average continental average, others continue to remain relatively low (UNDP, 2017). Amongst countries said to have high levels of inequality, South Africa has been named as the most unequal country in the world in economic terms (World Bank and Statistics SA, 2018). It is also identified as a member of the group of countries accounting for the growth in economic inequalities on the African continent (UNDP, 2017).
Where inequalities exist, they are often pervasive and extend beyond income, and economic indicators. High levels of inequalities are often replicated in other dimensions of wellbeing such as; health, education and other social services. Citizens of wealthier countries live longer than those of poorer countries, and within countries, the well-off enjoy better health and nutrition (Pradhan, Sahn and Younger, 2003).
In the specific case of South Africa also, inequalities are not only contained in economic measures; health, education and other essential social services are known to be unequal (Ataguba, Akazili and McIntyre, 2011; Leibbrandt, Finn and Woolard, 2012; Spaull, 2013). Studies show inequalities in malnutrition outcomes that disproportionately affect the poor (May et al., 2014). Ataguba, Akazili and McIntyre (2011) demonstrate socioeconomic gradients in self-reported ill-health in South Africa.
South Africa also grapples with a malnutrition problem at many levels (Shisana et al., 2013; Casale, 2016). Children are chronically malnourished while both women and children record high levels of deficiency in micronutrients such as iron and zinc (Shisana et al., 2013). Undernutrition coexists with high and increasing levels of overweight and obesity (Shisana et al., 2013; Casale and Desmond, 2016). The immediate causes of malnutrition identified by the UNICEF conceptual framework include inadequate dietary intake and diseases (UNICEF, 1990).
Existing studies elsewhere (Darmon and Drewnowski, 2008; Giskes et al., 2010) have shown that individuals with a high socioeconomic status (SES) tend to consume a healthier diet consisting of whole grains, fish, lean meats, vegetables and fruit and low-fat dairy products. On the other hand, individuals with lower SES tend to consume more fats and less fibre (Giskes
et al., 2010). Another measure of a healthy diet is its degree of diversity, often measured by a dietary diversity indicator (Wirt and Collins, 2009). More diverse diets are associated with higher SES individuals (Darmon and Drewnowski, 2008; Giskes et al., 2010).
30 world due to lack of data on actual consumption. This study adds to the existing literature on inequalities in nutrition by examining the extent and nature of inequalities in dietary intake in South Africa. The study is guided by two hypotheses. First, pro-rich inequalities exist in the consumption of a diverse diet by households in South Africa. Second, a socioeconomic gradient exists in the frequency of consumption of various food groups by households in South Africa.
Methods
Study Design
The paper conducts a quantitative cross-sectional analysis of inequality in dietary intake by households, using data from South Africa’s 2017 General Household Survey (GHS).
Data Source
The GHS is nationally representative and the survey has been conducted every year since 2002. It collects information on education, health and social development, housing, household access to services, food security, and agriculture (Stats SA., 2017). The GHS provides data for the measurement of household food insecurity, including variables on consumption of food from ten major food groups. The 2017 GHS uses a two-stage sample design. The first stage samples primary sampling units (PSUs) using a probability proportional to size approach. The second stage applies a systematic sampling technique to sample dwelling units within these PSUs (Stats SA., 2017). In 2017, the national response rate for the survey was 89.1% (Stats SA., 2017).
Variables and data analysis strategy
For our analysis, we combine descriptive tables and charts with the measurement of socioeconomic inequalities using the concentration index (CI). CIs are computed for the total population, and the geographic areas that divide the country into urban, tribal and rural formal.
The concentration index (CI) has been widely applied in inequality measurement outside economics (WHO, 2013), in areas such as health and nutrition. In the area of health, the CI has been applied to answer questions on the distribution of ill health and mortality, health subsidies, and even vaccines (Wagstaff, 2005; Doherty, Walsh and O’Neill, 2014; Rashad and Sharaf, 2015). For all these problems, the CI allowed researchers to not only measure the levels of inequalities but also to provide information on the gradient of inequality, i.e. whether inequalities exhibited are pro-poor or pro-rich.
31 The CI is twice the covariance between the variable of interest in this case, dietary intake, and the rank of the SES measure divided by its mean (WHO, 2013). The index takes a value of zero for perfect equity or the absence of inequality (WHO, 2013). If the variable of interest is a “good” such as dietary intake, a positive value indicates intake for the higher socioeconomic categories and a negative value indicates lower intake in the low socioeconomic categories (WHO, 2013).
The study measures socioeconomic-related inequality in two variables a dietary diversity and a food group consumption frequency score. We generate these two dietary variables from 10 individual questions on the consumption of selected food groups by the household over 24 hours (Stats SA., 2017). While the variables do not measure the quantity of food consumed, it provides information on what and how many times a food item from a specific group was consumed over the reference period. This allows for the generation of diversity measure based on food group counts. It also allows us to determine how many times a household consumed a particular food group over the reference period.
Despite being acknowledged as a key indicator of a high quality diet and validated by numerous researchers (Kennedy et al., 2007; Labadarios, Steyn and Nel, 2011), there is still a lack of consensus on the measurement of dietary diversity (Ruel, 2003a). Researchers in more developed countries, perhaps due to increased access to data, increasingly use more nuanced measures of diversity as opposed to researchers from the developing world (Ruel, 2003b). The most commonly used approach for measuring dietary diversity in developing countries simply counts foods or food groups consumed (Ruel, 2006). Other measures have allocated weights to food groups, and even more refined measurements have included elements of servings of food groups (Ruel, 2003b). Despite the availability of more complicated measures of dietary diversity, perhaps the limitation of data and the simplicity of the food group count approach has probably informed its expansive application in developing countries (Ruel, 2003b). In this study, due to the reliance on secondary survey, data, analysis is limited to the use of a dietary diversity measure that counts food groups consumed at the household level.
The dietary diversity score is derived by adding up the number of the various discrete food groups that were consumed by members of the household (Swindale and Bilinsky, 2006). The dietary diversity measure focuses on the variety of the diet over the 24 hours, irrespective of how many times the household consumed the food item from a specific food group over the period. The food group consumption indicator, on the other hand, adds up the number of times a food group was consumed over the period. Thus, while the dietary diversity score may be used as a quality indicator, the food group consumption frequency score provides a crude indication of both consumption frequency and variety.
Based on the pattern of intake of the food groups in the survey, both the dietary diversity score and the food group consumption frequency score have a theoretical minimum of zero for households who did not eat at all or did not eat anything from all 10 identified food groups during the 24-hour recall period. The dietary diversity score will have a theoretical maximum of 10, indicating the household consumed at least one of each food group, and the food group consumption frequency score’s maximum of 100 suggests a household ate 10 units of each food group over 24 hours.
32 (Stats SA., 2017). Also, due to the imputed nature of the variable, high incomes are under measured. They may provide a distorted measure of inequality since it does not capture the full range of possible incomes. While acknowledging the limitation of the income variable, we triangulate our asset-based measure of inequality using the income variable.
All statistical analyses are conducted using Stata version 12 and the survey sample settings and weights are applied during data analysis.
Results
Sample Descriptive Statistics
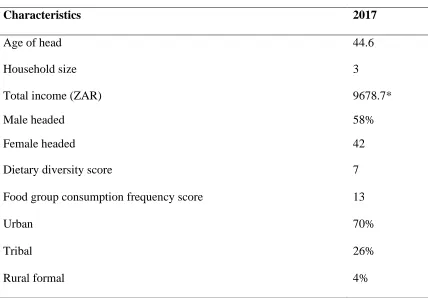
Summary statistics of the final sample of 20,513 households, after data cleaning and generation of all variables, are presented in Table 1.0. The geospatial distribution of the households was approximate: 70%, 26% and 4% for urban, tribal and rural formal areas respectively. 58% of households were male-headed and 42% female-headed. Population group/racial breakdown of the sample, which is self-determined, reflected the following; 80%, 7%, 2% and 10% for black African, Coloured, Indians and White categories, respectively. The average household size was approximately 3, with a minimum of a one-person household and the largest household having 22 members. The dietary diversity score and the food group consumption frequency score had means of approximately 7 and 13, respectively.
Table 1: Summary statistics for survey (n=20513)
Characteristics 2017
Age of head 44.6
Household size 3
Total income (ZAR) 9678.7*
Male headed 58%
Female headed 42
Dietary diversity score 7
Food group consumption frequency score 13
Urban 70%
Tribal 26%
Rural formal 4%
Computed by the authors using data from the 2017 General Household Surveys
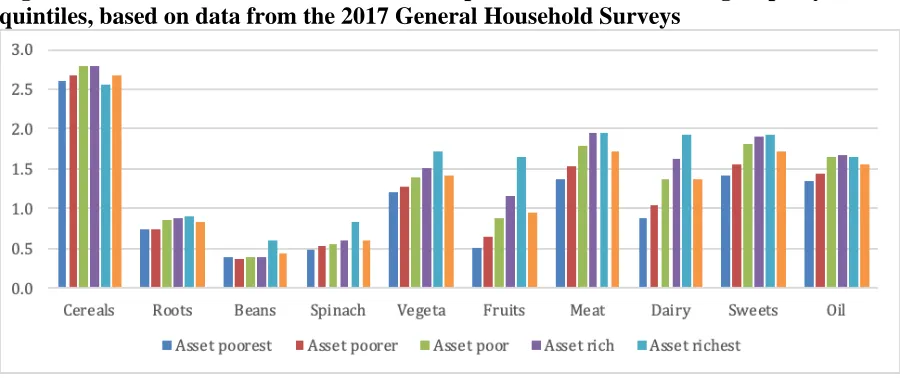
33 Figures 1- 2 show the distribution of food group consumption frequency score for the asset index and income quintiles, respectively. The general trend for both measures of SES shows that wealthier households consume more of all food groups except for cereals. The consumption of cereals, while generally high for all households, was not consistent with the general trend, as levels of consumption of the wealthiest households was lower than the others. The wealthiest households reported much higher consumption of fruits and vegetables than the general population.
Figure 1: Patterns of distribution of consumption of individual food groups by wealth quintiles, based on data from the 2017 General Household Surveys
Figure 2: Patterns of distribution in consumption of individual food groups by income quintiles, based on data from the 2017 General Household Surveys
34 category, 50.59% of households had a low dietary diversity; this decreases to 48.91% for the poorer category, 43.67% for the poor, 35.41% for the rich and 20.86%.
Table 2: Proportion of households in each socioeconomic category not achieving the mean dietary diversity score
Indicator Poorest Poorer Poor Rich Richest Asset 62.10 51.42 37.21 27.90 15.42 Income 50.49 48.91 43.67 35.41 20.86
Source: Computed by the authors using data from the 2017 General Household Survey
Overall inequality in dietary diversity and food group consumption
frequency
In this section, we present results for inequality in dietary diversity in Table 3. The positive concentration indices for inequality in dietary diversity using both the asset index and income signifies that the more affluent segment of the population achieved a more diverse diet than poorer households, whichever way SES was measured. The values of the concentration index for the asset-based measure show that relative inequalities in dietary diversity are higher when measured by assets.
Table 3: Overall inequality in dietary diversity using income and the asset index
Index Type No. of
obs.
Index value
Std. error
p-value
Dietary diversity score (asset) 20513 0.198 0.003 0.000
Dietary diversity score (income) 17724 0.125 0.004 0.000
Food group consumption frequency (asset) 20513 0.093 0.002 0.000
Food group consumption frequency
(income) 17724 0.054 0.004 0.000
Source: Computed by the authors using data from the 2017 General Household Surveys
Similar to the results on inequality in dietary diversity, inequality in food group consumption frequency score also favour the rich, as shown in Table 3.
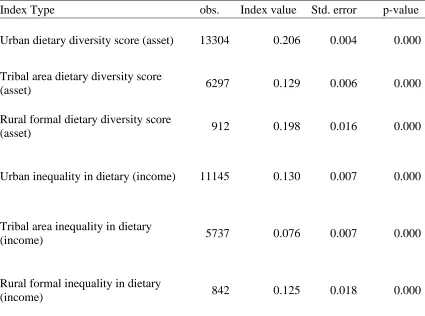
Inequality in dietary diversity and food group consumption frequency
by geographic area
35 and that of tribal areas was 0.129. The pattern was similar, though levels lower, when inequality was measured using income with levels of 0.130, 0.125, 0.076, respectively. Inequalities in dietary diversity in each of the geospatial areas favoured the wealthier in the population using both the income and the asset measure; results are presented in Table 4.
Table 4: Inequality in dietary diversity by geographic area using the asset index and incomes
Index Type obs. Index value Std. error p-value
Urban dietary diversity score (asset) 13304 0.206 0.004 0.000
Tribal area dietary diversity score
(asset) 6297 0.129 0.006 0.000
Rural formal dietary diversity score
(asset) 912 0.198 0.016 0.000
Urban inequality in dietary (income) 11145 0.130 0.007 0.000
Tribal area inequality in dietary
(income) 5737 0.076 0.007 0.000
Rural formal inequality in dietary
(income) 842 0.125 0.018 0.000
Source: Computed by the authors using data from the 2017 General Household Survey
36 Table 5: Inequality in food group consumption frequency by geographic area using asset index and incomes
Index Type No. of
obs.
Index value
Std. error
p-value
Urban food group consumption frequency
(asset) 13304 0.098 0.000 0.000
Tribal area food group consumption frequency
(asset) 6297 0.055 0.000 0.000
Rural formal food group consumption
frequency (asset) 912 0.095 0.010 0.000
Urban food group consumption frequency
(income) 11145 0.051 0.000 0.000
Tribal area food group consumption frequency
(income) 5737 0.041 0.000 0.000
Rural formal food group consumption
frequency (income) 842 0.051 0.010 0.000
Source: Computed by the authors using data from the 2017 General Household Survey
Discussion
This study relies data on food consumption data from the GHS to examine inequalities in food consumption despite its limitations due to the unavailability of recent national data on dietary intake. The national food consumption survey (Labadarios et al., 2005) conducted in 2005 is the only available data on dietary intake but is dated. Despite being the most recent representative data on food consumption in South Africa, the GHS limits consumption to 10 predefined food groups and is aggregated at the level of the household (Stats SA., 2017) which does not allow for a more nuanced examination of inequalities in dietary intake.
The dietary diversity is a reliable indicator of nutritional status (Faber and Wenhold, 2007) and evidence suggests there is an association between one's SES and dietary intake both in terms of quality and quantity. In this study, we examined the association between dietary intake and SES using two socioeconomic measures of income and an asset index.
Our findings established a consistent positive relationship between SES and dietary diversity at all levels--national and subnational--as indicated by the positive signs of the concentration indices. This outcome is consistent with the existing literature, which shows that wealthier people consume more diverse diets (Giskes et al., 2010; Mullie et al., 2010). Also, the results on food group consumption frequency once more favour the wealthier households.
37 measured using incomes or the asset index. This finding aligns with previous studies (Faber and Wenhold, 2007; Labadarios, Steyn and Nel, 2011) that indicate that cereals are the most consumed food group amongst South African children. However, it is informative that the cereal food group is the only one that the wealthiest segment of the population consumes less than the other quintiles. For all other food groups, there is a clear socioeconomic gradient with the rich consuming more than the poor.
The gap in food group food group consumption frequency between the rich and the poor is especially visible in the consumption levels of vegetables, fruits and dairy. An explanation for this pattern lies in the cost of accessing higher quality diets, which tend to be characterized by higher intakes of whole grains, lean meats, fresh fruits and vegetables, and by lower intakes of added fats and sugars, and refined grains (Darmon et al., 2005; Ledikwe et al., 2006) . Existing evidence suggests that such diets are associated with higher dietary expenditure (Drewnowski
et al., 2007; Bernstein et al., 2010; Aggarwal et al., 2011). The two poorest quintile categories, measured both by incomes and assets, fall below the national average in the consumption of all food groups examined. Additionally, healthier food options are not readily available in food outlets with poor communities (Osorio, Corradini and Williams, 2013; Vandevijvere et al., 2015). Thus poor communities face two critical disadvantages in accessing healthy food: higher prices and the availability of healthy food (Vandevijvere et al., 2015). For example; food outlets used by the poor do not have the cold storage facilities to transport and stock perishables and instead offer shelf-stable snack foods and sugary beverages (Aguiar and Santana, 2002).
While limited, available data suggests that South Africa has low dietary diversity. Faber and Wenhold (2007) measure adults’ dietary diversity using nine food groups and a 24 hour recall and arrive at an average of 4.02 which coincides with a measure of child dietary diversity computed by (Labadarios, Steyn and Nel, 2011). Our analysis indicates that when measured by both income and an asset index, greater proportions of wealthier households can consume a diverse diet.
Analysis revealed that, irrespective of SES measurement used, inequalities at the national level consistently favoured the rich. While both the income-based measure of socioeconomic status and the asset-based measure were consistent in their sign, inequalities measured using assets were generally higher compared to the income measure This may be attributable to the imputed nature of the income variable. This pro-rich nature of inequalities is consistent for both dietary diversity and food group consumption frequency. Globally, the rich are more likely to eat a more diverse and better quality diet (Mullie et al., 2010). Despite the lack of expansive research in South African on dietary intake, available evidence shows consistency with our results (Faber and Wenhold, 2007; Labadarios, Steyn and Nel, 2011; Drimie et al., 2013).
Within countries, inequalities in other social dimensions have been known to vary by geographic area (Drimie et al., 2013; Shisana et al., 2013). In our analysis, we examined inequalities in the three geographic categorisations often used in South Africa (Stats SA., 2017): urban areas, formal rural areas, and tribal areas. A consequence of rapid urbanisation in Africa countries, including South Africa, is rising urban inequalities (Mcgranahan and Martine, 2014). Our analysis revealed that diet-related inequalities were highest in urban areas.
38 attributed this to a wage gap between new urban residents who lack the requisite skills to participate in the more industrialised urban economies, thus remaining on the periphery (Siddique, Wibowo and Wu, 2014).
Consistently tribal areas recorded the lowest levels of inequalities. Tribal areas are a
subcategory of rural areas. The latter include farms that are more commercial in nature (Stats SA., 2001). Each tribal area usually consists of a number of villages and predominantly small scale farmers, making them more homogenous (Stats SA., 2001). Unlike China and countries in Latin America, lower levels of income inequality in South Africa's tribal areas than in urban areas have been consistently observed since the first socio-economic survey conducted in 1993 (Hoogeveen and Özler 2007). This is likely to be a legacy of the processes of class compression set in motion by apartheid era legislation as described by (Carter and May, 1999).
An alternative explanation for higher inequalities in urban areas may be found in the weaker levels of social cohesion in cities (Forrest and Kearns, 2001). While much has been written about the association between social cohesion and income inequality (Ranci, 2011; Cassiers and Kesteloot, 2012), its effect extends beyond incomes into other relevant dimensions of wellbeing such as health, food and education. Thus, unlike tribal areas, urban areas in South Africa with higher levels of social heterogeneity may experience higher levels of
socioeconomic inequalities (OECD, 2006) in food and other dimensions. For all the geographic areas, the rich are more likely to consume more of each food group and a more diverse diet, a finding which is consistent with global patterns of dietary intake (Mullie et al., 2010).
Conclusions
This study demonstrates that in South Africa, wealthier households consume more of all dietary categories than poorer households except for cereals, and this pattern is irrespective of socioeconomic measure used, i.e. asset-based or an income measure. Our findings point to a high level of cereal consumption in all socioeconomic groups. Consumption of all other dietary groups tends to be higher in the wealthier households irrespective of measure of socioeconomic measure used. For vegetables, fruits, meat, and dairy, the socioeconomic gradient is particularly steep.
Our findings suggest that tackling dietary inequalities should be elevated on the policy agenda in dealing with high levels malnutrition, especially among children. Additionally, particular attention should be paid to fruit and vegetable intake for all socioeconomic groups.
Part of achieving this should involve improving the access of poor communities to healthier foods. Firstly by ensuring that such foods are readily available in the outlets used by the poor, (Vandevijvere et al., 2015). And secondly, by ensuring that healthy foods are offered at a price that is affordable to the poor (Wiggins et al., 2015).
39
References
Aggarwal, A. Monsivais, P. Cook A.J. and Drewnowski, A. (2011) ‘Does diet cost mediate the relation between socioeconomic position and diet quality? Eur J Clin Nutr 65, 1059– 1066. doi:10.1038/ejcn.2011.72
Aguiar, D. R. D. and Santana, J. A. (2002) ‘Asymmetry in farm to retail price transmission: Evidence from Brazil’, Agribusiness.18(1):37-48 doi: 10.1002/agr.10001.
Ataguba, J. E. Akazili, J. and McIntyre, D. (2011) ‘Socioeconomic-related health inequality in South Africa: Evidence from General Household Surveys’, International Journal for Equity in Health 10 (1) doi: 10.1186/1475-9276-10-48.
Bernstein, A.M. Bloom, D.E. Rosner, B.A. Franz, M. and Willett, W.C. (2010) Relation of food cost to healthfulness of diet among US women, The American Journal of Clinical Nutrition 92(5):1197–1203, https://doi.org/10.3945/ajcn.2010.29854
Carter, M. R. and May, J. (1999) ‘Poverty, livelihood and class in rural South Africa’, World Development 27, 1–20. doi: 10.1016/S0305-750X(98)00129-6.
Casale, D. (2016) Analysing the links between child health and education outcomes:
Evidence from NIDS Waves 1-4. SALDRU Working Paper No. 179. Southern Africa Labour and Development Research Unit. University of Cape Town: Cape Town.
Casale, D. and Desmond, C. (2016) ‘Recovery from stunting and cognitive outcomes in young children: evidence from the South African Birth to Twenty Cohort Study’, Journal of Developmental Origins of Health and Disease 7(02):163–171. doi:
10.1017/S2040174415007175.
Cassiers, T. and Kesteloot, C. (2012) Socio-spatial Inequalities and Social Cohesion in European Cities. Urban Studies 49(9):1909–1924.
https://doi.org/10.1177/0042098012444888
Cowell, F. (2011) Measuring inequality. London: Prentice Hall, Harvester Wheatsheaf.
Cowell, F. A. (2006) ‘Theil, inequality indices and decomposition’, Research on Economic Inequality 13, 341–356.
Darmon, N. Darmon, M. Maillot, M. and Drewnowski, A. (2005) A nutrient density standard for vegetables and fruits: Nutrients per calorie and nutrients per unit cost. Journal of the American Dietetic Association 105(12):1881–1887.
https://doi.org/10.1016/j.jada.2005.09.005
Darmon, N. and Drewnowski, A. (2008) ‘Does social class predict diet quality?’, The American Journal of Clinical Nutrition 87(5):1107–1117.
https://doi.org/10.1093/ajcn/87.5.1107
Doherty, E. Walsh, B. and O’Neill, C. (2014) ‘Decomposing socioeconomic inequality in child vaccination: Results from Ireland’, Vaccine 32(27):3438–44.doi:
40 Drewnowski, A. Maillot, M. Darmon, N. and Vieux, F. (2007) Low energy density and high nutritional quality are each associated with higher diet costs in French adults, The American Journal of Clinical Nutrition 86(3):690–696. https://doi.org/10.1093/ajcn/86.3.690
Drimie, S. Faber, M. Vearey, J. et al. (2013) Dietary diversity of formal and informal residents in Johannesburg, South Africa. BMC Public Health 13, 911. doi:10.1186/1471-2458-13-9
Faber M. and Wenhold F. (2007). Nutrition in contemporary South Africa. Water SA 33(3) (Special Edition): 393-400.
Forrest, R. and Kearns, A. (2001) ‘Social cohesion, social capital and the neighbourhood’, Urban Studies 38(12):2125–2143. doi: 10.1080/00420980120087081.
Giskes, K. et al. (2010) ‘A systematic review of studies on socioeconomic inequalities in dietary intakes associated with weight gain and overweight/obesity conducted among
European adults’, Obesity Reviews 11(6):413–429. doi: 10.1111/j.1467-789X.2009.00658.x.
Jolliffe, I. (2002) ‘Principal Component Analysis and Factor Analysis’, Principal Component Analysis, pp. 150–166. doi: 10.1007/0-387-22440-8_7.
Kennedy, G.L. Pedro, MR. Guy, CS and Brouwer, NI (2007) Dietary Diversity Score Is a Useful Indicator of Micronutrient Intake in Non-Breast-Feeding Filipino Children, The Journal of Nutrition 137(2):472–477. https://doi.org/10.1093/jn/137.2.472
Labadarios, D., Steyn, N.P. & Nel, J. (2011) How diverse is the diet of adult South Africans? Nutr J 10, 33 doi:10.1186/1475-2891-10-33
Ledikwe, J.H., Blanck, H.M., Khan, L.K., Serdula, M.K., Seymour, J.D. Tohill, B.C. et al. (2006) Low-energy-density diets are associated with high diet quality in adults in the United States J Am Diet Assoc 106, 1172-1180.
Leibbrandt, M. Finn, A. and Woolard, I. (2012) Describing and decomposing post-apartheid income inequality in South Africa, Development Southern Africa
29(1):19-34. DOI: 10.1080/0376835X.2012.645639
May, J. and Timæus, I.M. (2014) Inequities in under-five child nutritional status in South Africa: What progress has been made? Development Southern Africa 31(6):761-774. DOI: 10.1080/0376835X.2014.952896
McGranahan, G. and Martine, G. (editors) (2014) Urban Growth in Emerging Economies: Lessons from the Brics, Routledge, Abingdon.
41 Osorio, A.E., Corradini, M.G. and Williams, J.D. (2013) ‘Remediating food deserts, food swamps, and food brownfields: helping the poor access nutritious, safe, and affordable food’, AMS Rev 3, 217. https://doi.org/10.1007/s13162-013-0049-6
Hoogeveen, J. G. and Özler, B. (2007) ‘Not separate, not equal: Poverty and inequality in post-apartheid South Africa’, Economic Development and Cultural Change.
https://deepblue.lib.umich.edu/bitstream/handle/2027.42/40125/wp739.pdf?sequence=3&isA llowed=y
Pradhan, M., Sahn, D. E. and Younger, S. D. (2003) ‘Decomposing world health inequality’, Journal of Health Economics 22(2):271–293. doi: 10.1016/S0167-6296(02)00123-6.
Ranci, C. (2011) Competitiveness and Social Cohesion in Western European Cities. Urban Studies 48(13):2789–2804. https://doi.org/10.1177/0042098010394688
Rashad, A. S. and Sharaf, M. F. (2015) ‘Who benefits from public healthcare subsidies in Egypt?’, Soc. Sci. 4(4):1162-1176; https://doi.org/10.3390/socsci4041162
Ruel MT (2003a) Is dietary diversity an indicator for food security or dietary quality? A review of measurement issues and research needs. International Food Policy Research Institute, Washington, DC Also available via http://www.ifpri.org/publication/dietary-diversity-indicator-food-security-or-dietary-quality
Ruel, MT. (2003b) Operationalizing Dietary Diversity: A Review of Measurement Issues and Research Priorities, The Journal of Nutrition 133(11):3911S–3926S.
https://doi.org/10.1093/jn/133.11.3911S
Said-Mohamed, R. et al. (2015) ‘Has the prevalence of stunting in South African children changed in 40 years? A systematic review.’, BMC Public Health 15, 534. doi:
10.1186/s12889-015-1844-9.
Shisana, O. et al. (2013) The South African National Health and Nutrition Examination Survey. Cape Town: Human Sciences Research Council (HSRC) Press. Available at: http://www.hsrc.ac.za/en/research-outputs/view/6493
Siddique, M. Wibowo, H. and Wu, Y. (2014) Fiscal decentralisation and inequality in Indonesia: 1999–2008. 14.22. Crawley. Available at:
http://www.business.uwa.edu.au/__data/assets/pdf_file/0009/2585205/14-22-Fiscal-Decentralisation-and-Inequality-in-Indonesia-1999-2008.pdf
Spaull, N. (2013) ‘Poverty & privilege: Primary school inequality in South Africa’, International Journal of Educational Development 33(5):436–447. doi:
10.1016/j.ijedudev.2012.09.009.
Stats SA. (2001) Stats SA Census 2001 Concepts and Definitions. Pretoria. Availble at: http://www.statssa.gov.za/census/census_2001/concepts_definitions/concepts_definitions.pdf
42 Sulemana, I. Nketiah-Amponsah, E., Codjoe, E.A. and Nyarko Andoh, J.A. (2019)
‘Urbanization and income inequality in Sub-Saharan Africa’, Sustainable Cities and Society, Volume 48, doi: 10.1016/j.scs.2019.101544
Swindale, A. Bilinsky, P. (2006) Household Dietary Diversity Score (HDDS) for
Measurement of Household Food Access: Indicator Guide. Food and Nutrition Technical Assistance Project (FANTA), Academy for Educational Development, Washington, DC.
UNDP (2017) Income Inequality Trends in sub-Saharan Africa: Divergence, Determinants, and Consequences. New York. Available at:
http://www.africa.undp.org/content/rba/en/home/library/reports/income-inequality-trends-in-sub-saharan-africa--divergence--dete.html
UNICEF (1990) Conceptual Framework for the Causes of Malnutrition, Strategy for improved Nutrition of Children and Women in developing countries. Available at: http://internal-pdf//Picture 10-0412100353/Picture 10.png
Vandevijvere S. Sacks G, Brinsden H, Lobstein T, Swinburn B. (2015) INFORMAS.
Measuring the drivers of obesity, disease, health, well-being. [Sick societies] World Nutrition 6(3):184-201 URL: https://worldnutritionjournal.org/index.php/wn/article/view/128/94
Wagstaff, A. (2005) ‘The bounds of the concentration index when the variable of interest is binary, with an application to immunization inequality’, Health Economics 14(4):429–432. doi: https://doi.org/10.1002/hec.953
WHO (2013) Handbook on Health Inequality Monitoring with a special focus on low- and middle-income countries. Geneva, Switzerland.
Wiggins, S. Keats, S. Han, E. (2015) The Rising Cost of a Healthy Diet. Changing Relative Prices of Foods in High-Income and Emerging Economies; ODI: London, UK, 2015. Available at: http://www.odi.org/sites/odi.org.uk/files/odi-assets/publications-opinion-files/9580.pdf
Wirt, A. and Collins, C. (2009) Diet quality – what is it and does it matter? Public Health Nutrition, 12(12):2473-2492. doi:10.1017/S136898000900531X