Journal of Information Technology and Computer Science Volume 3, Number 2, 2018, pp. 202-213
Journal Homepage: www.jitecs.ub.ac.id
Analysis of Brawijaya University Academic Information
Systems Acceptance on the User Characteristic, System
Quality, Support of Top Management and Information
Technology, Perceived Usefulness, and
Perceived Ease of Use
Yusi Tyroni Mursityo1, Mochammad Chandra Saputra2, Admaja Dwi Herlambang 3, Anita Dwi Puspitasari 4
Information Systems Departments, Faculty of Computer Sciences, Brawijaya University, Malang, Indonesia
{yusi_tyro,
andra, herlambang} @ub.ac.id, anitadp09@gmail.com
Received 31 October 2018; accepted 04 December 2018
Abstract. Sistem Informasi Dosen (SIADO) as an academic information system for Universitas Brawijaya lecturers are not fully optimized and used since many perspectives about the system, such as system quality complaints and it’s not obligated to use by the University leaders even many benefits can be obtained. This research conducted to describe the factors on SIADO’s user acceptance in five variables, namely is user characteristic, system quality, top management & IT support, perceived usefulness, and perceived ease of use, using descriptive statistical analysis. Data collection techniques with offline questionnaire were distributed using paper from 96 Universitas Brawijaya lecturers. Validation and reliability were checked with statistics methods and descriptive statistical analysis is implemented to measure the level of categories on each variable to provide calculation and information based on data centralization and dissemination, and acquired categorized data. The results show that all five variables receive high category on SIADO acceptance, which indicates the user perception all five variables are good to be used as a consideration tool in receiving the actual use of the system.
Keywords: system acceptance, user characteristic, academic information system.
1
Introduction
Yusi Tyroni Mursityo et al., Analysis of Brawijaya University ... 203
to be aligned with the objectives of the organization to be useful and works better as well. Understanding the benefits of the information systems application, Universitas Brawijaya (UB) as one of the top Indonesia's higher educations developed a systems to help their lecturers activities called Sistem Informasi Dosen (SIADO). SIADO is a website-based information systems applied to assist the activities of lecturers in carrying out their duties and obligations. The system is fully integrated with the university email accounts. No written obligation from the university leader to use SIADO in every faculties become the main reason why not many lecturer used the system. Some lecturer in the Faculty of Dentistry also stated that the learning process system applied in their faculty are using different system block learning system unit or credit semester as known as Sistem Kredit Semester (SKS), so they are more often using SIADO at the end of the semester just to fulfill their obligation of filling out the workload of lecturers from the faculty. In addition, according to the Pusat Informasi, Dokumentasi dan Keluhan (PIDK) or Center of Information, Documentation, and Complain Unit of UB in the last 5 years from 2013 to 2017 there are two complaints reported against SIADO application. Despite the fact that SIADO is integrated with Sistem Informasi Akademik Mahasiwa (SIAM) or Student Academic Information System, students themselves sometimes do not get full information about their grades. In SIADO Lecturer should complete detailed student scores so the student can view it in their SIAM account. Many advamtages from SIADO are not used properly by some lecturers. These problems will be the basis in this research to describe any factors that affect the user acceptance of SIADO.
To describe SIADO acceptance at UB, this research used 2 variables from TAM, specifically perception of ease of use (perceived ease of use), perception of usefulness or benefit (perceived usefulness), and additional variables such as the user characteristics, the support of top management and information technology, as well as the quality of the system. This research purpose are to describe how these factors affects user acceptance of SIADO, furthermore can be used as recommendations for UB in to overcome related problems and improve SIADO application.
2
Theoretical Background
Preliminary research conducted by Aldosari, Al-Mansour, Aldosari, & Alanazi [2] with title "Assessment of factors influencing nurse's acceptance of electronic medical record in a Saudi Arabia hospital" examine the nurses reception and perspective to EMR (Electronic Medical Record) in a Saudi Arabia hospital used as a base model. The use of EMR has a considerable impact against the work of the nurse, then the attitude of the nurses towards EMR which affects the efficiency of use of the EMR. There are several factors that affect the nursing staff attitudes towards acceptance of using the EMR, as a characteristic of the user. Then other factors, namely the quality of the system, the support of top management and information technology, perceived ease of use and perceived usefulness. Research conducted by the model Aldosari, Al-Mansour, Aldosari, & Alanazi [2] will be used as reference in this research as shown in Figure 1.
204 JITeCS Volume 3, Number 2, 2018, pp 202-213
respective groups, where each groups have their own patterns of thought and behavior.
1. Fig. 1. Aldosari, Al-Mansour, Aldosari, & Alanazi Research Model (2018)
Quality information systems are the characteristic of information attached to the system [4]. The quality of a good system can provide more comfort, privacy, and faster responses to user in accordance with the DeLone & McLean research [4] that the quality of the system can be measured from the comfort for access system, flexibility, and a good system integration. Top management support can help provide the resources needed and to remove obstacles against the renewal of the operation, and then improve user satisfaction [5]. Measurement that can explain the circumstances of top management support and information technology according to Al-Mamary & Shamsuddin [6] including, the extent to which the management aware of the benefits provided by the application of the system, support and encouragement from management, the resources provided, interest in management, and a provided training.
Yusi Tyroni Mursityo et al., Analysis of Brawijaya University ... 205
3 Methodology
The research was conducted at the University of Brawijaya, Malang, Indonesia starts with formulating a problem by the cause why this research has to be done. Further study of the literature that is used as a reference for research. Then define the variables analysed from literature obtained and make a detailed questionnaire based on the indicators of the model have been determined. On user characteristics variable consists of 8 questions adopted from research Aldosari, Al-Mansour, Aldosari, & Alanazi [2], Al-Mamary & Shamsuddin [6]. System quality variable has 6 indicators and consisted of 15 statements adopted from from research DeLone & McLean [4], Iivari [9], Ahn, Ryu, & Han [8], top management support and information technology variable consists of 5 indicators and 10 the revelation was adopted from research Igbaria [10], Al-Mamary & Shamsuddin [6], perceived usefulness variable has 5 variable indicator and 10 statements and perceived ease of use features 6 indicators and 12 statements adopted from Davis [7] and Ahn, Ryu, & Han [8]. This research uses five points Likerts scale, i.e. strongly disagree with a score of 1, Disagree with a score of 2, neutral with a score of 3, Agree with a score of 4, and strongly agree with a score of 5.
The next questionnaire tested by expert judgment to ascertain and validate them. The results of the assessment of expert judgment is calculated using a formula of Aiken's V as in Equation 1.
V=(∑s)/n(c-1) (1)
s is derived from the results of the reduction r and lo, r is the value given by the expert and you are the lowest scale of the study, in this case the value is 1, while the value of c is the highest scale of research, in this case is 5, and n is the number of validators. Pilot study consisted of test validity and reliability test on questionnaire to identify and detect errors and ambiguities of using IBM SPSS statistics software help, the population in this research are active lecturers at UB who used SIADO. At least 96 respondents required from the slovin's formula with disproportionate stratified sampling random sampling. According to Daniel [11] disproportionate stratified random sampling allocation for the purpose of analysis between strata, using more precise allocation of equal or balanced allocation to determine sample size from each strata. So at least samples amount divided by the number of existing faculty at UB, i.e. 96 divided by 16 faculty and 6 respondents for each faculty.
Data collection is carried out by the methods of questionnaire distributed to lecture in each faculty in the paper based offline form of a detailed questionnaire sheets. From 128 distributed questionnaires from May to June 2018 only 100 questionnaires has returned, this indicate the level of response is 78%. Descriptive statistics give an overview or description of a data viewed through the value of the average (mean), median, mode, standard deviation, and Variant data [12]. The results of descriptive statistics in the form of average value are categorized according to the table of categories shown in table 1 [13].
206 JITeCS Volume 3, Number 2, 2018, pp 202-213
arranged based on the normal distribution model theory which consists of six standard intersections (SD). Six elementary schools are divided into five categories, namely very strong, strong, medium, weak and very weak. In this study also used five categories of categories, namely strongly agree, agree, neutral, disagree, and strongly disagree. So that the calculation of the ideal percentage obtained is equal to Table 1 and can be used as a reference. After performing descriptive statistical analysis, basic assumption test is performed. The basic assumption testing using normality test with the Kolmogorov-Smirnov Test, linearity test with Linearity Test, and the homogeneity test by Leven's Test.
Table 1. Average Category
No Percentage (%) Category 1 75.01 < x ≤ 100.00 Very high 2 58.34 < x ≤ 75.01 High 3 41.66 < x ≤ 58.34 Medium 4 24.99 < x ≤ 41.66 Low 5 0.00 < x ≤ 24.99 Very Low
4 Analysis
Yusi Tyroni Mursityo et al., Analysis of Brawijaya University ... 207
inverse variables remain included in the analysis.
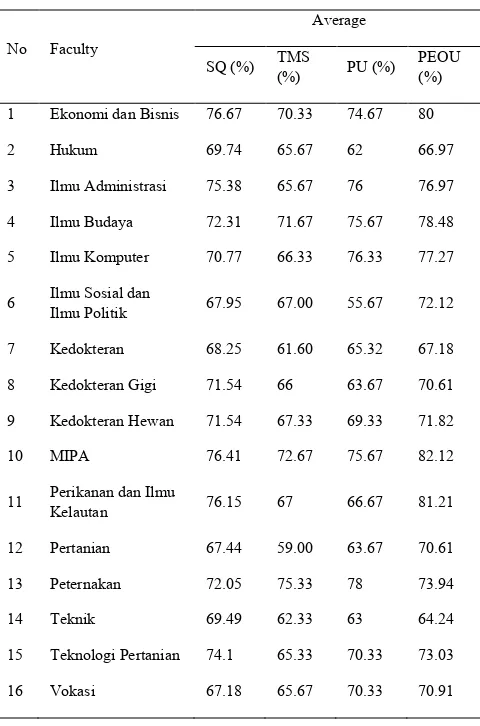
User characteristics is able to characterize the the user circumstances. Focusing on the characteristics in accordance with user faculty or user working unit and his or her experience as a lecturer at UB, and how long they use SIADO. This is to describe the user condition in their respective faculty toward SIADO acceptance. The characteristics of the users based on the faculty can be shown in table 2.
Table 2. Characteristics
No Faculty
Average
SQ (%) TMS
(%) PU (%) PEOU (%)
1 Ekonomi dan Bisnis 76.67 70.33 74.67 80
2 Hukum 69.74 65.67 62 66.97
3 Ilmu Administrasi 75.38 65.67 76 76.97
4 Ilmu Budaya 72.31 71.67 75.67 78.48
5 Ilmu Komputer 70.77 66.33 76.33 77.27
6 Ilmu Sosial dan Ilmu Politik 67.95 67.00 55.67 72.12
7 Kedokteran 68.25 61.60 65.32 67.18
8 Kedokteran Gigi 71.54 66 63.67 70.61
9 Kedokteran Hewan 71.54 67.33 69.33 71.82
10 MIPA 76.41 72.67 75.67 82.12
11 Perikanan dan Ilmu Kelautan 76.15 67 66.67 81.21
12 Pertanian 67.44 59.00 63.67 70.61
13 Peternakan 72.05 75.33 78 73.94
14 Teknik 69.49 62.33 63 64.24
15 Teknologi Pertanian 74.1 65.33 70.33 73.03
16 Vokasi 67.18 65.67 70.33 70.91
208 JITeCS Volume 3, Number 2, 2018, pp 202-213
with value 76.41%, TMS with highest average are Faculty of animal husbandry with a value of 75.33 %, Faculty of Sciences with the value of 72.67%. The faculty of animal husbandry average value of 78% which is the highest average rating after the Faculty of computer science that has an average rating of 76.33%. Whereas in PEOU the highest average is Faculty of Sciences with a value of 82.12% followed by the Faculty of Fisheries and Marine Science with 81.21% value.
Based on the user experience as a UB lecturer can be categorized in 4 categories which are 1-10 years, 11-20 years, 21-30 years, and 31-40 years and idicate the majority of average value score obtained are in the high category. The experience became a lecturer for 1 to 10 years have averaged 71.99% with high category on SQ, average 68.15% with high category on TMS, 70.68% average with high category on PU, and averaged 73.53% with high category on PEOU. The experience became a lecturer for 11 to 20 years had an average of 71.73% with high category on the SQ, 63.58% average with high category on TMS, an average of 66% by category high on PU, and averaging 74.62% with high category on PEOU. The experience became a lecturer during the 31 years up to 41 has an average of 75.38% with high category on the SQ, an average of 76% with high category on a TMS, an average of 74% with high category on PU, and 70.91% average with high category on PEOU. The experience became a lecturer in the range of 21 to 30 years have categories are on each variable in the system, this is indicated by the average value obtained i.e. 56.92% in SQ, 51% in TMS, 50% in PU, and 65.45% in PEOU.
The characteristics of the users based on the experience of using SIADO can be grouped into 6 categories, namely for 1 to 6 years. Where is the average value obtained in each experience has no significant difference and get a high category on each variable. The variable SQ the most average high is from a user with experience using SIADO for 4 years with the average value of 74.42% and 6 years with an average value of 72.22%, on a TMS the most average high is from the user with experience using SIADO for 2 years with an average value of 69.17% and 4 years with the average value of 68.25%. The average with the highest value in PU also from a user with experience for 2 years with an average value of 71.92% followed by 1 year of experience with the average value of 71.14%. Whereas in PEOU, the average maximum temperature is from a user with experience using SIADO for 3 years with a value of 75.52% also for 4 years and 6 years with the same average value of 74.55%.
Table 3. Descriptive Statistics System Quality
No Indicator Code Median Modus Std. Deviation Variance Mean Value %
1 Convenience
of access
SQ1 4 4 0.59 0.35 3.99 79.8
SQ2 4 4 0.76 0.58 3.58 71.6
2 Flexibility of the system SQ3
4 4 0.73 0.53 3.74 74.8
SQ4 4 4 0.85 0.73 4.08 81.6
Yusi Tyroni Mursityo et al., Analysis of Brawijaya University ... 209
4 Response time
SQ7 4 4 0.91 0.83 3.73 74.6
SQ8 4 4 0.82 0.68 3.63 72.6
SQ9 4 4 0.71 0.50 3.65 73
5 Error recovery
SQ1
1 4 4 0.72 0.52 3.59 71.8
SQ1
2 3 3 0.83 0.69 2.98 59.6
6 Design
SQ1
3 4 4 0.73 0.54 3.60 66.4
SQ1
4 3 3 0.87 0.75 3.14 62.8
SQ1
5 3 3 0.75 0.56 3.23 64.6
Total Average 71.26
Category High
Table 3 shows the descriptive statistics of system quality variable. The system quality variable is to describe the SIADO UB quality characteristics to suit the needs of users with 6 indicator and 13 statement. Overall system quality getting average 71.261% with a high category. Top management & IT support variable is to describe the top management support and information technology in the university using SIADO with 5 the indicators and 10 statement. Descriptive statistics for top management & overall IT support variable get on average 66.8% with high category. Perceived usefulness variable is to describe the extent to which the perception of the user against the benefits gained when using the SIADO UB has 5 indicators and 10 statement. Descriptive statistics variable perceived usefulness overall gets an average of 69.7% with high category. Perceived ease of use variable is to describe the extent to which the perception of the user against the perceived ease while using the UB SIADO has 6 indicators and 12 statement. Descriptive statistics variable perceived usefulness overall average gain 73.57% with high category.
5 Results
210 JITeCS Volume 3, Number 2, 2018, pp 202-213
can be experienced by the users in acceptign the system. Serenko research [3] also investigated the user characteristics variable in shaping the perceptions and behavior of satisfaction related to mobile phone services, such as age, income, and gender. Characteristics belonging to the user can indicate the perspective from each group, as claimed by Serenko [3] that each age group have patterns of different thought and behavior. In addition gender difference can also influence due to the culture or habit when they use the system. In this research the different behavior in each faculty is not easy to see, because most users accept the SIADO as a good quality system to support lecturing activities. Several faculty that prioritizes other variables than system quality such as ease of use of the system because most responden have different understanding, mindset or point of view. Thus system with ease of use is prioritized in some non technical faculty, such as Fakultas Ilmu Budaya.
Descriptive statistical analysis was performed on the variable quality of the system and shows that overall system quality variables included in the high category meaning that variables can be recommended to be maintained. This can indicate SIADO can still be accepted and used by lecturer because it has a good quality. The quality system in research Ahn, Ryu, & Han [8] found to have an affinity with the confidence of users in using that website again, so as if the user finds difficulties in navigation activities they will switch over to the another system. Thereby, the quality system must be evaluated in accordance with the user's point of view. SIADO gets the lowest average score on error reparation or adjustment indicators, but can be improved by providing a notification when an error occurred and provide a solution with information what to do or return to the previous page. In addition, keeping a good system with a quality evaluation system and ensuring its navigation system runs in accordance with its functions, any changes is in accordance with user expectations, ensuring the system integrates well with other systems, not required a long time to perform the action in using the system, and as well as always gathers input from the affected users may experience difficulties that may add to the quality of the system to fit the needs and changing display SIADO to provide refreshment to user can have its own value against unauthorized use as well as provide comfort when accessed.
Yusi Tyroni Mursityo et al., Analysis of Brawijaya University ... 211
management supports the use of SIADO.
Following the analysis of the descriptive variables perceived usefulness, indicated that the overall perceived usefulness variables included in the categories high which can be recommended to be maintained. This can indicate SIADO can still be accepted and used by user due to their perception of the benefits of having used SIADO to support activities, in the activities of the academic, research, and community service. Hamid, Razak, burn, & Abdullah [14] also gives significant results against intentions using e-government, the sustainably because users assume that the system provided useful and can improve their interactions with Government institutions. SIADO gets the lowest average score on indicators of productivity, thus can be enhanced by providing education about the benefits obtained if using SIADO can add productivity i.e. can make tasks done becomes more on time and avoid mistakes. In addition, the increased productivity of lecturer in the completed task and feel greatly helped by using the system also shows the user's perception about SIADO toward the perceived benefits. This will encouraged the using of SIADO becuase of their benefits.
Be based on descriptive analysis already done previously on variables perceived ease of use indicate that the overall variables perceived ease of use included in the higher category can be recommended to be maintained. This can indicate SIADO can still be accepted and used by the user as a lecturer because in the perception of the user, the system is SIADO is easy to use and users do not encounter any difficulties in using SIADO. Aldosari, Al-Mansour, Aldosari, & Alanazi [2] in this research as a nurse explains that users assume learning system using EMR is an easy thing and nurses understand how to perform tasks with the system and EMR tends to lighten the activities and work of nurses as a user. SIADO gets the lowest average on indicators easy to learn, which can be increased by holding the related socialization using SIADO besides giving the steps that can be followed to use SIADO in guidebooks. In addition, it provides a system that is not too complex in appearance and can be used by all walks of life as well as showing clear information to make it easier for users to understand the functions contained on SIADO, allowing users easy getting to know the features provided. Ensure the system can always be in control of the users according to your needs will make users feel SIADO is easy to use. Also, guaranty the SIADO manual will always available, so that users do not need to ask for help people who are more expert in using the system to do its job. Thus SIADO will still be used because for a lecturer who used it, SIADO is easy to use.
212 JITeCS Volume 3, Number 2, 2018, pp 202-213
category are in the range of experience of being a lecturer during the 21-30 years, which indicates a variable researched not felt well in the implementation of SIADO on experience during the 21-30 years. The overall variables also get high category on all the range of experience using SIADO, meaning all experience using SIADO can feel the well-studied variables.
The acceptance of the users towards the implementation of the system quality variables belongs in the category of high quality meet the criteria because of a good system, so the quality of the system can be maintained as the reason for the user to receive and to use the system. User acceptance towards implementation support variables SIADO top management and information technology are included in the categories high because the meet the criteria get support from top management and information technology is good, so top management support and information technology can be maintained as the reason for the user to receive and use the system. User acceptance towards implementation SIADO on the perceived usefulness of the perception of the variables included in the categories high because the criteria have the perception of usability is good, so the perception of usability can be maintained as the reason the user accepts and uses the system. The acceptance of the users towards the implementation of the variable on the ease of perception SIADO felt included in the categories high because the criteria have the perception of the ease with which either, so the perception of usability can be maintained as the reason the user accepts and uses the system.
Recommendations that can be given to maximize acceptance implementation SIADO is to meet the user's expectations about the perceived access convenience, flexible systems, integrated systems, short response time, availability of repairs if an error occurs, and a good look at the quality of the system. Provides benefits regarding speed, work performance, productivity, quality, good performance and convenience in doing work perceived users to the perceived usefulness of the perception of the user. As well as making the system easy to learn, does not require expert help and easy to be an expert, the system can be controlled according to needs of users, it is clear and understandable, and requires no mental effort in using the system to the perceived ease of perception of the user.
Further suggestions can be submitted from the research is expected to UB can implement the recommendations that had been given to increase the acceptance of SIADO. In addition, further research may conduct research related repair system against information systems Lecturer (SIADO) to improve its quality. And can use the modified model TAM on the next study to evaluate information systems such as Student Academic information systems
.
References
1. E. Arbie, Pengantar Sistem Informasi Manajemen. Jakarta: Bina Alumni Indonesia, 2000. 2. B. Aldosari, S. Al-Mansour, H. Aldosari, and A. Alanazi, “Assessment of factors
Yusi Tyroni Mursityo et al., Analysis of Brawijaya University ... 213
3. A. Serenko, “Moderating roles of user demographics in the American customer satisfaction model within the context of mobile ...,” no. May, 2014.
4. W. H. DeLone and E. R. McLean, “Information systems success: The quest for the dependent variable,” Inf. Syst. Res., vol. 3, no. 1, pp. 60–95, 1992.
5. Wang, G., Song, J. 2016. The Relation of Perceived Benefits and Organizational Supports to User Satisfaction with Building Information Model (BIM), Computers in Human Behavior, doi: 10.1016/j.chb.2016.12.002
6. Y. H. Al-Mamary and A. Shamsuddin, “The Impact of Top Management Support, Training, and Perceived Usefulness on Technology Acceptance,” Mediterr. J. Soc. Sci., vol. 6, no. December, pp. 11–17, 2015.
7. F. D. Davis, “Perceived Usefulness , Perceived Ease of Use , and User Acceptance of lnformation Technology,” MIS Q., vol. 13, no. 3, pp. 319–340, 1989.
8. T. Ahn, S. Ryu, and I. Han, “The impact of Web quality and playfulness on user acceptance of online retailing,” Inf. Manag., vol. 44, no. 3, pp. 263–275, 2007.
9. J. Iivari, “An Empirical Test of the DeLone-McLean Model of Information System Success An Empirical Test of the Model of Information System Success,” vol. 36, no. June 2005, 2005.
10. M. Igbaria, “Personal Computing Acceptance Factors in Small Firms : A Structural Equation,” MIS Q., no. September, 1997.
11. J. Daniel, “Sampling Essentials: Practical Guidelines for Making Sampling Choices,” 2012.
12. I. Ghozali, Aplikasi Analisis Multivariate dengan Program IBM SPSS 23, 8th ed. Semarang: Badan Penerbit Universitas Diponegoro, 2016.
13. Herlambang, A.D., Syafrudie, H.A., & Sutadji, E. 2014. Pembelajaran Pembuatan Halaman Web Dinamis Tingkat Dasar di SMK. Jurnal Pendidikan Sains, 2(4), 200-220. 14. R. Nag, D. C. Hambrick, and M. Chen, “What Is Strategic Management, Really ?