DOI
10.17219/acem/78773
Copyright
© 2018 by Wroclaw Medical University This is an article distributed under the terms of the Creative Commons Attribution Non-Commercial License (http://creativecommons.org/licenses/by-nc-nd/4.0/)
Address for correspondence
Zhenguo Chen
E-mail: [email protected]
Funding sources
The study was supported by research grants from the project of Science and Technology Bureau in Ruian, China (20130211).
Conflict of interest
None declared
Received on March 20, 2017 Reviewed on April 11, 2017 Accepted on October 20, 2017
Abstract
Background. During the rapid physical and mental development, school-age children, who are beginning the learning phase, have an increasingly heavy burden on their eyes.
Objectives. The aim of this study was to analyze the association of refractive errors with body height in children aged 7–14 years.
Material and methods. A total of 1,696 children aged 7–14 years were consecutively enrolled. Children’s age, sex, height, uncorrected and corrected visual acuity were collected. Children’s refractive errors were tested using static retinoscopy, and converted to the spherical equivalent refraction. The prevalence of refractive errors in different height groups were measured.
Results. The children were divided into an ultra-low-height group, a low-height group, a high-height group and an ultra-high-height group as per the height standard of children aged 3–16 years generally used in China. With the increase of body height, the prevalence of myopia was also increased, which was 39.2% in the ultra-low-height group, 46.3% in the low-height group, 49.1% in the high-height group, and 58.0% in the ultra-high-height group. Most of the myopic children suffered from low myopia. Results from the regression analysis showed that there was no difference in the prevalence of myopia between the high- -height group and ultra-high-height group (p = 0.145), but it was increased significantly proportionately to the increase of body height (p < 0.001).
Conclusions. The prevalence of myopia exhibits an increased tendency with height development in children aged 7–14 years. Additionally, school-age children often develop low or moderate myopia rather than high myopia.
Key words: height, refractive error, school-age children
Correlation analysis for school-age children's height and refractive errors
Jiawei Chen
A–F, Zhenguo Chen
A,B,F, Sisi Lin
A,B,D,F, Jiayu Zhang
B–D,
Qiang Wang
B,D, Hongliang Zhong
B,E,F, Daqiu Cai
C,E,FDepartment of Ophthalmology,3rd Affiliated Hospital of Wenzhou Medical University, China
A – research concept and design; B – collection and/or assembly of data; C – data analysis and interpretation; D – writing the article; E – critical revision of the article; F – final approval of the article
Introduction
During rapid physical and mental development, school-age children, who are beginning the learning phase, have an increasingly heavy burden put on their eyes. Myopia is the most common form of refractive error.1 China is one
of those countries with the highest prevalence of myopia in the world, and, moreover, with the economic and sci-entific development, the prevalence of juvenile myopia is increasing every year.2
It is noticed that a child’s body height increases quickly during the refractive development and involves multiple factors.3 However, the correlation between the body height
and refractive development of school-age children has rarely been reported.
A study in China involving 553 twin pairs showed that the axial length (AL) and height were concomitant in chil-dren between the ages of 7 and 15 years.4 This study found
that boys experienced more pronounced changes in stat-ure, whereas girls had greater changes in AL. This sug-gested that the growth of the eye and the changes in height may be governed by different mechanisms. Still, previous experience has suggested that children with relatively high-height are more likely to develop myopia, but there is no relevant data to confirm this. Therefore, to explore the correlation between the body height and refractive er-rors in school-age children, we collected and analyzed the clinical data from 1,696 school-age children in this study.
Material and methods
Participants
From June 2012 to June 2014, 1,696 school-age children (3,392 eyes) seeking medical advice at the Department of Ophthalmology, 3rd Affiliated Hospital of Wenzhou
Medical University, China, were enrolled in this study, including 1,000 boys (2,000 eyes) and 696 girls (1,392 eyes). The spherical equivalent ranged from +6.5 D to –11.5 D. These children never had any ocular surgery and intra-ocular disease, which was confirmed by a slit lamp and ophthalmoscope, and those with orthokeratology lens or rigid contact lens were excluded.
Informed consent
The study protocol was approved by the Ethics Commit-tee of the hospital. The benefits and risks of participating in the trial were explained to the children’s guardians, and written informed consent was obtained before the trial.
Data measurement and collection
Children’s sex, age, height [cm], uncorrected and correct-ed visual acuity were measurcorrect-ed and recordcorrect-ed. A cycloplegic agent, 10 g/L cyclopentolate, was dropped into the eyes
3 times with an interval of 5 min. After 20 min, children with the absence of the pupillary light reflex and the pupil size of >6 mm were confirmed to have cycloplegia. After 30 min, static retinoscopy was used to determine refrac-tive errors in children with cycloplegia by an experienced optometrist, and the data was converted to the spherical equivalent refraction that was equal to the spherical power plus 1/2 cylinder power. After that, all the children were as-signed into hyperopia (≥0.50 D), emmetropia (from –0.75 D to 0.50 D), myopia (≤–0.75 D) groups. Furthermore, the myopia group was subdivided into low myopia (from –3.0 D to –0.75 D), moderate myopia (from –6.0 D to –3.0 D) and high myopia (≤–6.0 D) groups.
According to the height standard of children aged 3–16 years generally used in China, these children were divided into different groups according to their age, re-spectively.5 Subjects of the same age were divided into
ultra-low-height group (≤3 percentile height), low-height group (3–50 percentile height), high-height group (50–97 percentile height), and ultra-high-height group (>97 per-centile height).
Statistical analysis
Measurement data is expressed as the mean ± standard deviation (SD) and statistically analyzed by SPSS 11.5 (SPSS Inc., Chicago, USA). Multivariate non-conditional logis-tic regression analysis was used to establish a regression analysis model based on refractive errors and body height. A value of p < 0.05 was considered statistically significant.
Results
General information
A total of 1,696 school-age children (3,392 eyes), 7–14 years of age, were recruited in this study. Their spheri-cal equivalent ranged from +6.5 D to –11.5 D and the mean height was 140.53 ±12.89 cm. There were 1,000 boys (2,000 eyes) with the spherical equivalent ranging from +6.25 D to –8.00 D and the mean height of 140.39 ±12.42 cm; 696 girls (1,392 eyes) with the spherical equivalent ranging from +5.00 D to –7.00 D and the mean height of 140.80 ±13.51 cm.
Refractive development in children
All the age groups of school-age children (7–14 years) were summed up as follows: 148 children (88 boys, 60 girls) in the ultra-low-height group, 808 (500 boys, 308 girls) in the low-height group, 640 (372 boys, 268 girls) in the high-height group, 100 (40 boys, 60 girls) in the ultra-high-height group.
ultra-high-height group, indicating the prevalence of myopia had increased along with the increase of the body height. Conversely, the prevalence of emmetropia was decreased with the increasing body height, which was 48.6%, 43.3%, 40.0%, and 36.0% in the 4 height groups, respectively. Addi-tionally, no significant correlation was found between body height and the prevalence of hyperopia, which was 12.2%, 10.4%, 10.9% and 6.0% in the 4 height groups, respectively.
For the boys, the prevalence of myopia was 45.5%, 44.1%, 46.8%, and 55.0% in the ultra-low-height group, low-height group, high-height group, and ultra-high-height group, respectively; the prevalence of emmetropia was 40.9%, 42.5%, 40.0%, and 35.0%, respectively; the prevalence of hyperopia was 13.60%, 13.4%, 13.2%, and 10.0%, respectively. The prevalence rates of both emme-tropia and hyperopia were lower in the ultra-high-height group than in the other 3 groups.
For the girls, the prevalence of myopia in the 4 groups was ordered from low to high: the ultra-low-height group
(30.0%) < low-height group (45.5%) < high-height group (56.0%) < ultra-high-height group (73.3%); the prevalence of emmetropia was ordered from high to low as follows: the ultra-low-height group (60.0%) > low-height group (48.7%) > high-height group (36.5%) > ultra-high-height group (23.4%). The prevalence of hyperopia was 10.0% in the ultra-low-height group, which was the highest compared with 5.8% in the low-height group, 7.5% in the high-height group and 3.3% in the ultra-high-height group, i.e., the prevalence of hyperopia was the highest in the ultra-low-height group, but had no association with the height growth.
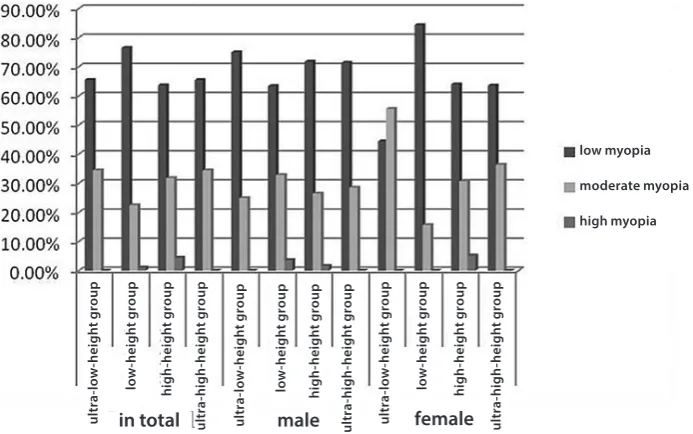
The degree of myopia in these school-age children who mainly suffered from low-to-moderate myopia is pro-vided in Fig. 2. The prevalence of high myopia was the lowest, sequentially followed by that of moderate myo-pia and low myomyo-pia. Moreover, there was no significant difference in the degree of myopia among the 4 height groups.
Fig. 1. Prevalence of myopia, emmetropia and hyperopia in school-age children from different height groups
Fig. 2. Prevalence of low, moderate or high myopia in school-age children from different height groups ult ra -l ow -h ei gh t gr oup lo w -h ei gh t gr oup hi gh -h ei gh t gr oup ult ra -h igh -h ei gh t gr oup ult ra -l ow -h ei gh t gr oup lo w -h ei gh t gr oup hi gh -h ei gh t gr oup ult ra -h igh -h ei gh t gr oup ult ra -l ow -h ei gh t gr oup lo w -h ei gh t gr oup hi gh -h ei gh t gr oup ult ra -h igh -h ei gh t gr oup ult ra -l ow -h ei gh t gr oup lo w -h ei gh t gr oup hi gh -h ei gh t gr oup ult ra -h igh -h ei gh t gr oup ult ra -l ow -h ei gh t gr oup lo w -h ei gh t gr oup hi gh -h ei gh t gr oup ult ra -h igh -h ei gh t gr oup ult ra -l ow -h ei gh t gr oup lo w -h ei gh t gr oup hi gh -h ei gh t gr oup ult ra -h igh -h ei gh t gr oup hyperopia emmetropia myopia low myopia moderate myopia high myopia in total
in total male
male female
Refractive errors in different height groups
In the ultra-low-height group, the mean spherical equiv-alent was –1.01 ±1.46 D (range: from 0.75 to –4.50 D) for the boys and –0.76 ±1.55 D (range: from 1.25 to –3.75 D) for the girls. The overall mean spherical equivalent of the ultra-low-height group was –0.92 ±1.49 D (range: from 1.25 to –4.50 D).
In the low-height group, the mean spherical equivalent was –0.98 ±1.71 D (range: from 6.25 to –6.50 D) for the boys and –0.86 ±1.19 D (range: from 1.25 to –5.50 D) for the girls. The overall mean spherical equivalent of the low-height group was –0.94 ±1.53 D (range: from 6.25 to –6.50 D).
In the high-height group, the mean spherical equiva-lent was –1.08 ±1.90 D (range: from 5.25 to –8.00 D) for the boys and –1.36 ±2.02 D (range: from 5.25 to –7.00 D) for the girls. The overall mean spherical equivalent of the high-height group was –1.20 ±1.95 D (range: from 5.25 to –8.00 D).
In the ultra-high-height group, the mean spherical equiv-alent was –0.75 ±1.42 D (range: from 0.75 to –4.25) for the boys and –1.91 ±1.63 D (range: from 0.75 to –5.25 D) for the girls. The overall mean spherical equivalent of the ultra-high-height group was –1.45 ±1.64 D (range: from 0.75 to –5.25 D).
Body height in school-age children
These school-age children mostly had normal body height. Of the 1,000 boys, 8.8% were in the ultra-low-height group, 50% in the low-height group, 37.2% in the high-height group, and 4.0% in the ultra-high-high-height group; of the 696 girls, 5.8% were in the ultra-low-height group, 44.3% in the low-height group, 38.5% in the high-height group, and 8.6% in the ultra-high-height group. Overall,
there were 8.7% of the children in the ultra-low-height group, 47.6% in the low-height group, 37.7% in the high-height group, and 5.9% in the ultra-high-high-height group.
Regression analysis of refractive errors
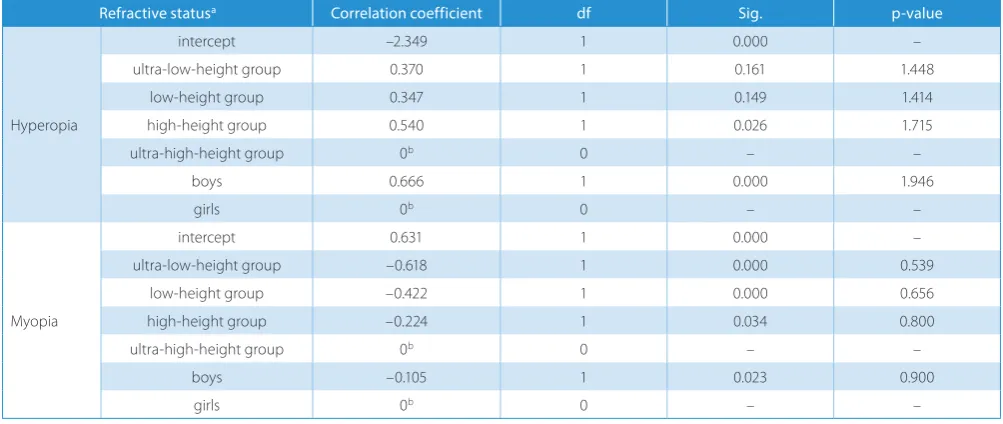
The collinearity analysis revealed that age was highly collinear with eyes, gender and body height. Results from the likelihood ratio test showed that left, right or bilateral eyes had no significant differences in the regression model, where not age (p = 0.601; >0.05), but gender and height exhibited significant differences (p < 0.05). Results from the regression analysis of refractive errors with gender and height are shown in Table 1.
With the height growth, the number of children with hyperopia was decreased. Moreover, the prevalence rate of hyperopia was higher in the boys than in the girls. But no significant difference in the prevalence of hyperopia was found among the 4 height groups (p > 0.05). In con-trast, the increasing prevalence of myopia was driven by the increase in the body height. But there were no significant differences between the high-height and ultra-high-height groups (p = 0.145) as well as between boys and girls (p = 0.880).
Regression analysis of degree of myopia
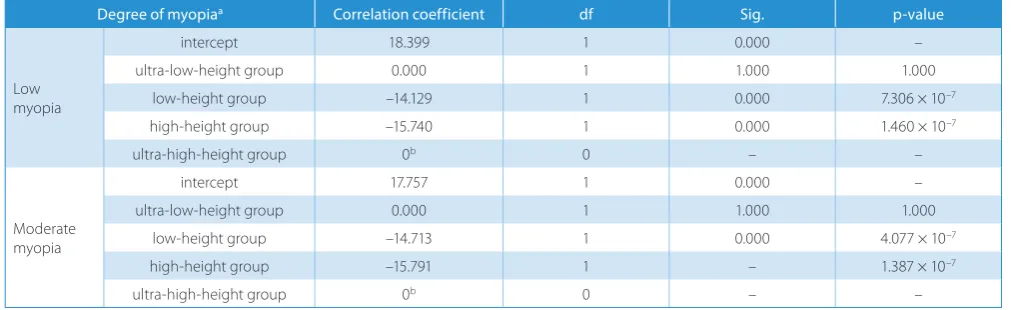
The colinearity analysis showed that age was highly col-linear with eyes, gender and body height. Results from the likelihood ratio test showed gender (p = 0.369; >0.05) and eyes (p = 0.602; >0.05) had no significant differences in the regression model, where not age, but the body height exhibited a significant difference (p < 0.05). Results from the regression analysis of refractive errors with the body height are shown in Table 2.
Table 1. Multivariate non-conditional logistic regression analysis of the refractive status with gender and height in school-age children
Refractive statusa Correlation coefficient df Sig. p-value
Hyperopia
intercept –2.349 1 0.000 –
ultra-low-height group 0.370 1 0.161 1.448
low-height group 0.347 1 0.149 1.414
high-height group 0.540 1 0.026 1.715
ultra-high-height group 0b 0 – –
boys 0.666 1 0.000 1.946
girls 0b 0 – –
Myopia
intercept 0.631 1 0.000 –
ultra-low-height group –0.618 1 0.000 0.539
low-height group –0.422 1 0.000 0.656
high-height group –0.224 1 0.034 0.800
ultra-high-height group 0b 0 – –
boys –0.105 1 0.023 0.900
girls 0b 0 – –
The prevalence of low myopia showed no significant dif-ference between the ultra-low-height and ultra-high-height group (p = 1.000), but it was significantly higher in the ultra-high-height group than in the low- and high-height groups (p < 0.001). The prevalence of moderate myopia was significantly lower in the low-height group than in the high-height group (p < 0.001), but there was no significant difference between the ultra-low-height and ultra-high-height groups (p = 1.000).
Discussion
The refractive development of children is related to many factors, such as close work, especially in reading, writing, watching TV, etc. Such major environmental factors, es-pecially the wide application of electronic equipment, can result in an increase in children’s myopia; secondly, there is a certain relationship between the education levels and the refractive development.6–8 Myopia is in a close
relation-ship with genetic factors; if the parents or siblings have high myopia, the incidence of myopia will be increased.9,10
But the main factor in the refractive development is the growth of the eye axis. Research shows that the axial growth 0.3–0.5 mm rose has risen by an average of 1 di-opter.11,12 A large number of studies suggest the correlation
between the eye axis and height. The study by Saw et al. showed that in Singaporean children, the AL was +0.29 mm longer in boys and +0.32 mm longer in girls for every 0.10 m difference in height.13 The data from Wong et al.
showed that among Singaporean Chinese adults, taller persons were more likely to have longer AL.14 In the study
by Wang et al., longitudinal changes of AL and height were concluded to occur concomitantly in children.4 In a study
by Ojaimi et al., of 1,765 Sydney year-1 school students, children in the 1st quintile for height had an average AL
of 22.39 ±0.04 mm, compared with 22.76 ±0.04 mm in chil-dren in the 5th quintile.15 Our study aimed to explore the
correlation between the types of refractive errors and the same-age children height.
In our study, school-age children aged 7–14 mainly de-veloped hyperopia and emmetropia, but nearly half of these children suffered from myopia with an incidence of 47.5%. The prevalence rates of low, moderate and high myopia were 69.9%, 27.9%, and 2.2%, respectively. Compared with the boys, the prevalence of myopia was slightly higher, but the prevalence of moderate myopia was slightly lower in the girls.
Among the children of the same age, the overall preva-lence of myopia was increased in proportion to the in-creased body height in both boys and girls. That is, the higher the body height, the higher the incidence of myopia. For the boys, the prevalence rate of hyperopia was similar among the ultra-low-height, low-height and high-height groups, but it was a little lower in the ultra-high-height group compared with the former 3 groups. For the girls, the prevalence rate of hyperopia was similar among the low-height, high-height and ultra-high-height groups, but it was slightly lower in the ultra-low-height group com-pared with the former 3 groups. The overall prevalence of hyperopia showed a decreasing trend along the increase of the body height, with a dramatical decrease in the ultra-high-height group. For the boys, the prevalence of em-metropia was higher in the high-height and ultra-high-height groups than in the ultra-low-ultra-high-height and low-ultra-high-height groups; the contrary was the case for the girls, where the prevalence of emmetropia was lower in the high-height and ultra-high-height groups than in the ultra-low-height and low-height groups.
Low myopia was the main type of myopia in the 4 height groups. In the ultra-low-height and ultra-high-height groups, the prevalence of moderate myopia was lower in the boys than in the girls; but in the low- and high- height groups, i.e., within the normal range of height, the prevalence of moderate myopia was higher in the boys than in the girls. Compared with low and moderate myopia, high myopia was less reported in the 4 height groups, and what is more, there was no high myopia case in the ultra-low-height and ultra-high-height groups. In the ultra-low-height group, only few boys suffered from high myopia; however,
Table 2. Multivariate non-conditional logistic regression analysis of the degree of myopia with age and height in school-age children
Degree of myopiaa Correlation coefficient df Sig. p-value
Low myopia
intercept 18.399 1 0.000 –
ultra-low-height group 0.000 1 1.000 1.000
low-height group –14.129 1 0.000 7.306 × 10⁻⁷
high-height group –15.740 1 0.000 1.460 × 10⁻⁷
ultra-high-height group 0b 0 – –
Moderate myopia
intercept 17.757 1 0.000 –
ultra-low-height group 0.000 1 1.000 1.000
low-height group –14.713 1 0.000 4.077 × 10⁻⁷
high-height group –15.791 1 – 1.387 × 10⁻⁷
ultra-high-height group 0b 0 – –
high myopia was found both in the boys and in the girls from the high-height group. However, the occurrence and development of high myopia were close associated with a genetic factor, and further studies are needed to confirm the direct connection between high myopia and the body height.
School-age children mostly have normal height. In this study, only 8.7% of children were assigned to the ultra-low-height group and 5.9% were in the ultra-high-height group. In the ultra-low-height group, the boys and girls were in equal proportions; in the ultra-high-height group, the proportion of girls was higher than that of boys.
Findings from the multivariate non-conditional logistic regression analysis showed that at the same age, an in-crease in the prevalence of myopia was proportional to the increase of the body height, but there was no difference between the high-height and ultra-high-height group. Myopic children mostly suffered from low myopia, fol-lowed by moderate myopia. Additionally, there were many children developing moderate myopia in the high-height group with a higher prevalence of moderate myopia. These results indicate that the intraocular structure develops relatively fast in children who are taller than their peers. There is a consensus that the extension of the optic axis plays an important role in myopia occurrence and develop-ment.16–19 Some studies suggest that the height
develop-ment is associated with the optic axis, i.e., the optic axis increases proportionally in the children with a rapid devel-opment in the body height, thereby resulting in an quick-ened increase in refractive errors.15
Whether there are corresponding endocrine changes related to the increase of body height that accelerate the de-velopment of myopia need to be further studied. Here, the refractive monitoring is preferred for school-age children who are taller than their peers. Considering the relatively high incidence of high myopia in the ultra-low-height and ultra-high-height groups, a large-sample study will be car-ried out in the future.
References
1. Saw S, Katz J, Schein OD, Chew S, Chan T. Epidemiology of myopia. Epidemiol Rev. 1996;18(2):175–187.
2. Fredrick DR. Myopia. BMJ. 2002;324:1195–1199.
3. Hua M, Mo XF. Factors influencing axial length and the predictive value of axial length for myopia. Zhonghua Yanshiguangxue yu Shi-juekexue Zazhi. 2013;25:441–444.
4. Wang D, Ding X, Liu B, Zhang J, He M. Longitudinal changes of axial length and height are associated and concomitant in children. Invest Ophthalmol Vis Sci. 2011;52(11):7949–7953.
5. Li H, Ji CY. Height and weight standardized growth charts for Chi-nese children and adolescents aged 0 to 18 years. Zhonghua Erke Zazhi. 2009;47:487–492.
6. Saw SM, Hong R, Zhang M, et al. Near-work activity and myopia in rural and urban schoolchildren in China. J Pediatr Ophthalmol Stra-bismus. 2001;38(3):149–155.
7. Saw S, Chua W, Hong C, et al. Nearwork in early-onset myopia. Invest Ophthalmol Vis Sci. 2002;43(2):332–339.
8. Ip JM, Saw SM, Rose KA, et al. Role of near work in myopia: Findings in a sample of Australian school children. Invest Ophthalmol Vis Sci. 2008;49(7):2903–2910.
9. Teikari JM, Donnell JAO, Kaprio J, Koskenvuo M. Impact of heredity in myopia. Hum Hered. 1991;41(3):151–156.
10. Fotouhi A, Etemadi A, Hashemi H, Zeraati H, Baileywilson JE, Moham-mad K. Familial aggregation of myopia in the Tehran Eye Study: Esti-mation of the sibling and parent-offspring recurrence risk ratios. Br J Ophthalmol. 2007;91(11):1440–1444.
11. Grosvenor T, Scott R. Role of the axial length/corneal radius ratio in determining the refractive state of the eye. Optom Vis Sci. 1994; 71(9):573–579.
12. Mallen EAH, Gammoh Y, Albdour MD, Sayegh FN. Refractive error and ocular biometry in Jordanian adults. Ophthalmic Physiol Opt. 2005;25(4):302–309.
13. Saw SM, Chua WH, Hong CY, et al. Height and its relationship to refraction and biometry parameters in Singapore Chinese children. Invest Ophthalmol Vis Sci. 2002;43(5):1408–1413.
14. Wong TY, Foster P, Johnson GJ, Klein BEK, Seah SKL. The relation-ship between ocular dimensions and refraction with adult stature: The Tanjong Pagar survey. Invest Ophthalmol Vis Sci. 2001;42(6):1237– 1242.
15. Ojaimi E, Morgan IG, Robaei D, et al. Effect of stature and other anthropometric parameters on eye size and refraction in a popu-lation-based study of Australian children. Invest Ophthalmol Vis Sci. 2005;46(12):4424–4429.
16. Hepsen IF, Evereklioglu C, Bayramlar H. The effect of reading and near-work on the development of myopia in emmetropic boys: A prospective, controlled, three-year follow-up study. Vision Res. 2001;41(19):2511–2520.
17. Long PZ, Yang GJ, Liao ZH. Optic axial length and myopia. Zhonghua Yanke Zazhi. 1998;75:132–145.
18. Grosvenor T, Goss DA. Role of the cornea in emmetropia and myo-pia. Optom Vis Sci. 1998;75(2):132–145.