Are Random Forests Truly the Best Classifiers?
Michael Wainberg m.wainberg@utoronto.ca
Department of Electrical and Computer Engineering University of Toronto, Toronto, ON M5S 3G4, Canada;
Deep Genomics, Toronto, ON M5G 1L7, Canada
Babak Alipanahi babak@psi.toronto.edu
Department of Electrical and Computer Engineering University of Toronto, Toronto, ON M5S 3G4, Canada
Brendan J. Frey frey@psi.toronto.edu
Department of Electrical and Computer Engineering University of Toronto, Toronto, ON M5S 3G4, Canada;
Deep Genomics, Toronto, ON M5G 1L7, Canada
Editor:Nando de Freitas
Abstract
The JMLR study Do we need hundreds of classifiers to solve real world classification problems? benchmarks 179 classifiers in 17 families on 121 data sets from the UCI repository and claims that “the random forest is clearly the best family of classifier”. In this response, we show that the study’s results are biased by the lack of a held-out test set and the exclusion of trials with errors. Further, the study’s own statistical tests indicate that random forests do not have significantly higher percent accuracy than support vector machines and neural networks, calling into question the conclusion that random forests are the best classifiers.
Keywords: classification, benchmarking, random forests, support vector machines, neural networks
1. Errors in Results
The authors state that they used the following training procedure for 102 of the 121 benchmarked data sets, which were not already divided into training and test sets:
“One training and one test set are generated randomly (each with 50% of the available patterns) [...]. This couple of sets is used only for parameter tuning (in those classifiers which have tunable parameters), selecting the parameter values which provide the best accuracy on the test set. [...] Then, using the selected values for the tunable parameters, a 4-fold cross validation is developed using the whole available data. [...] The test results is the average over the 4 test sets.”
hy-perparameters (based on the descriptions in the original paper, these include rrlda R,
sda t, PenalizedLDA t, sparseLDA R, fda t, mda t, pda t, rda R, hdda R, rbf m, rbf t,
rbfDDA t, mlp m, mlp C, mlp t, avNNet t, mlpWeightDecay t, nnet t, pcaNNet t, pnn m,
elm m, elm kernel m, lvq R, lvq t, dkp C, svm C, svmlight C, LibSVM w, svmRadial t,
svmRadialCost t, svmLinear t,svmPoly t,lssvmRadial t,rpart t,rpart2 t,ctree t,
ctree2 t,JRip t,C5.0 t,MultiBoostAB LibSVM w,Bagging LibSVM w, rf t,RRF t, cfor-est t,parRF t,RRFglobal t,MultiScheme w,knn R,knn t,IBk w,pls t,spls R, multi-nom t, CVParameterSelection w, gaussprRadial t and possibly others). The authors justify the procedure by stating that:
“We must emphasize that, since parameter tuning and testing use different data sets, the final result can not be biased by parameter optimization, because the set of parameter values selected in the tuning stage is not necessarily the best on the test set.”
While hyperparameter tuning and testing do technically use different sets of examples, since one is a subset of the other, the two sets must be disjoint to avoid bias.
Further, the authors did not follow the stated procedure: the test evaluation does not use cross-validation since the 4 test sets1 are not independent. For instance, trains, the smallest benchmark with 10 examples, has two examples in each test set, with the following indices: {2,9},{4,9},{4,9}, and{4,7}. This means that examples 4 and 9 are given three times the weight of examples 2 and 7 when calculating the test accuracy, and the other six examples are ignored. This negates the purpose of cross-validation, which is to give equal importance to every example.
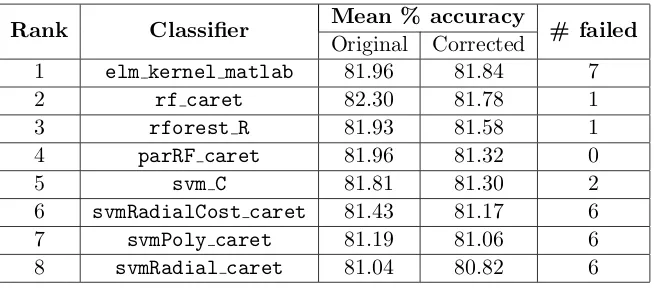
The results are also biased by the exclusion of trials with errors. If a classifier is unable to run a particular benchmark, that benchmark is excluded when calculating the classifier’s mean percent accuracy—but it is not excluded for classifiers that ran it successfully. Effectively, each classifier is evaluated on a slightly different set of benchmarks, so the mean percent accuracies are not directly comparable. We re-evaluated the mean percent accuracy of the top 8 classifiers on only the benchmarks successfully run by all 8, and found that a neural network, elm kernel matlab, was competitive with random forests (Table 1), even having the highest mean accuracy (albeit by a very small, insignificant, margin). Still, this neural network also had the highest number of failures (which did not count toward mean accuracy).
2. Flawed Conclusions
The conclusion that “The random forest is clearly the best family of classifiers” is flawed. The paper gives three arguments for why random forests are the best family: “The eight random forest classifiers are included among the 25 best classifiers having all of them low ranks”, “The family RF has the lowest minimum rank (32.9) and mean (46.7), and also a narrow interval (up to 60.5), which means that all the RF classifiers work very well”, and “3 out of [the] 5” best classifiers are random forests.
The problem with the first two arguments is that the notion of a “best family” is not well defined, and is sensitive to the choice of classifiers included in each family. For instance,
Rank Classifier Mean % accuracy # failed
Original Corrected
1 elm kernel matlab 81.96 81.84 7
2 rf caret 82.30 81.78 1
3 rforest R 81.93 81.58 1 4 parRF caret 81.96 81.32 0
5 svm C 81.81 81.30 2
6 svmRadialCost caret 81.43 81.17 6 7 svmPoly caret 81.19 81.06 6 8 svmRadial caret 81.04 80.82 6
Table 1: Mean percent accuracy of the top 8 classifiers reported in Fern´andez-Delgado et al. (“Original”) and when re-evaluated on only the benchmarks successfully run by all
8 (“Corrected”). The number of benchmarks which failed to run for each classifier is also shown. A neural network, elm kernel m, has the highest mean percent accuracy, followed by three random forest models and then four support vector machine models.
the worst-performing neural network is the direct parallel perceptron (Fernandez-Delgado et al. (2011)), developed by the authors of the original paper and designed to favour extreme computational efficiency over accuracy. Similarly, the worst rule-based classifier, ZeroR w, is a baseline that always predicts the majority class. Mean accuracy conflates these classifiers with others in the same family that are designed to favour accuracy. Also, larger families will tend to have greater variance, with a lower minimum rank and a higher maximum rank.
The argument that “3 out of [the] 5” best classifiers are random forests is also questionable. The three best random forest classifiers are actually a single classifier (randomForest in R) with different wrappers (parRF tis parallelized; parRF tandrf tuse caret) and settings for mtry, the number of features in each tree (parRF tuses a grid search of 2 to 8 in steps of 2;rf t searches from 2 to 29 in steps of 3, andrforest R sets mtry =√#f eatures), so it would be more correct (but still not fully correct) to say that one out of the three best classifiers is a random forest and two are support vector machines.
Most importantly, the results do not show that the best random forests perform any better than the best support vector machines and neural networks. The authors conducted paired t-tests showing that the differences in accuracy between the top-ranked random forest parRF tand the other top eight models, including support vector machines, neural networks and other random forests, are not statistically significant (left panel of Fig. 4 in Fern´andez-Delgado et al.). This calls into question the conclusion that random forests are the best classifiers.
Classifier Normality p
elm kernel matlab 1e-29
rf caret 2e-43
rforest R 1e-36
svm C 2e-15
svmRadialCost caret 7e-13
svmPoly caret 5e-09
svmRadial caret 4e-14
avNNet caret 6e-10
C5.0 caret 1e-21
Table 2: pvalues that the differences betweenparRF tand each of the other top 10 classifiers, across all benchmarks where both classifiers ran without errors, are not normally distributed. Allp values are significant, indicating that none of the differences are normally distributed.
Classifier
Paired t-test p, errors set to 82%
(Fig. 4 in original paper)
Paired t-test p, excluding errors
Wilcoxon signed-rank p, excluding errors
elm kernel matlab 1 0.5 0.4
rf caret 0.4 0.3 1
rforest R 1 0.9 0.1
svm C 0.8 1 0.8
svmRadialCost caret 0.5 0.6 0.6
svmPoly caret 0.3 0.4 0.4
svmRadial caret 0.1 0.2 0.1
avNNet caret 0.03 0.03 0.02
C5.0 caret 0.001 0.001 0.0001
Table 3: Using a Wilcoxon signed-rank test instead of a paired t-test, and removing missing values rather than incorrectly imputing them, results in the same conclusions about the significance of the differences between parRF tand each of the other top 10 classifiers.
100% accuracy and others of which are so difficult that most classifiers achieves below 30% accuracy, so it is unreasonable to assume that a classifier would achieve 82% accuracy on every failed benchmark. A hypothetical classifier that failed to run every benchmark would be considered as good as parRF taccording to this imputation method! However, using the Wilcoxon signed-rank test, which does not make the same assumption of normality, and removing benchmarks where either classifier gave an error rather than imputing to 82%, results in the same conclusions about significance (Table 3).
To support the conclusion that parRF t is better than the second-ranked classifier
“AlthoughparRF tis better thansvm Cin 56 of 121 data sets, worse thansvm C
in 55 sets, and equal in 10 sets, [...] svm Cis never much better than parRF t: when svm C outperforms parRF t, the difference is small, but when parRF t
outperforms svm C, the difference is higher [...]. In fact, calculating for each data set the difference between the accuracies of parRF tandsvm C, the sum of positive differences (parRF is better) is 193.8, while the negative ones (svm C
better) sum [to] 139.8.”
parRF t and svm Care only equal for 8 benchmarks, not 10: the two benchmarks where
svm C gave an error are erroneously counted towards this total. Also, the quoted figures are for rf t, not parRF t: the true figures, based on the online results, are 220.4 and 219.6. The above statement does not imply that the difference between parRF t and svm C is significant, since it is equivalent to saying that the difference in mean percent accuracy between the two classifiers, across the 119 benchmarks where both ran without errors, is
220.4−219.6
119 benchmarks ≈0.007, a difference that the pairedt-test already showed to be insignificant (p = 0.834 in Fig. 4 of the original paper, or p = 0.8 using a Wilcoxon signed-rank test). (Note that 0.007 does not exactly equal 82.0−81.8, the difference between the reported
mean percent accuracies of parRF t andsvm C, because these accuracies are biased by the exclusion of trials with errors as discussed in Section 1.) Notably, the difference between
rf tand svm C(193.8 vs 139.8), while larger, is also insignificant (Wilcoxon signed-rank p = 0.8).
3. Availability of Code
Code to reproduce the three tables and calculate the sum of positive and negative accuracy differences between pairs of classifiers is available as a supplement to this paper.
Acknowledgments
We thank Andrew Delong and Michael Leung for useful discussions. Funding was provided by the Natural Sciences and Engineering Research Council of Canada’s John C. Polanyi Award and grants from the Canadian Institutes of Health Research and the Ontario Genomics Institute. MW was supported by a Rogers Scholarship. BA was supported by a joint Autism Research Training and NeuroDevNet Fellowship. BJF is a Fellow of the Canadian Institute for Advanced Research.
References
Manuel Fernandez-Delgado, Jorge Ribeiro, Eva Cernadas, and Sen´en Barro Ameneiro. Direct parallel perceptrons (DPPs): fast analytical calculation of the parallel perceptrons weights with margin control for classification tasks. Neural Networks, IEEE Transactions on, 22 (11):1837–1848, 2011.