INTRODUCTION
The acid present in the human stomach is normally HCl. A substantial body of evidence indicates the necessity of proper gastric pH for optimal health. HCl secretion is required for protein digestion by activating pepsinogen to pepsin.
The various food items consumed by human body are divided in to two categories 1) Plant food 2) Animal food. Plant and animal foods have a natural pH in the range of distinctly acidic pH of about 2 to a neutral pH of about 7.
Material Science Research India Vol. 5(1), 101-106 (2008)
Mass transfer and kinetic studies of antacids
in acetic acid and its modeling simulation
S.S. SONAWANE¹, G.A. USMANI², V.R. PARATE²,
K.S. WANI¹ and S.J. WAGH³
¹Department of Chemical Engineering, SST’S College of Engineering and Technology, Bambhori, Jalgaon (India)
²University Department of Chemical Technology, North Maharashtra, University, Jalgaon - 425 001 (India) ³Department of Chemical Engineering, Dr. Babasaheb Ambedkar
Technological University, Lonere, Dist. Raigad - 402 103 (India) (Received: March 08, 2008; Accepted: May 06, 2008)
ABSTRACT
One of the most common remedies for excessive digestive fluid (stomach acidity) is antacid tablets, and dilute acetic acid (such as vinegar) with a pH of around 3.0 is a reasonably effective and inexpensive representative of the weak organic acids present in human body. This acid may then be employed for simple laboratory simulation of the biochemical processes associated with neutralization by commercial over-the-counter antacids to relieve gastric distress. The laboratory experiment of the dissolution of an antacid tablet in dilute acetic acid solution may be taken as an example of mass transfer with chemical reaction, and the mass transfer and reaction steps can be studied. In the present work, experiments were carried out to determine the mass transfer coefficients and the reaction velocity constant for different commercially available antacid tablets in dilute acetic acid solution. The model developed by Stuart’s [1], which is a lumped parameter model, has been tested and modified to suit the present-work conditions. Also, an independent model has been developed to take care of mass transfer and reaction steps of the process. The model parameters
κ
,∧
a KL
have been evaluated.
Key words: Antacid, ph, lumped parameter model, mass transfer, Reaction rate, reflux (large & small)
EXPERIMENTAL
A laboratory experiment on combined mass transfer and kinetics is required to be conducted. Specifically, the increase of pH in distilled water may be followed with a digital pH meter during neutralization with commercial antacid tablets. The reagents were purchased from the local market. With reaction
500 ml of solution in distilled water is transferred to a 1000-ml beaker, which is placed on a stand equipped with a three-blade stirrer. This beaker is then positioned below the electrode assembly, and the latter is lowered into the acid solution. Care is taken to ensure that the stirring bar will not hit the electrode tip during operation. The initial pH of the acid solution is recorded. Thermometer hooked up and used to note down the temperature during reaction. No appreciable change in the temperature could be recorded. Without reaction
The above procedure was repeated only with a difference that the aqueous acid solution was replaced by distilled water.
Analytical data
The pH-time data were recorded online during course of reaction. The concentrations of the aqueous acid solutions have previously been calibrated against pH.
log[
]
log
10
A pH
A
pH
H
C
C
+ −
= −
=
=
Plot. 1 shows the calibration plot of pH versus concentration of aqueous acid solutions. Model development
Very simply, the overall ionic reaction for this system is.
3 3 2 2
2H O+CO
→
3H O+CO
...(1)1
2
k +
3 2 k 2 3
CH COOH+H O
←⎯⎯
⎯⎯→
H O +CH COO
...(2)Model equations
(
)
1 1 (1 ²)( ² ²) 2 1
1n 3 2 / 3
3 ² 2 (1 ²)( ² ²) 3
r l lR R R
TAN R l l TAN kt
R l lr r l
βγ
⎧ + − + ⎛ ⎛ −⎞⎞⎫
⎪ + − − ⎪=
⎨ + − + ⎜⎝ ⎜⎝ ⎟⎠⎟⎠⎬
⎪ ⎪
⎩ ⎭
...(3) This is Stuart’s model
Model developed in the present work
The antacid tablet Reflux contains NaHCO3 as the main reactive ingredient therefore the following reaction is assumed to take place in the liquid phase.
+
-3 3 2 2
H O + HCO
2H O+CO
A+B
2R+S
→
↑
→
...(4)A is the species available in the aqueous phase and the species B is originally present in the solid phase which reaches the reaction site by the mechanism of dissolution i.e. mass transfer. Development of model equations
The number of moles of A remaining at any time, t, can be found from the following balance. [Number of moles of A at time t] = [Number of moles of A initially present] – [Number of moles of A reacted u p to time t]
0 0
A A A A
N
=
N
−
N
−
X
...(5)For a constant volume system used in the present work,
0 0 0
(1
)
A A A A A A
C
=
C
−
C X
=
C
−
X
...(6)Similarly, a mole balance on B can be written as (Number of moles of B at time t) = (Number of moles of B initially) + (Number of moles of B reaching the reaction site)–(Number of moles of B reacted upto time t)
0
(
) (
)
B Bt B A A
N
=
N
+
R
× −
t
N X
...(7)Where RBis the rate of dissolution and is expressed as,
(
)
B L Bs B
Where, B
R = Rate of mass transfer of B, kmol/m3.s
L
K
= mass transfer coefficient, m/s
a
Λ = Interfacial area of the tablet per unit
volume liquid, m-1 =(m²/m³), assumed
constant
B
C
= Instantaneous concentration of B in the liquid, mol/lit
S
B
C
= Concentration of saturated solution of B in contact with the tablet, gmoles/ lit.
Substituting equation (8) in (7), we get for a constant volume system
...(9)
Nothing that
i B
C
= 0 and solving for CB
we get
0
1
1
A L
B BS A
L L
C
K a t
C
C
X
K a t
K a t
Λ
Λ Λ
=
−
+
+
...(10)A mole balance on species A in the batch system is (Rate of disappearance) = - (Rate of accumulation of A)
0
A A
A A
dN
dX
r V
N
dt
dt
−
= −
=
...(11)For an irreversible second-order reaction
− =
r
AkC C
A B ...(12)Substituting
C
A, andB
C
from equation (7) and (11)
[
]
0 (1- ) ( ) 0
A A A Bi L BS B A A
r kC X C K a C C t C X
− = + − − ...(13)
0 0
²
(1 ) (1 )
1 1
A
A A A
A L BS A
L L
kC
X X X
r kK a C C
K a t K a t
∧
∧ ∧
− −
⎛ ⎞
− =⎜⎝ ⎟⎠ −
+ + ...(14)
Substituting for
−
r
A from equation (11)...(15)
Eq (15) is a second order ordinary differential equation to be solved by numerical technique. The equation contains two model parameters
k
and KL . The parameter is determined via a separate experiment. In the present work, equation (15) is solved by Runga Kutta 4th order method using
several values of k. The versus time data generated by equation (15) is compared with the experimental versus time data keeping all other parameters the same such that
is a minimum. Thus the fitted parameter k is optimized, by
2
χ
test.
Evaluation of the Model parameters of Stuart’s For Verification of first order of the reaction, following equation must be solved and linearity of f(r) versus t must be checked.
(
)
1 1 (1 ²)( ² ²) 2 1
1n 3 2 / 3
3 ² 2 (1 ²)( ² ²) 3
r l lR R R
TAN R l l TAN kt
R l lr r l
βγ ⎧ + − + ⎛ ⎛ −⎞⎞⎫ ⎪ + − − ⎪= ⎨ + − + ⎜⎝ ⎜⎝ ⎟⎠⎟⎠⎬ ⎪ ⎪ ⎩ ⎭ ...(3) The above equation can be expressed as
f(r) = k t ...(3a)
Graphs of Stuart’s Tablet : Reflux large
Graphs of the Model developed in the present work:-Tablet: - Reflux small
-In
BS B. .
In
B LB BS B
C
C
C
K a t
C
C
C
∧
⎛
⎞
⎛
−
⎞
=
=
⎜
⎟
⎜
−
⎟
⎝
⎠
⎝
⎠
Plot. 1.1: Graph of Stuart’s Model Equation for f (r) (LHS) vs. time to check for order of reaction to
Plot. 1.2: Graph of Stuart’s Model Equation for f (r) (LHS) vs. time to Check for order of reaction to
be unity. Order of the reaction is not One since there is no linearity between f (r) (LHS) and time
Plot: 1.3 Plot according to equation A for Reflux antacid for finding
out
∧
a KL.
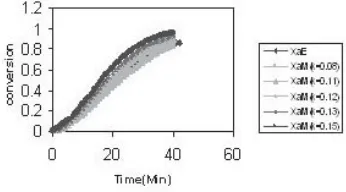
Plot 1.4 Comparison of conversions obtained from the experimental and that calculated from the model assuming different values of k
Plot 1.5 Comparison of conversions obtained from the experimental and that calculated from the model assuming different values of k
Plot 1.6 Comparison of conversions obtained from the experimental and
that calculated from the model assuming different values of
κ
Plot 1.7 Comparison of conversions obtained from the experimental and
Plot 1.8 Comparison of conversions obtained from the experimental and
that calculated from the model assuming different values of
κ
.Plot 1.9 Comparison of conversions obtained from the experimental and that
calculated from the model assuming different values of
κ
.
Evaluation of reaction rate constant, k
Graphs of the Model developed in the present work
The parameter
k
is the fitted parameter of the model which can be calculated by finding the best fit to the experimental data of
X
A versus time. In the present work, equation (12) is solved by Runga Kutta 4th order method using severalvalues of k. The versus time data generated by equation (12) is compared with the experimental versus time data keeping all other parameters the same such that
(
,mod ,exp)
²
A el A t²
Allt
X
=
∑
X
−
X
is a minimum. Thus the fitted parameter k is optimized, by
2
χ
test.
The following graphs are the results of these calculations.
RESULTS AND DISCUSSION
Dissolution of an antacid is indeed a case of mass transfer with chemical reaction. There exists a reactive component in the tablet which reacts with the gastric contents of the human body, which are essentially acidic in nature. In the present study, same system is taken as a simulation of concerned biochemical processes, and through simple experiments concentration-time data have been collected. A model has been formed to represent the data. The mass transfer step and the reaction step are considered. The mass transfer coefficient,
which is assumed to be invariant to the acetic acid concentration in the range of concentration studied, has been calculated by using the experimental data. The reaction velocity constant for the reaction between the solid reactant and acetic acid in dilute aqueous solution has been estimated using the experimental data and later the same has been optimized with the least square regression method. The experimental data for reactive as well as non-reactive systems in the present work have been collected using a pH-time record on-line with the experiment, as suggested by Stuart’s [1], which is a reasonably accurate method. The results from the experiment and the model calculation are discussed in this Chapter.
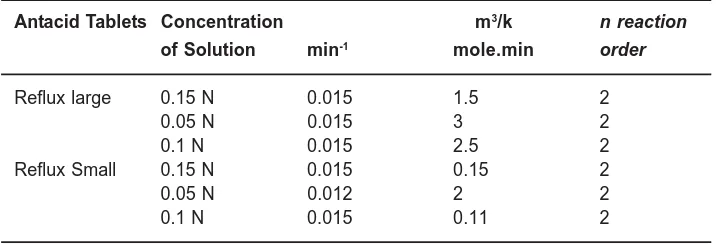
Table 1.1 shows the estimated values of the model parameters for various tablets studied in the work. It can be noticed that the K L.a∧v a l u e s
contain sodium bicarbonate as a reactive component which is certainly more reactive towards acetic acid than aluminum hydroxide and the magnesium hydroxide of other two tablets. Also, as expected the rate constant is reasonably constant at different initial concentrations of acetic acid. There is a slight discrepancy among the values of rate constant for small Reflux, which is mainly because of the disintegration of particles (this is a visual
observation for Reflux small) from the tablet while dissolution is going on for that tablet. The overall order of the reaction has been assumed as two and the conversion versus time curve of the model calculation show a close fitting trend to that of experimental. Analyzing the results obtained from the model of Stuart’s [1], it is seen that the order of reaction in any case is never unity (the same is the inference drawn by the authors for their own
Table 1: Results of the model developed in the present work Antacid Tablets Concentration
.
L
K a∧
κ
m3/k n reaction
of Solution min-1 mole.min order
Reflux large 0.15 N 0.015 1.5 2
0.05 N 0.015 3 2
0.1 N 0.015 2.5 2
Reflux Small 0.15 N 0.015 0.15 2
0.05 N 0.012 2 2
0.1 N 0.015 0.11 2
reactions also). They have further applied the differential method of analysis to the experimental data and evaluated the order to be @1.5. However, the success of differential method of analysis always depends on the correctness of derivative-estimation. Also, theirs is a lumped parameter model in which separate study of the two important steps can not be made. The present experimental study clearly shows that there is an order of magnitude difference between the mass transfer coefficient and the reaction rate constant. Therefore, the interplay of these two steps must be reflected in the model.
CONCLUSION
From the experimental and the model studies of the present work, it can be concluded that the system of dissolution of a pH tablet in dilute acetic acid solution may be taken as a good simulation for the study of reactive dissolution of a solid in a liquid, and the conventional chemical engineering concepts of mass transfer and reaction can be satisfactorily applied to a relatively less complex biochemical process such as the one of neutralization by an antacid.
REFERENCES
1. B. Sivashankar, “Food Processing and Preservation”. Prentice-Hall India. New Delhi p-1-67 (2002).
2. Stuart A. Sanders, Jude t. Sommerfield, “A