ISSN: 2306-9007 Xu & Xiaohua (2018) 670
I
www.irmbrjournal.com September 2018I
nternationalR
eview ofM
anagement andB
usinessR
esearchVol. 7 Issue.3
R
M
B
R
The Source of Industrial Agglomeration: Evidence from
China’s Manufacturing Industries
GUO XU
Faculty of Management and Economics, Dalian University of Technology, Dalian, Liaoning Province, 116024.
SUN XIAOHUA
Faculty of Management and Economics, Dalian University of Technology, Dalian, Liaoning Province, 116024.
Email: sxh_dut@sina.com
Abstract
In deepening Chinese industrialization, industrial agglomeration is an important way to realize industrial transformation and upgrading, and it is worthwhile to find the sources of agglomeration effects. Starting from three features of industrial agglomeration, this paper reconstructs industrial agglomeration indexes based on geographical absolute concentration, specialized division and economic connections among industries, calculates labor and capital agglomerations in 13 manufacturing industries of China from 2004 to 2013, and finds that labor agglomeration declines slowly while capital agglomeration increases year by year. Furthermore, this paper divides the manufacturing industries into three types, namely, the labor-intensive, the capital-intensive and the technology-labor-intensive, according to common factor intensity, and carries out an empirical test of the relationship between factor agglomeration and productivity. As the results show, capital agglomeration has a significant impact on both the single and the total factor productivity (TFP) of all three industries; on the contrary, labor agglomeration only has impacts on the labor-intensive industry, a weak impact on the technology- intensive industry, and no impact on the capital-intensive industry. Therefore, the agglomeration effects of Chinese industries mostly come from the capital factor. We should pay more attention to the positive role of capital agglomeration and avoid crowding effect resulted from excessive concentration during the industrial intensive development process.
Keywords: Industrial Agglomeration, Agglomeration Index, Single Factor Productivity, Total Factor Productivity, Agglomeration Effect.
Introduction
ISSN: 2306-9007 Xu & Xiaohua (2018) 671
I
www.irmbrjournal.com September 2018I
nternationalR
eview ofM
anagement andB
usinessR
esearchVol. 7 Issue.3
R
M
B
R
stage, to adapt to the requirement of structural optimization and intensive development, factor agglomeration in the production of different industries manifests features of succession. On the one hand, modern manufacturers adopt complete sets of and advanced technical equipment, showing an obvious capital agglomeration trend; on the other hand, due to the increasing labor cost, the low-end manufacturing industry and OEM enterprises cannot maintain the processing mode by using materials supplied by clients, so the traditional labor-intensive industry has gradually lost its advantages and labor agglomeration is declining. What’s the influence of the change of the industrial production mode and the factor endowment condition on factor agglomeration? What is the influence of the change of factor agglomeration on production efficiency? In other words, what is the source of industrial agglomeration, labor or capital? This paper will make a detailed discussion on the above questions to provide valuable theoretical foundation for the policy-making in building industrial agglomeration areas.
The view that industrial agglomeration benefits from externalities was first put forward by Marshall and later built into a model by Arrow and Romer—the model is called Marshall-Arrow-Romer (MAR) externalities in the academic circle. Jacobs (1970) emphasized the diversified externalities produced by knowledge spillover among complementary industries and pointed out that the concentration of diversified industries can drive economic growth. As to the cause of industrial agglomeration, Arauzo (2005) discovered that manufacturers are likely to agglomerate in an urban place with intensive labor forces. Henderson (2003)proved that the close connection between upstream and downstream enterprises is an important impetus for the agglomeration of manufacturers. Head and Mayer (2004) also found that intermediate input and technology spillover have an obvious influence on the spatial distribution of manufacturing enterprises. In the theoretical framework of the agglomeration economy, many scholars made empirical studies on industrial agglomeration. Some scholars, such as Ciccone and Hall(1993), Brülhart and Mathys (2008) , verified the positive effect of industrial agglomeration on production efficiency; others concluded that industrial agglomeration’s impact on productivity is not always monotonically increasing, it may have hinder productivity improvement through crowding effect (Broersma & Oosterhaven, 2009).
The calculation method of agglomeration is the foundation of studies on industrial agglomeration effect. There are four calculation methods: the method by use of the location quotient (LQ Method); the method based on market concentration, including Herfindahl Index (H Index), Spatial Gini Coefficient (G Index) and redirection agglomeration index (EG Index)(Ellison & Glaeser, 1997); the method by use of geographical agglomeration density index represented by that of Ciccone and Hall; the emerging method represented by use of D-O Index (Duranton & Overman, 2005) and product similarity geographical agglomeration index(Long & Zhang, 2011). In the selection of measurement indexes, most scholars measure the degree of industrial agglomeration from the perspective of the labor factor; a few scholars take capital as the measurement standard and mainly start with the relation of capital agglomeration and economic growth(Baldwin & Martin, 2004; Robert-Nicoud, 2006) without emphasis on the influence of capital agglomeration on productivity.
ISSN: 2306-9007 Xu & Xiaohua (2018) 672
I
www.irmbrjournal.com September 2018I
nternationalR
eview ofM
anagement andB
usinessR
esearchVol. 7 Issue.3
R
M
B
R
productivity, in an attempt to explore and verify the source of industrial agglomeration in China and explain the questions that have been ignored in existing studies.
Measurement method improvement of the industrial agglomeration index
Correct measurement of industrial agglomeration is the prerequisite for the study of agglomeration effect. It should be based on the basic features of industrial agglomeration to establish reasonable measurement indexes of the agglomeration index.
Construction of the industrial agglomeration index
According to the theory of externalities, industrial agglomeration has three obvious features. The first is geographical absolute concentration. It is the typical feature of industrial agglomeration. The higher the industrial agglomeration in one region is, the higher geographical density one certain index of the production has. The second is specialized division. Agglomeration externalities include Marshall’s externalities and Jacob’s externalities, corresponding to localization economies and urbanization economies, respectively (Rosenthal & Strange, 2004). Localization economies refer to that the productivity of one single enterprise benefits from the large-scale agglomeration effect of the industry, manifesting as the specialized division within one industry (Helsley & Strange, 2007). The third is economic connections among industries. Another phenomenon from Jacob’s externalities is the urbanization economy which refers to the productivity of one single enterprise or subdivided industry benefiting from the large-scale agglomeration effect of other local industries, manifesting as the close technical connection among industries.
Although industrial agglomeration has the above three features, current methods measuring the level of industrial agglomeration only emphasize one of the features. The features and shortcomings of six commonly-adopted methods are concluded as follows. First, the LQ Method mainly measures the specialization level, but fails to recognize geographical distribution of industries and the industrial relationship. Second, the method by use of EG Index and G Index considers the geographical distribution of industries, but the distribution which is geographically relative concentration, ignores the agglomeration difference and inter-industry relationship due to difference in sizes. Third, Ciccone and Hall’s geographical agglomeration density method studies geographical absolute concentration, but fails to reflect the inter-industry relationship and specialized division. Fourth, the D-O Index method can fully embody the geographical absolute distribution and industrial concentration, but fails to reflect the inter-industry relationship. Fifth, Long and Zhang’s product similarity geographical agglomeration index method considers the inter-industry input-output exchanges, but lacks the measurement of geographical density (Long & Zhang, 20111).
To reflect the three features of industrial agglomeration, firstly, this paper adopts the industry similarity index to measure economic connections and overcome the problem that the SITC-4 Standard cannot connect with Chinese industry standard. Secondly, this paper measures the specialized division level with the commonly-used entropy index method in the academic circle. In this way, the measurement indexes of industrial agglomeration include three variables: geographical density, specialization level and industry similarity. The index is the result by multiplying the three variables, then the index forms of labor agglomeration and capital agglomeration are:
c i c i j
ij c
i
w
LZ
LD
labor
Cluster
,
,
, (1)c i c
i j
ij c
i
w
CZ
CD
capital
ISSN: 2306-9007 Xu & Xiaohua (2018) 673
I
www.irmbrjournal.com September 2018I
nternationalR
eview ofM
anagement andB
usinessR
esearchVol. 7 Issue.3
R
M
B
R
where c represents region, i represents industry,
Cluster
labor
i,c andCluster
capital
i,care the labor agglomeration index and the capital agglomeration index, respectively; LZc,iand CZi,c are the professional levels of the labor and the capital, respectively; LDi,c and CDi,c are the densities of labor and capital,respectively;
j ij
w
is the technical and economic connection between i industry and other intermediateindustries.
The Index Selection
The measurement of the labor agglomeration index and the capital agglomeration index should be based on equations (1) and (2) and select specific indexes from geographical density, specialization level and industry similarity.
Geographical Density
Geographical concentration is the most direct demonstration of industrial agglomeration. In the paper, Ciccone and Hall’s method of measuring the geographical absolute density is adopted to build the measurement indexes of the amount of labor and capital in one unit area. These indexes are:
c c i c
i
labor
s
LD
,
,/
,CD
i,c
capital
i,c/
s
c (3)where
labor
i,c、capital
i,care the amount of workers and fixed assets respectively, and scis the area of the c region.Industrial Specialization
The specialization degree is an internal feature of industrial agglomeration. By using the entropy index measurement method for reference, the levels of labor specialization and capital specialization can be measured:
i c
i c c
i c
i i c i c
i c
L L
L L
LZ
, , ,
, ,
,
;
i c
i c c
i c
i i c i c
i c
A A
A A
, , ,
, ,
, CZ
(4)
where
LZ
c,iis the level of labor specialization of i industry in c region, andCZ
c,i is the level of capital specialization of i industry in c region. Specifically, Lc,i is the number of laborers of i industry in cprovince and
A
c,iis the amount of net fixed assets of i industry in c province. Industry SimilarityISSN: 2306-9007 Xu & Xiaohua (2018) 674
I
www.irmbrjournal.com September 2018I
nternationalR
eview ofM
anagement andB
usinessR
esearchVol. 7 Issue.3
R
M
B
R
Thus, this paper represents the industry similarity with the cosine of vector quantity in direct consumption coefficient matrix to measure inter- industry economic and technical connection. The industry similarity can be showed as follows:
k k kj ki
kj k
ki ij
a a
a a w
2 2
(5)
where akiand akjare the elements in k position in the structure column vector of the direct consumption coefficient in i industry and j industry respectively. If two industries have a high similarity, the value of wij is near 1. Then, the sum of the similarity of i industry with all other industries is
j ij
w (i j).
Calculated results of Chinese industrial agglomeration indexes
The data used for the calculation of Chinese industrial agglomeration indexes are from China Industry Economy Statistical Yearbook (2005–2014), deleting the industries lacking data and choosing 20 two-digit manufacturing industries as the samples. The calculation of the industry similarity is based on the industry classification of the input-output table, as the industry classifications in China Industry Economy Statistical Yearbook and that of the input-output tables are different, so the standards of the two industry classification methods need to be unified. According to the sub-industry classification standard in the two-digit manufacturing industries in the input-output table, the 20 selected sub-industries are combined into 13 manufacturing industries in the input- output table. Meanwhile, to investigate the influence of labor and capital agglomerations on the productivity in different industries, this paper classifies the 13 manufacturing industries into the labor-intensive, capital-intensive and technology- intensive types and obtains the labor agglomeration index from 2004 to 2013 (see Table 1). To compare the differences between the methods for calculating the agglomeration indexes used in this paper and other studies, this paper lists the calculated results of geographical density and entropy index.
Table 1 Calculated results of labor and capital agglomerations in different industries
Type Labor agglomeration Capital agglomeration
Industry Agglomer
ation Index
Geograp hical density
Entropy index
Agglom eration Index
Geograp hical density
Entrop y index
Labor-intensive
Agricultural and sideline food processing and
tobacco industry
5.6090 2.1261 2.2379 39.8434 36.2093 0.9866
Textile industry 15.6415 2.1948 1.7521 55.3822 19.1363 0.6628 Papermaking and paper
products industry Petroleum processing, coking and nuclear fuel
processing industry
3.1713 0.5647 2.0127 106.1573 13.7658 0.9649
Labor-intensive
Petroleum processing, coking and nuclear fuel
processing industry 0.7574 0.3527 2.8223 25.9154 26.0586 1.2811 Non-metallic mineral
products industry 11.7940 1.5799 2.1863 82.4767 29.1418 0.9326 Metal smelting and rolling
ISSN: 2306-9007 Xu & Xiaohua (2018) 675
I
www.irmbrjournal.com September 2018I
nternationalR
eview ofM
anagement andB
usinessR
esearchVol. 7 Issue.3
R
M
B
R
Source: compiled and calculated by the authors.
To further compare the differences in the industrial agglomeration levels among labor- intensive, capital-intensive and technology-capital-intensive industries, this paper draws the trends of the agglomeration indexes changes of the three types of industries from 2004 and 2013 (see Fig.1 and Fig. 2). The cross-section contrast shows that, as for the indexes of labor and capital agglomerations during the same period, the technology- intensive industry has the highest, the capital-intensive industry the second highest and the labor-intensive industry the lowest. And the indexes of the three types have obvious differences. It is necessary to study the agglomeration effect of different types of industries according to factor intensity. From the time sequence, the labor agglomeration indexes of the labor-intensive and the capital-intensive industries have a slow dropping trend year by year. The agglomeration index of the technology-intensive industry before 2010 has a small fluctuation, but drops obviously after 2010. The capital agglomeration index in the three types of industries has an increasing trend, and the increase trend of the technology-intensive industry is the most obvious.
Model setting and endogenous treatment
The calculation of the agglomeration indexes shows that the factor agglomeration in different types of industries has a big difference. Then, does the factor agglomeration have influence on the productivity as expected? What are the influences of labor and capital agglomerations on the industrial productivity? In other words, which factor agglomeration improves productivity? In the following part, this paper will construct an econometric model of the industrial agglomeration effect and discuss the possible endogenous problems.
General and special equipment manufacturing
industry 72.0616 4.3415 1.9683 587.0692 60.4974 0.8105 Transportation equipment
manufacturing industry 30.2621 2.9653 2.2868 499.7180 67.8327 0.9552 Electric machinery and
equipment industry 56.6206 2.6530 1.6704 265.4166 29.4122 0.7333
Labor-intensive
Chemical industry 22.8238 2.6872 2.3516 497.4461 83.9203 0.9914 Communications equipment,
computers and other
electronic equipment industry 40.8732 3.9986 2.5314 487.3224 67.5479 0.7457 Instruments and office
machinery manufacturing
industry 10.1804 0.6331 1.7680 37.7409 5.1863 0.7539
0 5 10 15 20 25 30 35 40 45 50
2004 2005 2006 2007 2008 2009 2010 2011 2012 2013 0 100 200 300 400 500 600 700
2004 2005 2006 2007 2008 2009 2010 2011 20122013
labor-intensive capital-intensive technology-intensive manufacturing industry
ISSN: 2306-9007 Xu & Xiaohua (2018) 676
I
www.irmbrjournal.com September 2018I
nternationalR
eview ofM
anagement andB
usinessR
esearchVol. 7 Issue.3
R
M
B
R
Model Setting
As there are direct and indirect influences between factor agglomeration and productivity, this paper will take labor productivity, capital productivity and total factor productivity as the explained variables and take labor and capital agglomerations as the explanatory variables to study the origin of the industrial agglomeration more comprehensively. Based on existing research achievements and taking into account the possible non-linear relation between factor agglomeration and productivity, this paper adds the quadratic term of factor agglomeration and builds the following econometric model.
c i c i c i c i c
i c
i
Cluster
Cluster
X
YL
' ,. , 2 2
, 1
,
(6)' , ' ' '
. , 2 '
2 , '
1
,c ic ic ic i c ic
i
Cluster
Cluster
X
YK
(7)'' , '' '' '' . , 2 ''
2 , ''
1
,c ic ic ic i c ic
i
Cluster
Cluster
X
TFP
(8)where YL, YK and TFP represent the labor productivity, the capital productivity and the total factor productivity, respectively.
Cluster
i,c is capital agglomeration or labor agglomeration acquired in the abovetext,
Cluster
2i,c is the quadratic term.X
i,c is the control variable, including capital deepening level,foreign capital, enterprise quantity, enterprise scale, proportion of the state-owned economy, depreciation rate and human capital.
Effectiveness of the endogenous treatment and the instrumental variable selection
According to the agglomeration theory, the geographical agglomeration of factors will drive productivity through externalities, and enterprises with a high productivity will attract a large number of enterprises to gather together by relying on the external scale economy and thus promotes the formation of industrial agglomeration. Therefore, agglomeration and productivity have obvious bidirectional causality. If endogeneity is not considered, evaluation by use of least square method and the panel fixed effect model will cause deviations and inconsistencies of the regression results. The effective method of solving the endogeneity problem is the instrumental variable method. By drawing on the previous experience, this paper selects the infrastructure construction as the instrumental variable of regional industrial agglomeration, and the specific index is the road mileage in a unit area in a province, that is, the road density.
There are three reasons to select the public infrastructure as the instrumental variable. First, existing research has shown that infrastructure construction has a high relevance to labor and capital agglomeration. Krugman’s new economic geography holds that developed infrastructure can obviously reduce transportation cost, bring scale economy and attract enterprises to agglomerate in a region. In addition, as the infrastructure has a spatial centripetal force, it can change the spatial distribution of economic activities (Holl, 2004) and attract capital and employees to agglomerate in the same region. Second, the infrastructure is the exogenous variable of the model. The infrastructure in all regions can maintain unchanged within a certain time. For example, the road and railway constructions are often changed with interference from local governments, which is irrelevant to the model setting. Although the infrastructure level is high in developed regions in China, the local infrastructure has no direct causal relation with the industrial productivity at the industry level. Thus, the infrastructure is an exogenous variable, independent of the error term. Third, scholars at home and abroad often choose road density as the proxy variable to measure the economic effect of the infrastructure, such as Bronzini and Piselli(2009). Based on the above analysis, it is reasonable and reliable to select road density as the instrumental variable of labor and capital agglomeration.
ISSN: 2306-9007 Xu & Xiaohua (2018) 677
I
www.irmbrjournal.com September 2018I
nternationalR
eview ofM
anagement andB
usinessR
esearchVol. 7 Issue.3
R
M
B
R
Data sources and the variable description
The samples in this paper are the panel data of 13 manufacturing industries in 30 provinces from 2004 and 2013. The data of the explained variables and control variables are from China Industry Economy Statistical Yearbook (2005–2014) and Chinese Statistical Yearbook. The industrial agglomeration data come from above calculations.
The dependent variables include: labor productivity (YL), capital productivity (YK) and the total factor productivity (TFP ). The TFP of the industry is obtained by DEA method: input variables are the net fixed assets and the total employees in the industry; the output variable is the total output value of the industry.
According to past research, the following control variables are chosen: capital deepening (KL) reflects the usage of the labor capital per capita; foreign direct investment (FDI) chooses the ratio of the value of the foreign direct investment in one industry to the total output value; the number of enterprises (Num) ; the scale of an enterprise (Scale) ; the proportion of the state- owned economy (State) ; the depreciation rate (Dep) uses the ratio of the accumulated depreciation to the net fixed assets; human capital (Stu) takes the ratio of the number of college students to the total number of population of the region .
Industrial agglomeration and the single factor productivity
In this part, the influence of the industrial agglomeration on the single factor productivity is studied. As the production modes among labor-intensive, capital-intensive and technology-intensive industries are different, and the productions of industries within one type of industry have a similarity, three such representative industries as agricultural and sideline food, petroleum processing and instrument and apparatus are analyzed and compared.
Empirical study of labor productivity
Due to possible endogenous problems, it is necessary to use the instrumental variable panel data method to conduct endogenous tests. The result shows that the result of Hausman Test for endogeneity is significant at the level of 1% (P=0.00); thus, it is scientific to use the instrumental variable method to do endogenous treatment. Furthermore, the test value F of the weak instrumental tool is higher than ten, so the null hypothesis of the weak instrumental variable is refused, which proves that the selected instrumental variable is effective.
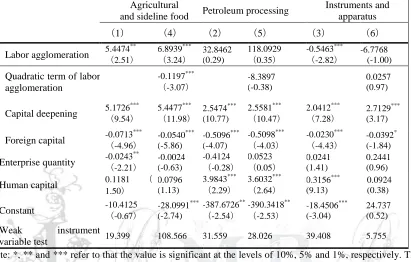
From the regression results of models (1)–(3) in Table 2, the influences of labor agglomeration in different industries on labor productivity are different. In the agricultural and sideline food industry, the influence is significantly positive; in the instruments and apparatus industry it is significantly negative, and in the petroleum processing industry it is not significant. This shows that labor agglomeration has a positive influence on the labor-intensive agricultural and sideline food industry, a negative influence on the technology-intensive instruments and apparatus industry, and non-significant influence on the capital-intensive petroleum processing industry.
To test the non-linear influence of factor agglomeration on productivity, this study adds the quadratic term of labor agglomeration (see models (4)–(6)) and finds that the influence on the agricultural and sideline food industry is negative, showing a reverse U-shaped relation, demonstrating that the higher the labor agglomeration is, the stronger the driving force of the labor productivity will be within a certain range, but its positive influence will weaken and even produce crowding effect impeding the productivity after reaching a certain degree.
ISSN: 2306-9007 Xu & Xiaohua (2018) 678
I
www.irmbrjournal.com September 2018I
nternationalR
eview ofM
anagement andB
usinessR
esearchVol. 7 Issue.3
R
M
B
R
increase of labor intensity cannot obviously increase the output value, but may reduce labor productivity. In the petroleum processing industry, labor agglomeration, whether it is a monomial term or a quadratic term, has no obvious positive influence on the labor production.
Table 2 Regression result of the influence of the labor agglomeration on the labor productivity Agricultural
and sideline food Petroleum processing
Instruments and apparatus
(1) (4) (2) (5) (3) (6)
Labor agglomeration 5.4474
**
(2.51)
6.8939***
(3.24)
32.8462 (0.29)
118.0929
(0.35)
-0.5463***
(-2.82)
-6.7768 (-1.00)
Quadratic term of labor agglomeration
-0.1197***
(-3.07)
-8.3897 (-0.38)
0.0257 (0.97)
Capital deepening 5.1726
***
(9.54)
5.4477***
(11.98)
2.5474*** (10.77)
2.5581***
(10.47)
2.0412***
(7.28)
2.7129*** (3.17)
Foreign capital -0.0713
***
(-4.96)
-0.0540*** (-5.86)
-0.5096*** (-4.07)
-0.5098***
(-4.03)
-0.0230***
(-4.43)
-0.0392* (-1.84)
Enterprise quantity -0.0243
**
(-2.21)
-0.0024 (-0.63)
-0.4124
(-0.28)
0.0523
(0.05)
0.0241 (1.41)
0.2441 (0.96)
Human capital 0.1181 (
1.50)
0.0796 (1.13)
3.9843***
(2.29)
3.6032***
(2.64)
0.3156*** (9.13)
0.0924 (0.38)
Constant -10.4125 (
-0.67)
-28.0991*** (-2.74)
-387.6726**
(-2.54)
-390.3418**
(-2.53)
-18.4506*** (-3.04)
24.737 (0.52)
Weak instrument
variable test 19.399 108.566 31.559 28.026 39.408 5.755
Note: *, ** and *** refer to that the value is significant at the levels of 10%, 5% and 1%, respectively. The test result of the weak instrument variable is the F value.
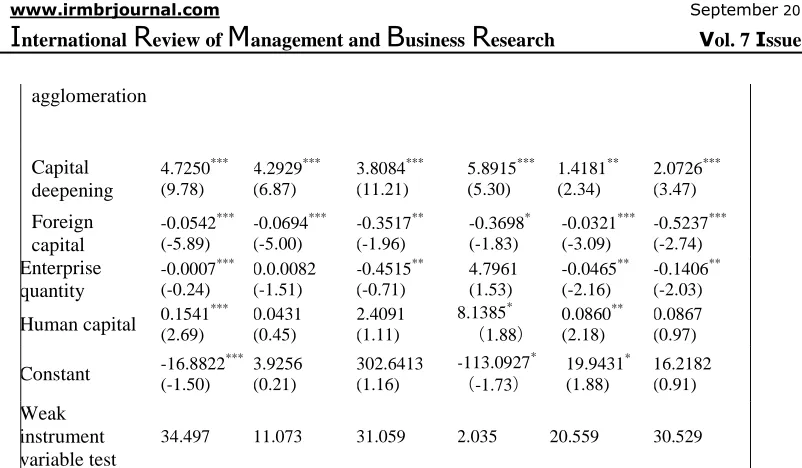
The effect of capital agglomeration on labor productivity is analyzed (see Table 3). In the labor-intensive agricultural, sideline food industry and the technology-intensive instruments and apparatus industry, Model (4) and Model (6) show that the quadratic term and monomial term of capital agglomeration are significantly negative and significantly positive respectively, and have a reverse U-shaped relation to the labor productivity.
This shows that the moderate concentration of mechanical equipment is helpful to increase labor productivity, but excessive agglomeration will have crowding effect. In the capital-intensive petroleum industry, the quadratic term of agglomeration is not significant and does not have non-linear relations, while the monomial term in the linear function is significantly positive. This shows that higher capital agglomeration can create better conditions for laborers to use more advanced technical equipment, master more production skills and improve labor productivity.
Table 3 Regression result of the influence of capital agglomeration on labor productivity Agricultural and sideline
food Petroleum processing
Instruments and apparatus
(1) (4) (2) (5) (3) (6)
Capital agglomeration 0.2783*** (3.30) 1.0147** (2.38) 8.6065* (1.73) -50.89985 (-1.62) 0.3142 (3.53) 1.3759** (2.20) Quadratic term of capital
ISSN: 2306-9007 Xu & Xiaohua (2018) 679
I
www.irmbrjournal.com September 2018I
nternationalR
eview ofM
anagement andB
usinessR
esearchVol. 7 Issue.3
R
M
B
R
agglomeration
Capital deepening
4.7250*** (9.78)
4.2929*** (6.87)
3.8084*** (11.21)
5.8915*** (5.30)
1.4181** (2.34)
2.0726*** (3.47)
Foreign capital
-0.0542*** (-5.89)
-0.0694*** (-5.00)
-0.3517** (-1.96)
-0.3698* (-1.83)
-0.0321*** (-3.09)
-0.5237*** (-2.74)
Enterprise quantity
-0.0007*** (-0.24)
0.0.0082 (-1.51)
-0.4515** (-0.71)
4.7961 (1.53)
-0.0465** (-2.16)
-0.1406** (-2.03)
Human capital 0.1541
*** (2.69)
0.0431 (0.45)
2.4091 (1.11)
8.1385*
(1.88)
0.0860** (2.18)
0.0867 (0.97)
Constant -16.8822
*** (-1.50)
3.9256 (0.21)
302.6413 (1.16)
-113.0927*
(-1.73)
19.9431* (1.88)
16.2182 (0.91)
Weak instrument variable test
34.497 11.073 31.059 2.035 20.559 30.529
Note: *, ** and *** refer to that the value is significant at the levels of 10%, 5% and 1%, respectively. The test result of the weak instrument variable is the F value.
The test result of capital productivity
Besides labor productivity, capital productivity is another important manifestation of enterprises’ productivity. We take the capital productivity as the explained variable and fit Model (7) by adopting the instrumental variable; Hausman Test for endogeneity shows that labor and capital agglomerations are endogenous variables which need endogenous treatment by use of instrumental variables. We take road density as the instrumental variable to eliminate the endogenous problem, and obtain the regression result of Table 4 and Table 5.
Table 4 studies the influence of labor agglomeration on capital productivity. The result shows that the influence of labor agglomeration on the capital productivity in the agricultural and sideline food industry is non-significant, and that the increase of labor intensity does not obviously improve the capital productivity. In the petroleum processing and the instruments and apparatus industries, labor agglomeration has no non- linear trend, but has one-direction negative influence on the productivity.
The possible reason is that capital productivity measures the input-output efficiency of the equipment. In the agricultural and sideline food industry, the usage of mechanical equipment has a weak relation to the laborers, but for the petroleum processing and instruments and apparatus industries they depend more on the investment of mechanical equipment. The investment in labor force will crowd out capital investment in efficient equipment, which is not beneficial to capital productivity.
The empirical result of the relation of capital agglomeration and capital productivity is shown in Table 5. In the three types of industries, the result is consistent: coefficients of the monomial terms of capital agglomeration are significantly positive; their quadratic terms are significantly negative. This shows that whatever the type of the industry is, the moderate capital agglomeration is helpful for enterprises to use large production equipment and form the scale economy effect, which can obviously increase capital productivity.
ISSN: 2306-9007 Xu & Xiaohua (2018) 680
I
www.irmbrjournal.com September 2018I
nternationalR
eview ofM
anagement andB
usinessR
esearchVol. 7 Issue.3
R
M
B
R
Table 4 Regression result of influences of labor agglomeration on capital productivity
Agricultural and sideline food Petroleum processing Instruments and apparatus
(1) (4) (2) (5) (3) (6)
Labor agglomeration -0.1737
(-0.71) 0.8206 (0.67) -4.0972** (-2.43) -54.6107 (-0.60) -0.1951*** (-2.97) -3.5497 (-0.51)
Quadratic term of labor agglomeration -0.0108 (-0.65) 3.4920 (0.60) 0.0145 (0.51)
Capital deepening 0.053
*** (3.16) 0.0380 (1.15) -0.0135** (-2.58) -0.0131 (-0.63) -0.0288 (-0.52) 0.2372 (0.39)
Foreign capital -0.0026
*** (-4.79) -0.0031*** (-4.86) -0.6367* (-1.79) -0.2921 (-0.25) -0.0042*** (-3.33) -0.0153 (-0.60)
Enterprise quantity 1.4627
*** (4.34) 0.3660 (0.22) -1.2703 (-0.77) -2.9707 (-0.32) 0.4724 (0.66) -0.8968 (-0.15)
Human capital -16.8898
*** (-4.98) -13.4340*** (-2.88) 0.0567 (0.32) 0.9534 (0.51) -2.5395* (-1.95) -1.4588 (-0.18)
Constant 5.1604
*** (3.70) 1.9255 (0.57) 7.4678*** (2.80) 41.9808 (0.64) 8.5795*** (6.01) 33.5858 (0.60)
Weak instrument variable test 75.507 150.773 13.070 26.025 12.350 34.507
Note: *, ** and *** refer to that the value is significant at the levels of 10%, 5% and 1% respectively. The test result of the weak instrument variable is the F value.
Table 5 Regression result of the influence of capital agglomeration on capital productivity
Agricultural and sideline food Petroleum processing Instruments and apparatus
(1) (4) (2) (5) (3) (6)
Capital agglomeration 0.0139
***
(4.75)
0.0335***
(4.11)
0.0146*** (3.29)
0.1769***
(3.13)
0.0265*** (5.66)
0.0723*** (6.04)
Quadratic term of capital agglomeration
-0.0001*** (-3.60)
-0.0004***
(-3.17)
-0.0001*** (-5.83)
Capital deepening -0.0062 (
-0.38)
-0.0124
(-0.71)
-0.0005 (-0.35)
-0.0082***
(-3.09)
-0.1964*** (-0.388)
-0.0451 (-1.09)
Foreign capital -0.0021
*** (-6.81) -0.0027*** (-6.79) 2.5838 (0.51) 5.8170
(0.73)
-0.0031*** (-3.06)
-0.0037*** (-3.60)
Enterprise quantity 1.4836
*** (4.57) 1.2594*** (3.54) 1.9465*** (5.07) 2.8373*** (4.98) 0.6892 (1.07) 0.9589
(1.62) Human capital -20.2115
*** (-7.26) -18.9458*** (-6.48) -0.1790** (-2.37) -0.1526 (-1.45) -3.0533** (-2.49) -3.1890***
(-2.80)
Constant 4.5331
*** (12.08) 4.5599*** (11.66) 2.4349*** (5.73) 0.4456 (0.39) 6.2494*** (8.17) 4.5978***
(7.34) Weak instrument variable
test 14.022 15.237 54.894 12.683 47.930 44.787
Note: *, ** and *** refer to that the value is significant at the levels of 10%, 5% and 1%, respectively. The test result of the weak instrument variable is the F value.
ISSN: 2306-9007 Xu & Xiaohua (2018) 681
I
www.irmbrjournal.com September 2018I
nternationalR
eview ofM
anagement andB
usinessR
esearchVol. 7 Issue.3
R
M
B
R
Industrial agglomeration and the TFP
In addition to promoting the single factor productivity of labor and capital through sharing factor resources, obtaining scale economic benefits and improving specialization deepening, industrial agglomeration can also encourage knowledge flow and technical exchanges among enterprises, and increase the total factor productivity. The influence of labor and capital agglomerations on the TFP will be explored in the following part.
The empirical result and analysis
Here we also choose road density as the instrumental variable to treat the endogenous problem and get the regression result of the influence of labor agglomeration on the TFP (see Table 6). In Model (4), the quadratic term coefficient of labor agglomeration in the agricultural and sideline food industry is significantly negative, but the monomial term coefficient is significantly positive, showing that labor agglomeration and the TFP have a reverse U-shaped relation. The labor intensity can increase knowledge flow in the labor-intensive enterprises, which is helpful for employees to master production skills, enhance skills and proficiency, and increase the TFP. The monomial coefficient and the quadratic term coefficient of labor agglomeration in the petroleum processing industry are negative and positive respectively, manifesting a U-shaped relation. As is seen in the scatter diagram, most sample points are located in the negative correlation area, showing that labor agglomeration has a negative influence on the TFP of the capital-intensive industry. The labor agglomeration in the instruments and apparatus industry has a monotonous positive influence, meaning that in the technology-intensive industry, high- quality employees can study more advanced technologies and improve the technical level and efficiency through knowledge spillover.
Table 6 Regression result of the influence of labor agglomeration on the TFP
Agricultural and sideline food Petroleum processing Instruments and apparatus
(1) (4) (2) (5) (3) (6)
Labor agglomeration 0.0034
(0.35)
0.0267*** (3.36)
-0.2010*** (-3.65)
-0.5281*** (-4.14)
0.0090***
(3.30)
-0.0895 (-0.50) Quadratic term of labor
agglomeration
-0.0004***
(-2.76)
0.0336*** (4.00)
0.0004 (0.53)
Capital deepening -0.0053
(-1.59)
-0.0057** (-2.31)
-0.0003** (-2.37)
-0.0003*** (-3.07)
-0.0123***
(-3.35)
-0.004 (-0.01)
Foreign capital -1.2062
**
(-2.19)
-1.4803*** (-3.75)
-1.3086** (-2.23)
-1.3572*** (-2.69)
1.4384***
(2.09)
-2.4288 (-0.34)
Enterprise quantity -0.0121
***
(-2.81)
-0.0096** (-2.05)
0.0003 (0.31)
-0.0005 (-0.51)
0.0366**
(2.31)
0.0440 (0.87)
Human capital 6.3339
(1.41)
1.5184 (0.55)
0.7622 (0.16)
15.6830** (2.54)
-14.0777***
(-2.81)
-32.9438 (-0.79)
Constant 0.7608
***
(12.72)
0.7718*** (18.06)
0.7227 (9.94)
0.6042*** (10.34)
0.5832*** (7.08)
1.6146 (0.84) Weak instrument variable
test 13.465 108.084 23.098 30.666 25.860 30.215
Note: *, ** and *** refer to that the value is significant at the levels of 10%, 5% and 1%, respectively. The test result of the weak instrument variable is the F value.
ISSN: 2306-9007 Xu & Xiaohua (2018) 682
I
www.irmbrjournal.com September 2018I
nternationalR
eview ofM
anagement andB
usinessR
esearchVol. 7 Issue.3
R
M
B
R
showing that capital agglomeration is helpful for the sharing of production equipment in enterprises. In particular, it can realize technical cooperation and knowledge spillover through advanced technical equipment, and improve the TFP.
Table 7 Regression result of the influence of capital agglomeration on the TFP
Agricultural and sideline food Petroleum processing Instruments and apparatus
(1) (4) (2) (5) (3) (6)
Capital agglomeration 0.0026
**
(0.047)
0.0068*** (3.57)
0.0039*** (3.35)
0.0626 (1.08)
0.0008** (1.98)
0.0107 (0.88) Quadratic term of
capital agglomeration
-0.0001***
(-3.27)
-0.0001
(-1.08)
-0.0001 (-0.90)
Capital deepening -0.0065
**
(-1.99)
-0.0087*** (-3.12)
-0.0003 (-1.46)
-0.0036
(-1.17)
-0.0082** (-2.39)
-0.0073** (-2.27)
Foreign capital -1.4900
**
(-2.40)
-2.2987*** (-4.16)
-0.1659 (-0.22)
-2.1105
(-0.96)
1.5340** (2.12)
1.9368** (2.38)
Enterprise quantity -0.0206
***
(-3.11)
-0.0121** (-2.19)
0.0038*** (2.89)
0.0151
(1.20)
-0.0173 (-1.03)
0.0014 (0.10)
Human capital 2.6177 (0.59)
-5.9464 (-1.30)
-9.0618 (-1.60)
-54.3458
(-1.09)
1.0853 (0.45)
0.0402 (0.01)
Constant 0.7876
***
(11.78)
0.9004*** (16.12)
0.5579*** (7.71)
0.5645
(1.54)
0.4199 (7.58)
0.4070 (7.41) Weak instrument
variable test 33.435 26.073 31.591 0.566 35.856 49.935
Note: *, ** and *** refer to that the value is significant at the levels of 10%, 5% and 1%, respectively. The test result of the weak instrument variable is the F value.
Robustness test
To test the robustness of the regression results, this study selects three typical industries: the labor-intensive textile industry, the capital-intensive paper-making industry and the technology-intensive chemical industry. We make regression according to the process of the above text. The samples are selected from the panel data of 30 provinces from 2004 to 2013. The result shows that the textile industry, the paper-making industry and the chemical industry, and their respective factor intensive industries have consistent empirical results in both the signs of agglomeration variables and the statistical significance, which proves the reliability of the tests and conclusions.
ISSN: 2306-9007 Xu & Xiaohua (2018) 683
I
www.irmbrjournal.com September 2018I
nternationalR
eview ofM
anagement andB
usinessR
esearchVol. 7 Issue.3
R
M
B
R
Conclusion
Agglomeration development is a significant strategy for local governments to increase their industrial competitiveness and realize industrial upgrading. Based on three basic features of industrial agglomeration, namely, geographical absolute concentration, specialized division and economic connections among industries, this paper improves the measurement method of industrial agglomeration and calculates the labor and capital agglomerations of Chinese 13 provinces from 2004 to 2013. According to the factor intensity standard, the manufacturing industry is divided into the labor-intensive industry, the capital-intensive industry and the technology-capital-intensive industry. And this paper takes typical industries such as the agricultural and sideline food industry, the petroleum processing industry and the instruments and apparatus industry for examples to make an empirical test on the influence of the labor and capital agglomerations on the single and total factor productivity. Besides, this paper makes a robustness test by selecting the textile industry, the paper-making industry and the chemical industry. This paper has the following findings: in the manufacturing industry of all provinces, the labor agglomeration has a dropping trend, but the capital agglomeration has an increasing trend; the improvement of the single and total factor productivity depends on capital agglomeration, and the economic effect of labor agglomeration is embodied in some labor-intensive industries. The above result shows that the method taking the labor agglomeration as the key variable in present research may be not correct. With the deepening of Chinese industrialization, the labor factor is being replaced by the capital factor, and the labor agglomeration has an increasingly weak influence on productivity, especially in the capital-intensive industry. Thus, the advantages of the labor agglomeration such as the labor market sharing, the low trading cost and knowledge spillover will be replaced by the productivity effects of the capital agglomeration such as scale economy, machine equipment sharing, specialization deepening and technical spillover of upstream and downstream enterprises.
References
Arauzo Carod, J. M. (2005). Determinants of industrial location: An application for Catalan municipalities. Papers in Regional Science, 84(1), 105-120.
Baldwin, R. E., & Martin, P. (2004). Agglomeration and regional growth. In Handbook of regional and urban economics (Vol. 4, pp. 2671-2711). Elsevier.
Brülhart, M., & Mathys, N. A. (2008). Sectoral agglomeration economies in a panel of European regions. Regional Science and Urban Economics, 38(4), 348-362.
Broersma, L., & Oosterhaven, J. (2009). Regional labor productivity in the Netherlands: Evidence of agglomeration and congestion effects. Journal of Regional Science, 49(3), 483-511.
Bronzini, R., & Piselli, P. (2009). Determinants of long-run regional productivity with geographical spillovers: the role of R&D, human capital and public infrastructure. Regional Science and Urban Economics, 39(2), 187-199.
Ciccone, A., & Hall, R. E. (1993). Productivity and the density of economic activity (No. w4313). National Bureau of Economic Research.
Duranton, G., & Overman, H. G. (2005). Testing for localization using micro-geographic data. The Review of Economic Studies, 72(4), 1077-1106.
Ellison, G., & Glaeser, E. L. (1997). Geographic concentration in US manufacturing industries: a dartboard approach. Journal of political economy, 105(5), 889-927.
Head, K., & Mayer, T. (2004). Market potential and the location of Japanese investment in the European Union. Review of Economics and Statistics, 86(4), 959-972.
Helsley, R. W., & Strange, W. C. (2007). Agglomeration, opportunism, and the organization of production. Journal of Urban Economics, 62(1), 55-75.
Henderson, J. V. (2003). Marshall's scale economies. Journal of urban economics, 53(1), 1-28.
Holl, A. (2004). Transport infrastructure, agglomeration economies, and firm birth: empirical evidence from Portugal. Journal of Regional Science, 44(4), 693-712.
ISSN: 2306-9007 Xu & Xiaohua (2018) 684
I
www.irmbrjournal.com September 2018I
nternationalR
eview ofM
anagement andB
usinessR
esearchVol. 7 Issue.3
R
M
B
R
Long, C., & Zhang, X. (2011). Cluster-based industrialization in China: Financing and performance. Journal of International Economics, 84(1), 112-123.
Robert-Nicoud, F. (2006). Agglomeration and trade with input–output linkages and capital mobility. Spatial Economic Analysis, 1(1), 101-126.