International Journal of Engineering and Technology Innovation, vol. 5, no. 3, 2015, pp. 189-197
Application of Artificial Intelligence for Optimization
in Pavement Management
Reus Salini
1, 2, *, Bugao Xu
2, 3, Carl Anders Lenngren
41Neogennium Technologies, Florianópolis, Brazil.
2School of Human Ecology, University of Texas at Austin, Austin, USA. 3
Center for Transportation Research, University of Texas at Austin, Austin, USA.
4Sweco Civil, Vaesteraas, Sweden.
Received 15 May 2015; received in revised form 03 August 2015; accepted 03 August 2015
Abstract
Artificial intelligence (AI) is a group of techniques that have quite a potential to be applied to pavement engineering and management. In this study, we developed a practical, flexible and out of the box approach to apply genetic algorithms to optimizing the budget allocation and the road maintenance strategy selection for a road network. The aim is to provide an alternative to existing software and better fit the requirements of an important number of pavement managers. To meet the objectives, a new indicator, named Road Global Value Index (RGVI), was created to contemplate the pavement condition, the traffic and the economic and political importance for each and every road section. This paper describes the approach and its components by an example confirming that genetic algorithms are very effective for the intended purpose.
Keywords: artificial intelligence, genetic algorithms, pavement engineering, pavement management
1.
Introduction
It is widely acknowledged that a good pavement management system leads to savings of public spending on highways. Further, a higher level of service on the road pavements at network level can only be achieved through a proper and optimized multi-year planning. Due to the complexity and scale of the pavement management activities, the traditional analytical tools may not be able to provide good results [1] [2] [3] [4]. Although the artificial intelligence (AI) based methodologies have been demonstrated in the pavement engineering field, so far the number of successful applications transforming those possibilities into real results is by no means substantial, suggesting that the practical AI tools are underutilized in this specific field.
In 2010, Salini published a holistic approach for pavement performance modelling and service life prediction by using neural networks [5] including some important innovations such as the consideration of variables without data, or even totally unknown variables, and the aside failure criteria [6].
Genetic algorithms (GA) are the optimization tools that provide solutions to problems in pavement management. GA is a topology of artificial intelligence capable of optimizing problems through mimicking the natural selection and natural genetics, and thus identifying the best solution while overcoming the "combinatorial explosion" [7] [8]. The genetic algorithms follow Darwinian principles of natural selection by creating an environment where hundreds of possible solutions to a problem can
* Corresponding author. E-mail address: [email protected]
compete with one another, and only the fittest “survives”. Just as in biological evolution, each solution can pass along its good “genes” through “offspring” solutions so that the entire population of solutions will continue to evolve better solutions.
In 1998, Fwa et al. proposed the GA application to solve the network level pavement management planning by analyzing the time and type of maintenance or rehabilitation for every road section, the resource allocation by time and road section, and the total commitment of resources for each period of time [1]. One year later, Hoque et al. developed an algorithm for optimization of pavement management problems with multiple objectives by using a rank-based fitness alignment and two sets of GA (the simple and improved sets). The algorithms were tested with two objectives: maximizing the maintenance production in work days and minimizing the total maintenance costs. The simulations were also done with two additional objectives, i.e., maximizing the pavement condition and minimizing the total manpower requirements. According to the authors, the improved algorithm performed well for the former two objectives while having a reduced performance for the latter two objectives [9].
In Australia, Roper [10] used GA to select the best pavement intervention level and treatment existing in the Pavement Life-cycle Analysis and Treatment Optimization (PLATO) software [11] that contains models of pavement deterioration and the effect of maintenance and rehabilitation work. Roper [10] focused on fine tuning the population and mutation rate for the GA applied to simplified samples and with fewer variables than the full scale PLATO models. He concluded that the mutation rate is the most influential one on the optimization process. A similar work was done by Golroo and Tighe [12] that searched for the optimum GA structure for pavement management.
Scheinberg and Anastasopoulos [13] developed a multi-year and multi-constraint methodology to optimize the pavement maintenance and rehabilitation strategies based on integer programming. The used strategies were based on a decision-tree system while three types of constrains being considered: (1) restriction of costs or benefit attributes, (2) weighted restrictions of the average pavement condition and (3) the restriction of the road network percentage with the pavement condition above the desired threshold. According to the authors, the performed tests and simulations showed that the multi-year approach provides savings at an average of 28% compared to a year-to-year approach.
A similar work with a two-objective GA was done by Elhadidy et al. [14] to optimize the maximum pavement condition and the minimum costs. Working on the same subject, Torres-Machí et al. [15] explored different optimization methodologies, including selection based on ranking, mathematical optimization, near optimization and other methods to identify the optimal resources allocation for pavement management.
For programming the pavement management activities, Tayebi and others [16] developed an approach based on particle swarm optimization (PSO), another topology of artificial intelligence. The optimization was applied over four hypothetical cases with different relative costs of rehabilitation and maintenance activities, showing that PSO is a suitable tool for pavement management at the network level.
However, most the software tools for pavement management are essentially black-box solutions where a large number of inputs are required for calculating a maintenance strategy. Despite the efforts to allow some level of customization or calibration for the performance models, these software tools often require inputs that cannot be easily assessed or are too expensive, especially for small transportation agencies. Another common issue related to the software is the suggested strategies, which are not always suitable or viable.
different levels of investments. The new approach may enable the pavement manager to properly discuss with the administrators the required budget for the following years, or to use it as an alternative pavement management solution.
The principles shown here are actually valid for any number of roads or years, but for clarity the example network consists of two roads forecasted for one, five and ten years, respectively.
2.
Road Global Value Index (RGVI)
A number of indexes and performance indicators were developed and used to describe the pavement condition for various conditions. One of the most popular indexes is the Pavement Condition Index (PCI) developed by the United States Army Corps of Engineers and standardized as ASTM D6433 [17]. PCI is based on a survey of a large number of distresses such as cracks, potholes, rutting, and other visual inputs. PCI calculation requires expensive surveys and lacks a holistic view of the road value. In this study, we proposed a new and simplified index called the Road Global Value Index (RGVI) as follows:
RGVI =
Cars 1000+
Trucks
200 +ER+PR Cracks
4 + Rutting
2 +
IRI 2
(1)
where:
The RGVI has four basic components:
Pavement condition described in terms of cracked area for all classes of cracks, rutting and International Roughness Index (IRI);
Traffic data including the daily average number of cars and trucks;
Economic relevance that is a number describing the importance of a particular road for the economy. The higher the value, the more important the road is. For example: a road connecting an industrial district to a major highway will have a higher economic relevance than a road connecting a small farm. If no economic classification is available, all roads can be set with the same economic relevance number;
Political relevance which is represented by a number that will show the political importance of a particular road. The higher the number, the higher the relevance. It allows the pavement manager to consider the political guidelines for maintenance and improvement of the road network. For example, if there is a political initiative to improve the development, human occupation or industrialization of a specific area, the pavement manager may define the roads connecting such area with a higher political relevance. All roads can be set with the same political relevance number to omit such relevance.
The traffic data, the economic and political relevancies are components leading to a higher RGVI, while the pavement distresses and condition reduce the index value. Following the overall philosophy for an “out of the box” approach, the RGVI equation can be freely customized to better match the needs and available survey data, and/or to have the weight of the importance for every variable changed by adjusting the constant values shown in Equation 1 and/or including different components suitable for specific needs, e.g., deflection data, to contemplate the structural condition.
RGVI: Road Global Value Index Rutting: Rutting depth (mm)
Cars: Number of daily cars IRI: International Roughness Index (m/km) Trucks: Number of daily trucks ER: Economic relevance
3.
Performance Models
To predict how the road pavement condition will be changed by choosing different maintenance or rehabilitation actions, on different time frames, the pavement management relies on performance models. A large number of models were published in the last decades; usually they are described as mathematic equations and often contain different variables like materials characteristics, volume of traffic and climate conditions.
The models used in this study are described as a factor to reduce the pavement distresses existing in year zero (cracks, rutting and IRI). The distress condition in the chosen time frame (one, five or ten years) is calculated by multiplying the distress value in the year zero by the model adjustment factor as shown in Equation 2 for the cracks:
CracksN= Cracks0∙ CrackAFN (2)
where:
CracksN: Cracks in year N Cracks0: Cracks in year zero
CrackAFN: Crack adjustment factor for year N
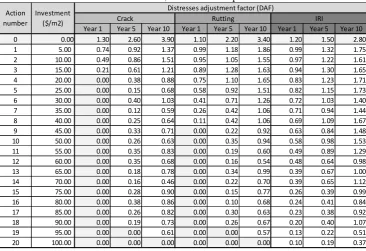
Similar equations can be constructed for rutting and IRI. Discussing the performance models in details is beyond the objectives of this study. To keep it simple, the maintenance actions are identified just by a number between zero and 20. Examples of maintenance actions comprise crack sealing, microsurfacing and asphalt concrete overlay. Each maintenance action has its own investment cost per square meter in both material and labor as well. The actions, investment per square meter and performance models considered for the demonstration of this study are shown in Table 1.
The action “zero”, shown in Table 1, corresponds to “do nothing” leading to worst pavement indicators (cracks, rutting and IRI) for all subsequent years (one, five and ten) as represented by the distresses adjustment factors above “one”. The action level 20 represents a heavy maintenance leading to an “as new” pavement condition in the following years. The pavement condition improves according to the level of investment, but not in a linear and constant rate and, for some maintenance techniques, a lower investment may lead to a better pavement for one or two indicators.
Table 1Maintenance actions, investment and performance models
Year 1 Year 5 Year 10 Year 1 Year 5 Year 10 Year 1 Year 5 Year 10
0 0.00 1.30 2.60 3.90 1.10 2.20 3.40 1.20 1.50 2.80
1 5.00 0.74 0.92 1.37 0.99 1.18 1.86 0.99 1.32 1.75 2 10.00 0.49 0.86 1.51 0.95 1.05 1.55 0.97 1.22 1.61 3 15.00 0.21 0.61 1.21 0.89 1.28 1.63 0.94 1.30 1.65 4 20.00 0.00 0.38 0.88 0.75 1.10 1.65 0.83 1.23 1.71 5 25.00 0.00 0.15 0.68 0.58 0.92 1.51 0.82 1.15 1.73 6 30.00 0.00 0.40 1.03 0.41 0.71 1.26 0.72 1.03 1.40 7 35.00 0.00 0.12 0.59 0.26 0.42 1.06 0.71 0.94 1.44 8 40.00 0.00 0.25 0.64 0.11 0.42 1.06 0.69 1.09 1.67 9 45.00 0.00 0.33 0.71 0.00 0.22 0.92 0.63 0.84 1.48 10 50.00 0.00 0.26 0.63 0.00 0.35 0.94 0.58 0.98 1.53 11 55.00 0.00 0.35 0.83 0.00 0.19 0.60 0.49 0.89 1.29 12 60.00 0.00 0.35 0.68 0.00 0.16 0.54 0.48 0.64 0.98 13 65.00 0.00 0.18 0.78 0.00 0.34 0.99 0.39 0.67 1.00 14 70.00 0.00 0.16 0.46 0.00 0.22 0.70 0.39 0.65 1.12 15 75.00 0.00 0.28 0.90 0.00 0.15 0.77 0.26 0.39 0.99 16 80.00 0.00 0.38 0.86 0.00 0.10 0.68 0.24 0.41 0.84 17 85.00 0.00 0.26 0.82 0.00 0.30 0.63 0.23 0.38 0.92 18 90.00 0.00 0.19 0.73 0.00 0.26 0.67 0.20 0.40 1.07 19 95.00 0.00 0.00 0.61 0.00 0.00 0.57 0.13 0.22 0.51 20 100.00 0.00 0.00 0.00 0.00 0.00 0.00 0.10 0.19 0.37
Distresses adjustment factor (DAF)
Crack Rutting IRI
Action number
4.
Optimization of budget allocation using Genetic Algorithms
The overall optimization goal for this approach is to identify the combination of maintenance strategies for the roads in consideration (roads A and B) that will lead to the highest sum of the Road Global Value Index (RGVI) for all the years in consideration (one, five and ten), weighted according the pavement surface area for every road (weighted Road Global Value Index, wRGVI), as shown in Equation 3. Other optimization goals may be used as, for example, (a) the highest RGVI sum for the year one, (b) the highest wRGVI sum for the year one, (c) the highest wRGVI for the year five or (d) the highest RGVI average.
wRGVI =(∑1;5;10Year=1RGVIRoad A)∙AREARoad A+(∑1;5;10Year=1RGVIRoad B)∙AREARoad B
AREARoad A+AREARoad B
(3)
where:
wRGVI: weighted Road Global Value Index RGVI: Road Global Value Index
AREA: Paved road surface (square meters)
The simulations were done with the GA software set with a mutation rate of 0.1, a crossover rate of 0.5 and 20000 trials without improvement as stop criteria. For an easier understanding all the simulations were done for a road network with just two roads, named A and B, with a paved area of 200000 m2 and 300000 m2, respectively, but the used software routines are suitable for a road network of any size.
Table 2 and Table 3 show the optimization results for investment of zero (do nothing), while Table 4 and Table 5 show a budget equal to $25 million. The number for traffic, economic and political relevance for all the considered years (one, five and ten) and all optimized budget scenarios is the same as shown in such tables.
Table 2 Optimization for investment equal to zero – Road A
Year 1 Year 5 Year 10
Cracks % 20,0 0 26,0 52,0 78,0
Rutting mm 11,0 0 12,1 24,2 37,4
IRI m/km 4,8 0 5,8 7,2 13,4
Cars 10.000 10.300 11.941 16.047
Trucks 3.000 3.090 3.582 4.814
Economic relevance N/A 5,00 5,00 4,00 3,00
Political relevance N/A 5,00 7,00 6,00 5,00
Road Global Value Index 22,1 22,3 11,2 3,2
Parameter
T
ra
ff
ic
P
a
vem
en
t
Unit
0,00 Road A
Forecast
Year 0 Action Investment
($/m2)
Table 3 Optimization for investment equal to zero – Road B
Year 1 Year 5 Year 10
Cracks % 8,0 0 10,4 20,8 31,2
Rutting mm 5,0 0 5,5 11,0 17,0
IRI m/km 3,6 0 4,3 5,4 10,1
Cars 30.000 31.350 36.343 48.842
Trucks 5.000 5.225 6.057 8.140
Economic relevance N/A 7,00 7,00 8,00 9,00
Political relevance N/A 8,00 8,00 9,00 10,00
Road Global Value Index 63,7 65,0 70,2 87,2
Parameter
T
ra
ff
ic
P
a
vem
en
t
Unit
0,00 Road B
Year 0 Action Investment
($/m2)
Table 4 Optimization for budget equal to $ 25 millions – Road A
Year 1 Year 5 Year 10
Cracks % 20,0 14 0,0 3,2 9,2
Rutting mm 11,0 14 0,0 2,4 7,7
IRI m/km 4,8 14 1,9 3,1 5,4
Cars 10.000 10.300 11.941 16.047 Trucks 3.000 3.090 3.582 4.814 Economic relevance N/A 5,00 5,00 4,00 3,00 Political relevance N/A 5,00 7,00 6,00 5,00
Road Global Value Index 22,1 36,8 36,3 39,3
Parameter Tr af fi c Pa vem en t Unit 70,00 Road A Forecast Year 0 Action Investment
($/m2)
Table 5 Optimization for budget equal to $ 25 millions – Road B
Year 1 Year 5 Year 10
Cracks % 8,0 7 0,0 1,0 4,7
Rutting mm 5,0 7 1,3 2,1 5,3
IRI m/km 3,6 7 2,6 3,4 5,2
Cars 30.000 31.350 36.343 48.842
Trucks 5.000 5.225 6.057 8.140
Economic relevance N/A 7,00 7,00 8,00 9,00
Political relevance N/A 8,00 8,00 9,00 10,00
Road Global Value Index 63,7 70,5 80,6 102,1
Parameter Tr af fi c Pa vem en t Unit 35,00 Road B
Year 0 Action Investment
($/m2)
Forecast
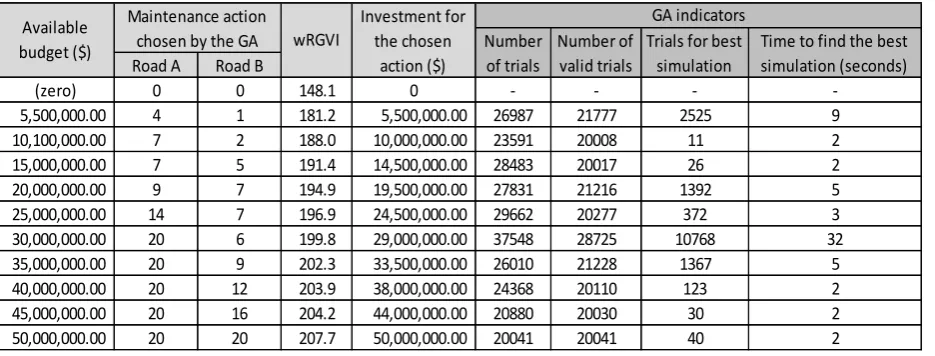
Table 6 Maintenance actions optimized by genetic algorithms for different budgets
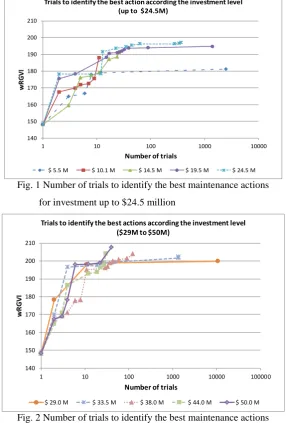
Table 6 shows the maintenance action chosen by the genetic algorithms for the considered road network for different levels of budget, from zero to $50 million, and some technical indicators of the GA performance. In a number of cases the proposed activities by the GA leads to an investment lower than the available budget; this occurs because the performance models (Table 1) are not linear and a lower investment may lead to a higher RGVI. The “number of trials” represents the total trials done by the GA while optimizing, according to the chosen stop criteria, and the “number of valid trials” represents the trials that met the required constrain, i.e., respect the available budget. The required time to find the best simulation leading to the highest wRGVI was relatively short, only a few seconds in most of the cases. The total required time to process all the trials was around 90 seconds for most of the investment levels; the computer used on the simulations was a laptop with an i7 Intel four cores processor running at the speed of 3.1 GHz. Fig. 1 and Fig. 2 show the GA trials progress, represented as the number of interactions, with the respective optimized wRGVI for every level of simulated investment, where is possible to see and compare the optimization performance among the various GA runs. Fig. 3 shows the improvements on the wRGVI according
Road A Road B
(zero) 0 0 148.1 0 - - -
-5,500,000.00
4 1 181.2 5,500,000.00 26987 21777 2525 9
10,100,000.00
7 2 188.0 10,000,000.00 23591 20008 11 2
15,000,000.00
7 5 191.4 14,500,000.00 28483 20017 26 2
20,000,000.00
9 7 194.9 19,500,000.00 27831 21216 1392 5
25,000,000.00
14 7 196.9 24,500,000.00 29662 20277 372 3
30,000,000.00
20 6 199.8 29,000,000.00 37548 28725 10768 32
35,000,000.00
20 9 202.3 33,500,000.00 26010 21228 1367 5
40,000,000.00
20 12 203.9 38,000,000.00 24368 20110 123 2
45,000,000.00
20 16 204.2 44,000,000.00 20880 20030 30 2
50,000,000.00
20 20 207.7 50,000,000.00 20041 20041 40 2
Available
budget ($) Trials for best
simulation
Time to find the best simulation (seconds) GA indicators
Maintenance action
chosen by the GA wRGVI
to the level of investment for the simulated road network; it helps the pavement manager to make a better decision on the ideal investment level, and eventually discuss the subject with politicians, because, among the diversity of available maintenance techniques, some minor improvement on the investment may leads to an important increase on the wRGVI, while, on other cases, a larger investment may result in an insignificant wRGVI improvement.
Fig. 1 Number of trials to identify the best maintenance actions for investment up to $24.5 million
Fig. 2 Number of trials to identify the best maintenance actions for investment between $29 million and $50 million
Fig. 3 The wRGVI indicator according the level of investment 140
150 160 170 180 190 200 210
1 10 100 1000 10000
w
R
G
V
I
Number of trials
Trials to identify the best action according the investment level (up to $24.5M)
$ 5.5 M $ 10.1 M $ 14.5 M $ 19.5 M $ 24.5 M
140 150 160 170 180 190 200 210
1 10 100 1000 10000 100000
w
R
G
V
I
Number of trials
Trials to identify the best actions according the investment level ($29M to $50M)
$ 29.0 M $ 33.5 M $ 38.0 M $ 44.0 M $ 50.0 M
140.0 150.0 160.0 170.0 180.0 190.0 200.0 210.0
0.00 10,000,000.00 20,000,000.00 30,000,000.00 40,000,000.00 50,000,000.00
w
R
G
V
I
Investment ($)
5.
Conclusions
This study shows a practical application where genetic algorithms (GA) were used with success to choose the best pavement maintenance actions for a road network for different levels of investment and budget. The approach is out of the box and is an alternative to current software used for pavement management and may be a preferred choice for many pavement managers.
The approach is flexible and easy to customize, allowing the pavement manager to manually select the actions for some road sections before the GA optimization is run.
The GA working performance is efficient in regular computers and the best solutions are found in a relatively low number of trials.
A new parameter called Road Global Value Index (RGVI) is introduced to provide a holistic indicator for the road importance including the pavement condition, traffic, and economic and political relevance; it can be changed as required to fit specific needs. The RGVI was successfully used as the overall indicator to guide the allocation of the available budget and the identification of the best combination of maintenance actions.
The proposed approach, as any existing software for pavement management, requires to be fed with suitable performance models. Also, because it is out of the box, it will require skilled operators, ideally with some experience on artificial intelligence and pavement management.
References
[1] T. F. Fwa, W. T. Chan, and K. Z. Hoque, "Network level programming for pavement management using genetic algorithms," Proc. 4th International Conference on Managing Pavements, pp. 815-829, May 1998.
[2] K. J. Feighan, M. Y. Shahin, and K. C. Sinha, "A dynamic approach to optimization for pavement management systems," Proc. Second North American Conference on Managing Pavements, vol. 2, pp. 195-206, 1987.
[3] T. Fwa, K. C. Sinha, and J. Riverson, "Highway routine maintenance programming at network level," Journal of Transportation Engineering, vol. 114, no. 5, pp. 539–554, September 1988.
[4] W. D. Paterson and P. E. Fossberg, "Achieving efficiency in planning and programming through network-level policy optimization and pavement management," Proc. Second North American Conference on Managing Pavements, pp. 2.183-2.94, 1987.
[5] R. Salini, "INTELLIPave - Uma AbordagemBaseadaemInteligência Artificial para a Modelagem de Pavimentos Asfálticos," Ph.D. thesis, Department of Computer Science, Univ. of Minho, Braga, 2010.
[6] R. Salini, J. Neves, and A. Abelha, "Intellipave - considering aside failure criteria and unknown variables in evolutionary intelligence based models for asphalt pavement," Proc. 23rd European Conference on Modellingand Simulation, pp. 624-629, June 2009.
[7] J. H. Holland, "Adaptation in Natural and Artificial Systems,"Ann Arbor, Michigan: University of Michigan Press, 1975. [8] D. E. Goldberg, "Genetic Algorithms in Search, Optimization and Machine Learning,"Addison-Wesley Longman
Publishing Co., Inc. Boston, MA, USA, 1989.
[9] K. Z. Hoque, C. W. Tat, and F. T. Fang, "Multi-objective programming for pavement management using genetic algorithms," Journal of the Eastern Asia Society for Transportation Studies, vol. 3, no. 3, pp. 117-132, September 1999. [10] R. L. Roper, "Using genetic algorithms to select optimum pavement treatment intervention strategies," Proc. 6th
International Conference on Managing Pavements, 13 pages, October 2004.
[11] J. Roberts, R. Roper, and A. Loizos, "PLATO: A new engine for the implementation of HDM technology for road infrastructure management analysis," Proc. 21st ARRB Transport Research Conference and 11th Road Engineering Association of Asia and Australasia (REAAA) Conference, 23 pages, 2003.
[12] A. Golroo and S. L. Tighe, "Optimum genetic algorithm structure selection in pavement management," Asian Journal of Applied Sciences, vol. 5, no. 6, pp. 327-341, 2012.
[14] A. A. Elhadidy, E. E. Elbeltagi, and M. A. Ammar, "Optimum analysis of pavement maintenance using multi-objective genetic algorithms," Housing and Building National Research Center Journal, vol. 11, no. 1, pp. 107-113, April 2015. [15] C. Torres-Machí, A. Chamorro, C. Videla, E. Pellicer and V. Yepes, "An iterative approach for the optimization of
pavement maintenance management at the network level," The Scientific World Journal, vol. 2014, 11 pages, 2014. [16] N. R. Tayebi, F. Moghadasnejhad and A. Hassani, "Analysis of pavement management activities programming by
particle swarm optimization," ACEEE International Journal on Communication, vol. 2, no.1, pp. 22-27, March 2011. [17] ASTM, "Standard Practice for Roads and Parking Lots Pavement Condition Index Surveys,"