Tribology in Industry
www.tribology.rsSurface Roughness Analysis in High Speed Turning of
Ti-6Al-4V Using Coated Carbide Inserts:
Experimental and Modeling Studies
G. D’Mello
a, P. Srinivasa Pai
b, A. Prashanth
ca, b NMAM Institute of Technology, Nitte - 574110, Karkala Taluk, Udupi District, Karnataka, India, c St. Joseph’s Engineering College, Vamanjoor - 575028, Karnataka, India.
Keywords:
Ti-6AL-4V
Surface Roughness RSM
RFR HSM
A B S T R A C T
Machining and achieving good surface finish in Ti-6Al-4V is a challenging task. Several factors influence surface finish of which some can be controlled and are mainly the machining parameters and some are considered uncontrolled and happens to be the output of the machining process like tool wear and cutting tool vibrations. Several researchers have made attempts to identify these parameters and study both experimentally and through modeling. This study deals with the experimental correlation between machining parameters namely cutting speed, feed rate, depth of cut and uncontrollable parameters namely tool flank wear and cutting tool vibrations on two surface roughness parameters Ra and Rt, while turning Ti-6Al-4V using coated carbide
inserts. Further, in order to study the effect of individual parameters statistically on the responses, a widely used statistical technique namely Response Surface Methodology (RSM) and a new technique, Random Forest Regression (RFR) have been applied to these experimental data to model and predict the values of surface roughness parameters. Results revealed that RFR performed better than RSM. It has been found that tool wear is the most dominant parameter affecting surface roughness parameters followed by feed rate and cutting tool vibrations have a direct correlation with surface roughness parameters.
© 2018 Published by Faculty of Engineering
Corresponding author:
Grynal D’Mello
NMAM Institute of Technology, Nitte - 574110, Karkala Taluk, Udupi District, Karnataka, India. E-mail: [email protected]
1. INTRODUCTION
The principal use of Titanium alloys is in the field of aerospace applications for engines as well as in fuselage structures, because of its high strength to weight ratio and its resistance to withstand high temperatures. Titanium and its alloys are considered to be difficult to machine materials because of its low thermal
conductivity and high chemical reactivity. They are comparatively stronger than steel [1-3]. Komanduri has commented that ”the machining of titanium alloys is a classic case of distinct gross inhomogeneous plastic deformation involving periodic upsetting and intense shear localization in a narrow band” [4]. Due to the increase in temperature during machining of titanium alloys, life of the tool decreases
R
ES
EA
R
resulting in poor surface finish with thermal expansion of workpiece material as well as tool [5]. High Speed machining (HSM) is getting special attention in the recent years as it can achieve higher material removal rate, low manufacturing costs and better part quality [6].
Surface roughness measures the fine irregularities on the surface of any material. It defines the quality of a product in achieving better performance, thereby reducing friction and other factors [7]. Major sources of concern during machining of titanium alloys are poor surface finish, tool wear and waviness due to the vibrations generated during machining [8]. Several researchers have attempted to study the surface roughness of titanium alloys in machining. Hughes et al. studied the effect of edge geometry and cutting tool material in the evaluation of surface roughness and tool life. Their study revealed that tool geometry and machining parameters showed remarkable variation in surface quality [9]. Sun and Guo examined the quality of surface finish of Ti-6Al-4V.S urface roughness increased with increase in feed rate and radial depth of cut [10]. Rahim and Sharif investigated tool life and surface integrity during drilling Ti-6Al-4V and Ti-5Al-4V-Mo/Fe [11]. The quality of surface during machining of titanium alloys are affected by various machining parameters such as cutting speed, feed rate, depth of cut [12], tool coatings [13], cutting forces and tool vibrations [6]and usage of coolants [14]. Ginting and Nouari dry machined titanium alloys to understand the surface quality. Coated and uncoated carbide tools were used. It was concluded that machining with uncoated carbide tool produced better surface roughness than the coated. Surface roughness variation was linked with the cutting speed and feed rate [13]. Zoya and Krishnamurthy performed experiments using Cubic Boron Nitride (CBN) tools during the machining of titanium alloys. The evaluation was done using cutting force, specific cutting pressure, cutting temperature, chip strain and surface finish [15]. Jawaid et al. evaluated wear mechanisms of coated tools during machining titanium alloys. CVD and PVD coated tools were used and CVD performed better, when compared to PVD tools [16]. Sun et al. studied the effect of tool wear on cutting forces during dry machining of Ti-6Al-4V. Turning was conducted using coated carbide insert at high cutting
speeds. Tool wear exceeded the criteria at high speeds which resulted in increase of cutting forces in all the three components towards the end of tool life [17].
Ribeiro et al. applied optimization in machining titanium alloy. In order to achieve satisfactory tool life, the ranges of cutting speed and feed rates were limited. Tool life also depends on coating, geometry and chip flow of the material [18]. Thepsonthi and Ozel investigated experimental and finite element simulation during micro milling Ti-6Al-4V in the evaluation of Cubic Boron Nitride (cBN) coating on tool wear. The study revealed that cBN performed better when compared to uncoated carbide insert [19]. D’Mello et al. carried out the experimental analysis in correlating cutting tool vibrations with surface roughness parameters. The high speed turning experiments were carried out on Ti-6Al-4V using uncoated carbide inserts. They concluded that cutting tool vibration has a direct correlation with the surface roughness parameters [20]. In a related work by Pai and DMello, during HSM of Ti-6Al-4V, cutting tool vibrations were found to be sensitive to the variation of tool wear [21]. Ezugwu et al. compared the conventional and high pressure coolant supply during HSM of Ti-6Al-4V. Their study concluded that increase in coolant pressure can reduce the hardening effect on the machined surfaces [22]. Su et al. performed high speed milling of grade 5 titanium alloy during an experimental investigation of the effect of coolant on tool wear. The results revealed that flood coolant is not suitable for high speed machining [23].
conclusions were presented by Che Haron et al. during the wear performance studies of coated and uncoated carbide tools [26]. Fang et al. studied the effect of dynamic tool edge wear on cutting tool vibrations during HSM of Ti-6Al-4V using wavelet packet transform. The wavelet packets investigated can be used to monitor tool edge wear in HSM [27].
In order to find out the relationship between machining parameters and dependent variables, modelling and prediction methods have been used by various researchers. The most widely used statistical technique found in literature is Response Surface Methodology (RSM) which develops a polynomial model and predicts the quantity of interest. Kosaraju and Anne developed a surface roughness model to minimize surface roughness (Ra) and tangential
force (Fz) in turning Ti-6Al-4V using coated
carbide inserts. It was concluded that Ra
increased with increase in cutting feed and Fzdecreased with increase in cutting speed
and back rake angle [28]. Hashmi et al. used RSM to optimize process parameters during HSM of Ti-6Al-4V. The experiments were performed using coated carbide inserts. The predicted model reflected that depth of cut was the most significant parameter affecting surface roughness whereas cutting speed and feed rate showed negligible effect [29]. Increase in cutting speed and feed rate showed an increasing trend of surface roughness as observed by Ramesh et al. during machining Ti-6Al-4V using coated carbide inserts [30]. Upadhyaya et al. considered cutting tool vibration signals during the modelling of surface roughness. First and second order models were developed and they found that second order models can generate results with higher accuracy [31]. Nikos C. Tsourveloudis have also proved that two factor interactions (2FI) are successful in surface roughness prediction of Ti-6Al-4V [32]. D’Mello et al. applied Multi Layered Perceptron Neural Network (MLPNN) for the prediction of surface roughness in high speed turning of Ti-6Al-4V using uncoated carbide inserts. Two surface roughness parameters Raand Rtwere evaluated
by developing individual MLPNN models. Results revealed that Ra model was found to be better than Rt [33]. D’Mello and Pai carried out a comparison between statistical and artificial intelligence based techniques namely RSM, Artificial Neural Network (ANN) and Adaptive
Neuro Fuzzy Inference System (ANFIS) for modeling surface roughness parameter Ra
during turning of mild steel. Cutting speed, feed rate and tool wear were considered as the independent variables. ANFIS was found effective in predicting surface roughness when compared to ANN and RSM [34].
Random Forests are multipurpose group of decision trees that can be implemented for linear and nonlinear prediction resulting in stability between bias and variance [35]. This study makes use of Random Forest regression (RFR) which has the ability to achieve higher accuracy in prediction. Agrawal et al. compared three techniques namely multiple regression, random forest and quantile regression for the prediction of surface roughness while turning of AISI 4340 steel. From the analysis, it was concluded that random forest was found to be more accurate than other two techniques. They made the first attempt in using random forest regression in the machining studies [36]. Oliveira et al. applied multiple regression and random forest for pattern modelling of fire occurrence. Random forest showed higher ability to predict than multiple regression [37]. Kovdienko et al. applied RFR and multiple linear regression (MLR) to check the QSPR prediction of aqueous solubility of military compounds. RFR produced better results when compared to MLR [38]. Hultquist et al. compared Gaussian process regression (GPR), random forest (RFR) and support vector machine (SVM) in the diseased forests for burn severity assessment. RFR outperformed the other two techniques [39]. Pang et al. used RFR classification and regression for pathway analysis. The study showed that RFR produced lowest errors rates, when compared to other machine learning methods [40]. Smith et al. carried out a comparison of random forest and regression for prediction in the field of neuroscience. Regression produced better results in terms of less error and high prediction than random forests [41]. Pimenov et al. compared random forest, standard multilayer perceptrons, regression trees and radial basis functions during the prediction of surface roughness during face milling of steel. Random forest displayed higher accuracy than MLP and RBF [42].
roughness in HSM of Ti-6Al- 4V alloy, particularly considering parameters like tool flank wear and cutting tool vibrations. Cutting tool vibrations are a major problem during machining of Ti-6Al-4V alloys and have a significant influence on surface roughness. There have been very few experimental efforts in evaluating the influence of cutting tool vibrations on surface roughness during HSM of Ti-6Al-4V alloys. A similar effort has been made by the authors to study the influence of cutting tool vibrations on surface roughness in HSM of Ti-6Al-4V using uncoated carbide inserts [20]. This study is a continuation of the previous effort and makes use of machining parameters along with tool flank wear and cutting tool vibrations in the experimental evaluation and its correlation with surface roughness parameters
Ra and Rt in turning Ti-6Al-4V using coated
carbide inserts. Ra (Arithmetic average surface
roughness) is a widely used surface roughness parameter in all the machining studies found in the literature [22,28,31]. Hence it has been considered in this work. Rt (Maximum peak to
valley height) has been considered because in a previous similar study made by the authors regarding the influence of machining parameters on surface roughness during turning Ti-6Al-4V using uncoated carbide inserts, it has been found that there is a significant correlation between Rt
and cutting tool vibrations, especially in the cutting speed direction [20]. Hence to understand the influence of vibrations on surface roughness, it has been included in this study. Some studies suggest that dry machining provides better surface finish with use of a coated carbide insert than in wet machining, which also reduces the cost of machining [43]. Hence this study makes use of dry machining during high speed turning of Ti-6Al-4V. Further use of dry machining helps in proper understanding the phenomenon that govern the behaviour of the tool and workpiece.
2. EXPERIMENTAL DETAILS
Design of experiments has been used in order to plan and perform the experiments. Three level full factorial design has been developed by considering cutting speed (v), feed rate (f) and depth of cut (d). The levels were selected based on the literature with v set to 150, 175 and 200 m min-1, f set to 0.15, 0.2 and 0.25 mm rev-1 and
d set to 0.8, 1 and 1.2 mm. The material used in this study is a round bar of Ti-6Al-4V having 50mm diameter and 200 mm length with the chemical composition as shown in Table 1.
Table 1. Chemical Composition of Ti-6Al-4V bar.
Elements Al Cr Fe Mn V Ti
Composition
(%) 6.02 0.03 0.13 0.04 3.85 89.93
Removable coated carbide cutting inserts (TS2500 having chip breaker MR4) supplied by SECO tools having four working edges have been used in this study. These tools are commercially available with ISO description CNMG 120408 which is fixed to the tool holder PCLNL 2020 K12 manufactured by SECO tools. Turning experiments were carried out on a HMT Stallion 100 SU CNC lathe with 5.5 kW spindle power under dry conditions. Length of each machining pass is set to 48 mm and three passes are machined using one bar.
2.1Tool Wear Measurement
The maximum flank wear (VBmax) is measured
offline after each machining pass by removing the insert from the tool holder and using the Mitutoyo Tool Makers’ Microscope, which has a total magnification of 30X. A maximum flank wear of 0.4 mm has been considered [44] as the limiting value of tool wear and experiments were performed on each insert edge till it reached the limiting value. Depending upon the cutting conditions, sometimes it was less than or more than this value. Three level full factorial experiments for cutting speed, feed rate and depth of cut results in 27 experiments (3 x 3 x 3 =27). Tool wear reached during each experiment decides the number of data sets. This in turn depends on the cutting speed, feed rate and depth of cut used in each experiment. Also each experiment takes different number of passes to reach the limiting value of tool wear (Flank wear, VBmax) of 0.4 mm. Hence a total of 461 data
sets have been generated.
2.2Vibration Measurement
An ISOTRON triaxial accelerometer was mounted on the tool holder to measure the vibration signals online in three directions; speed (Vy), feed (Vz) and depth of cut (Vx). The
kHz using a DNA cube controlled using a laptop. The vibration signals were captured for 10 seconds, thereby collecting 1,00,000 samples and processed using LAB VIEW software.
2.3Surface Roughness Measurement
The measurement of surface roughness parameters Ra and Rt were measured off-line
after each machining pass using Taylor Hobson Taly Surf 50 with a run-up length of 0.3 mm and sampling length of 2.5 mm at a measurement speed of 0.5 mm/s. The measurement was done at three different locations on the surface of the workpiece 1200 apart and the average value is considered as the final surface roughness value. Figure 1 shows the Taylor Hobson Taly Surf 50 used to measure surface roughness in this study.
Fig. 1. Taylor Hobson Form Taly Surf 50.
3. SURFACE ROUGHNESS ANALYSIS AND
OBSERVATIONS
This section deals with experimental correlation of machining parameters with tool wear, vibrations and surface roughness. Further the effect of parameters namely tool flank wear and cutting tool vibrations on surface roughness have also been investigated. As an extension to the previous work done using uncoated carbide inserts [20], the experimental conditions have been kept as 200 m min-1 cutting speed, 0.15 mm rev-1 feed rate
and 1.2 mm depth of cut, as the reference for presentation and discussion of results.
3.1 Flank Wear Development
The experiments have been conducted considering one edge of the insert till the maximum flank wear reached 0.4 mm and
beyond. Figure 2 shows the maximum flank wear at different cutting speeds by maintaining a constant feed rate and depth of cut of 0.15 mm rev-1 and 1.2 mm respectively. The pattern of
wear is almost similar for different cutting speeds. At higher cutting speed of 200 m min-1,
initially the wear has been constant for first three passes and rapid wear was observed after 3rd pass. After 4th pass, there has been a
continuous increase in wear which reached the limiting value of 0.445 mm at the end of 8th pass. At a lower speed of 150 m min-1, it took 10
passes for the tool wear to reach its limiting value whereas at 175 m min-1, 9 passes were
required to reach the limiting value. A sudden increase has been observed at the end of 8th pass
for 150 m min-1 and for 175 m min-1. Due to
regular wear, there will be loss of coating material and substrate is exposed which accelerates the wear rate of the tool inserts [45]. As the cutting speed increases, there is an increase in the wear rate of the insert. Tool wear can be caused by adhesion, diffusion, plastic deformation, cracks and coating delamination [52]. As stated by Bonifacio and Diniz in their study, increase in cutting speed increases diffusion wear mechanism due to high temperature [47].
Fig. 2. Flank wear at different cutting speeds.
Figure 3 shows the maximum flank wear for different feed rates by maintaining a constant speed and depth of cut of 200 m min-1 and 1.2
mm respectively. It can be seen that higher feed rates required more number of machining passes (9 passes) to reach the maximum flank wear, whereas for the lowest feed rate of 0.15 mm rev-1, the flank wear reached its limiting
fact that as the feed rate increases, there will be reduction in the contact time between tool and the workpiece which correspondingly decreases the tool wear [46]. For 0.15 mm rev-1, the wear
remained constant for the first three passes, thereafter a sudden increase at the end of 4th
pass and then a linear increase in flank wear have been observed. Thus the effect of feed rate on flank wear is not very clear and overall it can be stated that feed has no significant influence on tool life of coated carbide insert [47].
Fig. 3. Flank wear at different feed rates.
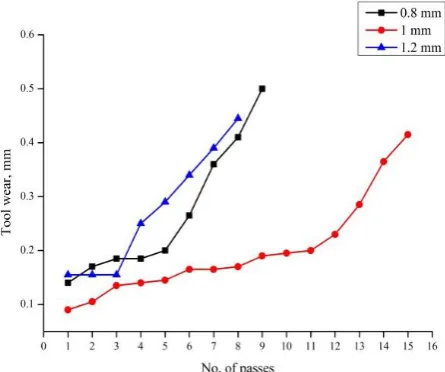
Figure 4shows the variation of flank wear with cutting time for different depths of cut by maintaining a constant speed and feed rate of 200 m min-1 and 0.15 mm rev-1 respectively.
For lower and higher depths of cut, the trend of tool wear is almost the same except that at highest depth of cut (1.2 mm), maximum wear took place by the end of 8th pass whereas for
lowest depth of cut (0.8 mm), it took 9 passes for the wear to reach its limiting value. But at the intermediate depth of cut (1 mm), it took 15 passes to reach the limiting value of tool wear showing the various stages of flank wear development like initial, normal and abnormal wear. The effect of depth of cut on the tool flank wear cannot be individually analyzed and varies with cutting speed and feed rate considered in the experiments. But as per the High-Temperature Machining guide by KENNAMETAL, it is preferred to have high feed rate and high depth of cut during machining super alloys which minimizes hardening and the depth of cut should be greater than the work hardened layer resulting from the previous cut [58].
Fig. 4. Flank wear at different depths of cut.
Figure 5 shows the SEM image of tool wear for a cutting speed of 200 m min-1, feed rate of 0.15
mm/rev, depth of cut of 0.8 mm after reaching the limiting value of tool wear. This cutting condition has been considered as it has resulted in maximum wear.
Fig. 5. SEM image for tool wear for v = 200 m min-1, f = 0.15 mm/rev, d = 0.8 mm.
The figure indicates the nose of the tool’s cutting edge and the maximum wear (VBmax = 0.435
4. VARIATION OF CUTTING TOOL VIBRATIONS
4.1Variation of Vx, Vy and Vz with cutting speed
Figure 6 shows the variation of cutting tool vibrations Vx, Vy and Vz with number of passes
for different cutting speeds by maintaining a constant feed rate and depth of cut of 0.15 mm rev-1 and 1.2 mm respectively.
(a)
(b)
(c)
Fig. 6. Variation of (a) Vx, (b) Vy and (c) Vz with number of passes at different cutting speeds.
The lowest vibrations were generated in depth of cut direction (Vx). Also it is lowest at a speed
of 150 m min-1. Similar trend has been observed
in case of feed direction (Vz) where lowest
vibration is generated at lowest cutting speed. The cutting tool vibrations have been more significant along the cutting speed direction (Vy).
The vibrations generated at 150 and 175 m min -1 are exhibiting a similar trend but lower
vibrations have been generated at an intermediate speed of 175 m min-1. This is due to
the rise in temperature with increase in cutting speed. These higher temperatures decrease the material properties thereby producing thermal softening, thus decreasing the cutting forces. When the cutting speed is increased beyond 175 m min-1, there is an increase in the vibration
values in all the directions due to increase in tool wear, which results in increase of cutting edge radius producing greater cutting forces [57]. Chatter has been observed during machining which resulted in increased vibrations and has been found to be more at higher cutting speeds which can be clearly identified in Fig. 6b. Similar observations were presented by Amin et al. during end milling of Ti-6Al-4V [51].
4.2Variation of Vx, Vy and Vz with feed rate
Figure 7 shows the variation of cutting tool vibrations Vx, Vyand Vzin depth of cut, speed and
feed directions with number of passes for different feed rates by maintaining a constant speed and depth of cut of 200 m min-1 and 1.2
mm respectively. The vibrations were lower for lower feed rates in case of Vxand Vzwhereas for Vy, for low feed rate of 0.15 mm rev-1, the
vibration amplitude was the highest. Vibrations along cutting speed direction Vy is significant
when compared to other two directions for different feed rates. There is no regular behavior with regard to behavior of cutting tool vibrations with increase in number of passes. For all the feed rates investigated, at the end of tool life there has been a reduction in vibration amplitude in case of Vyand Vzwhereas for Vx, for
(a)
(b)
Fig. 7. Variation of (a) Vx, (b) Vy and (c) Vz with number of passes at different feed rates.
4.3Variation of Vx, Vy and Vz with depth of cut
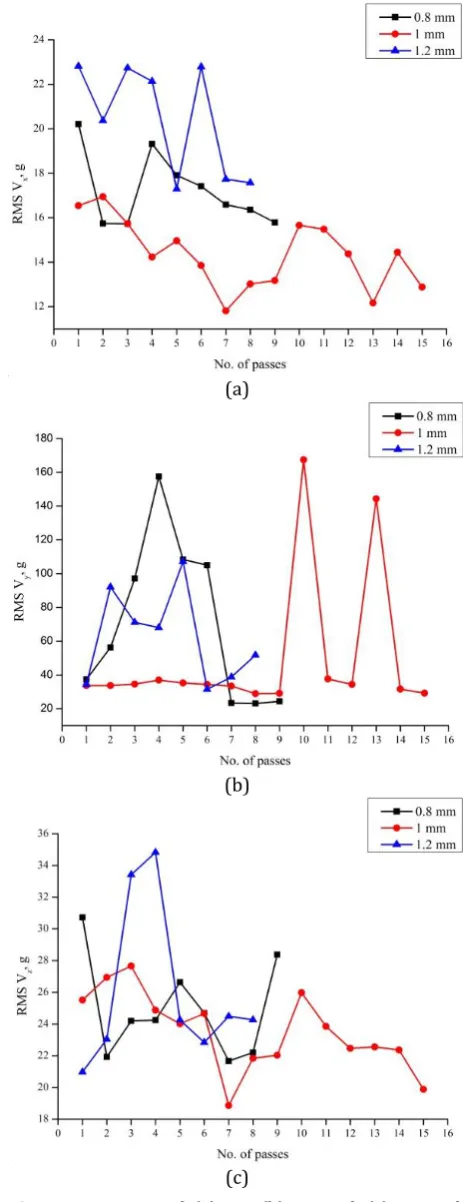
Figure 8 shows the variation of cutting tool vibrations Vx, Vy and Vz with number of passes
for different depths of cut by maintaining a constant speed and feed rate of 200 m min-1 and
0.15 mm rev-1 respectively.
(a)
(b)
(c)
Fig. 8. Variation of (a) Vx, (b) Vy and (c) Vz with number of passes at different depths of cut.
directions for all the depths of cut investigated. Also the values of vibration amplitude are maximum compared to all the previous results presented and discussed. As the depth of cut increases, the resistance force at the tool tip increases which causes more vibrations [58]. All the vibration parameters decrease at the end of tool life for all the depths of cut investigated.
5. SURFACE ROUGHNESS PARAMETER
VARIATION
5.1 Variation of Ra and Rt with cutting speed
Figure 9shows the variation of Ra and Rt with
number of passes at different cutting speeds by maintaining a constant feed rate and depth of cut of 0.15 mm rev-1 and 1.2 mm respectively.
Ra and Rt show a similar variation with the
number of passes.
(a)
(b)
Fig. 9. Variation of (a) Ra and (b) Rt with number of passes at different cutting speeds.
The lowest surface roughness (Ra= 0.43073 µm
and Rt = 2.6006 µm) was generated during
machining at the intermediate cutting speed of 175 m min-1. It can be seen from Fig. 1 that at
200 m min-1, there is no progression of tool wear
for first three passes, but there is variation in surface roughness which has been observed in Fig. 9. There is no direct correlation between tool wear and surface roughness which has been stated by Arrazola et al. in [54]. As the tool wear progressed, surface roughness went on increasing till the 5th pass, beyond which it
decreased as shown in Fig. 7a. The tool tends to lose its coating and substrate of the material performs the cut thereby losing the radius of the edge which produces smooth surface [47]. The variations of cutting tool vibrations in Vy
direction (Fig. 5b) show a similar trend as that of surface roughness parameters. Rtshowed more
similar behaviour as Vythan Ra.
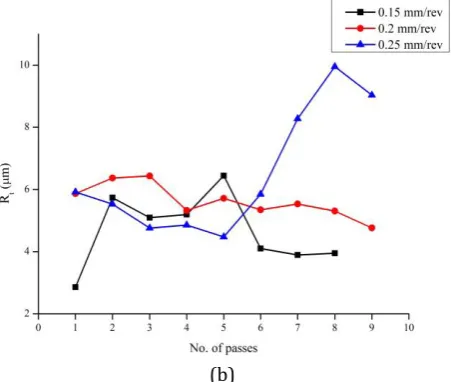
5.2 Variation of Ra and Rt with feed rate
Figure 10 shows the variation of Ra and Rtwith
number of passes at different feed rates by maintaining a constant speed and depth of cut of 200 m min-1 and 1.2 mm respectively. It can
be seen that the lowest surface roughness is produced at the lowest feed rate of 0.15 mm rev-1 and tend to increase with increase in feed
rate. The variation observed in Ra and Rt are
similar. The surface roughness parameters Ra
and Rt showed a decreasing trend for 0.15 and
0.2 mm rev-1 with increase in tool wear. The
surface roughness improved at the end of tool life due to large deterioration and deformation of the flank surface [55].
(b)
Fig. 10. Variation of (a) Ra and (b) Rt with number of passes at different feed rates.
The cutting tool vibrations along feed direction (Vz) showed a direct correlation with surface
roughness parameters as observed from Fig. 5c and Fig. 10.
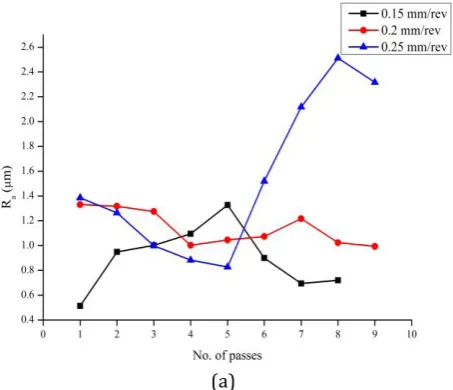
5.3 Variation of Ra and Rt with depth of cut
Figure 11 shows the variation of Ra and Rtwith
number of passes at different depths of cut by maintaining a constant cutting speed and feed rate of 200 m min-1 and 0.15 mm rev-1
respectively. It can be seen that the lowest surface roughness achieved during turning Ti-6Al-4V is at an intermediate depth of cut of 1 mm. The vibrations generated during machining have been found to be less at the intermediate depth of cut. The variation between the cutting tool vibration (Vy) (Fig. 8) and surface roughness
parameters (Fig. 11) has been observed to be similar. There is a sudden increase in surface roughness at the initial stage of tool wear at depths of cut of 0.8 mm and 1.2 mm. Then it gradually tends to decrease towards the end of tool life. The unusual variation of surface roughness observed might have been caused due to the chatter producing wavy surface. This caused chip thickness variation and forces generated, thereby producing vibrations between the tool and the workpiece as described by Pramanik in a review on machining of titanium alloys [8]. Similar behaviour has been observed for uncoated carbide inserts during high speed machining of Ti-6Al-4V by the authors [20]. No previous studies have been found regarding the influence of variation of
depth of cut on surface roughness parameters at different stages of tool wear during high speed turning of Ti-6Al-4V for coated carbide inserts.
(a)
(b)
Fig. 11. Variation of (a) Ra and (b) Rt with number of passes at different depths of cut.
The experimental results obtained with regard to tool flank wear, cutting tool vibrations and surface roughness have been used to study two statistical based modeling techniques namely RFR and RSM. The efforts are made mainly to validate some findings made through experimental investigations and also to compare the two models to find out which modeling technique can be effectively used to predict surface roughness.
6. RANDOM FOREST REGRESSION (RFR)
neighbour predictor which is used to improve the prediction performance [35]. The formation of RFR is done by growing trees on a random vector in such a way that the tree predictor takes on numerical values as opposed to class labels. The RF model has been developed based on the standard algorithm [35]. A common criterion has been found through the algorithm for the objects using some randomly selected descriptors. Each tree has been grown as follows:
Bootstrap sample which will be a training set for current tree is produced from the whole training set of N data. About one third of the data which are not included in the current training data set are placed separate. Those are used to get unbiased estimate, model error and variable importance.
The best split among the m randomly selected descriptors taken from the whole set of M ones in each node is chosen. The value of m is the only tuning parameter for which RF models are sensitive.
Each tree is grown to the largest possible extent. There is no pruning [38].
In this study, five predictors namely cutting speed, feed rate, depth of cut along with tool flank wear and cutting tool vibrations (Vy) have
been considered and responses are the surface roughness parameters Ra and Rt. Vy has been
found to be more significant than Vx and Vz in
this experimental study. Hence only Vyhas been
used as one of the predictor. RFR is implemented using data mining tool box in STATISTICA 12 [56]. The number of trees has been set to 100 after different trials with stopping criteria of 10 cycles, to calculate mean error and percentage error has been set to 5 %. The program by default divides the input data into test and train. In this study, out of 461 total data, 400 have been considered as train data and remaining 61 as test data.
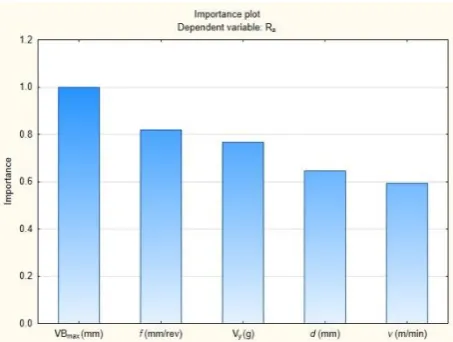
Figure 12 shows the bar graph of predictor importance which reveals the individual effect of independent parameters on Ra. The plots
generated were similar for both Raand Rt. It can
be seen that tool wear showed the highest effect on Raand Rtfollowed by feed rate, Vyand
depth of cut. But cutting speed has least effect on Raand Rt.
Fig. 12. Bar graph of predictor importance for Ra.
(a)
(b)
Fig. 13. Predicted vs observed values of Ra for (a)
training data and (b) test data.
Figure 13 shows the predicted vs observed values of Rafor training and test data. The R2 for
𝑀𝑆𝐸 =(𝑃𝑟𝑒𝑑𝑖𝑐𝑡𝑒𝑑 𝑉𝑎𝑙𝑢𝑒−𝑂𝑏𝑠𝑒𝑟𝑣𝑒𝑑 𝑉𝑎𝑙𝑢𝑒)2 2 (1)
A cut off value of 0.05 has been considered for the mean squared error, any value above 0.05 has been considered as a misclassification.
It has been found that for Ra, RFR produced
prediction accuracy of 95.75 % on training data and 90.16 % on test data.
(a)
(b)
Fig. 14. Predicted vs observed values of Rt for (a)
training data and (b) test data.
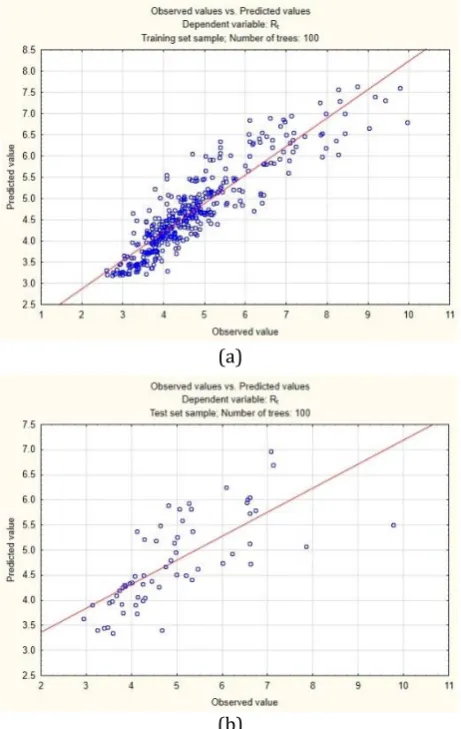
Figure 14 shows the predicted vs observed values of Rtfor training and test data. From the
plots of predicted values, the R2 for training data
has been found to be 81.78 % and 51.79 % for test data. The prediction accuracies have been found to be 55.25 % on training data and 34.42 % on test data. The values of surface roughness have been found to be more than 1 µm for Rt. As
per the study conducted by Agrawal et al., the prediction accuracy of these kinds of models decreases when the values of surface roughness goes beyond 1 µm [36].
7. RESPONSE SURFACE METHODOLOGY (RSM)
RSM is a blend of mathematical and statistical techniques which are used to model and analyze problems, where the response is influenced by several independent variables, which can be optimized to produce the best possible response value. RSM is applied by considering proper selection of parameters along with their ranges by defining proper experimental design. In this work, three level full factorial design has been used to evaluate the performance of the model. The significance of predictors on the response variable has been investigated using analysis of variance (ANOVA). This study makes use of first and second order model which has been represented in Eq. 2 and 3.
𝑌 = 𝑏0+ ∑𝑘𝑖=1𝑏𝑖𝑥𝑖
(2)
𝑌 = 𝛽
0+ 𝛽
1𝑥
1+ 𝛽
2𝑥
2+ 𝛽
3𝑥
3+ 𝛽
4𝑥
4+
𝛽
5𝑥
5+ 𝛽
12𝑥
1𝑥
2+ 𝛽
13𝑥
1𝑥
3+ 𝛽
14𝑥
1𝑥
4+
𝛽
15𝑥
1𝑥
5+ 𝛽
23𝑥
2𝑥
3+ 𝛽
24𝑥
2𝑥
4+ 𝛽
25𝑥
2𝑥
5+
𝛽
34𝑥
3𝑥
4+ 𝛽
35𝑥
3𝑥
5+ 𝛽
45𝑥
4𝑥
5+ 𝛽
11𝑥
12+
𝛽
22𝑥
22+ 𝛽
33𝑥
32+ 𝛽
44𝑥
42+ 𝛽
55𝑥
52(3)
where β are the regression coefficients, y is the response variable and xi are the independent
(input) variables [49].
In this study tool wear and cutting tool vibrations are considered as uncontrollable parameters and are actually the outputs of machining process which are considered as inputs, hence it is not possible to implement full factorial design for analysis. Hence multiple regression analysis was used for unplanned experiments [31]. The analysis is performed using STATISTICA 12 [56]. The independent variables cutting speed, feed rate, depth of cut, tool flank wear and cutting tool vibrations (Vy)
have been denoted by A, B, C, D and E respectively and have been considered as inputs and surface roughness parameters Ra
and Rt are the response variables. Four
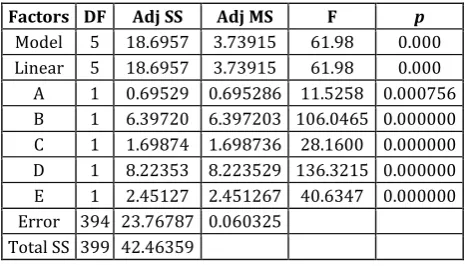
Table 2and 3shows the ANOVA table for Raand Rtbased on the first order model.
Table 2. ANOVA table for Ra first order model.
Factors DF Adj SS Adj MS F p
Model 5 18.6957 3.73915 61.98 0.000 Linear 5 18.6957 3.73915 61.98 0.000 A 1 0.69529 0.695286 11.5258 0.000756 B 1 6.39720 6.397203 106.0465 0.000000 C 1 1.69874 1.698736 28.1600 0.000000 D 1 8.22353 8.223529 136.3215 0.000000 E 1 2.45127 2.451267 40.6347 0.000000 Error 394 23.76787 0.060325
Total SS 399 42.46359
Table 3. ANOVA table for Rt first order model.
Factors DF Adj SS Adj MS F p
Model 5 325.22 65.044 72.39 0.000 Linear 5 325.22 65.044 72.39 0.000 A 1 13.32 13.316 14.82 0.000 B 1 101.63 101.628 113.10 0.000 C 1 21.91 21.912 24.39 0.000 D 1 121.59 121.591 135.32 0.000 E 1 77.61 77.612 86.37 0.000 Error 394 354.04 0.899
Total 399 679.26
From Table 2, it can be seen that all the parameters have significant effect on surface roughness parameter Ra. The tool wear (D) is
highly significant (F-value = 136.32) followed by feed rate (B) (F-value = 106.05). This is similar to the observation deduced from RFR. The same parameters have been found to be having significant influence on Rt which can be seen
from Table 3. The R2 generated for the first
order model for Ra has been found to be 44.03 % for training data and 28.04 % for test data whereas for Rtthe R2 for training data has been
found to be 47.88 % and 20.06 % for test data. The first order regression equations have been generated for Raand Rtwhich are represented as
given in eq. 4 and eq. 5 respectively.
R 𝑎= 0.640 − 0.002215A + 2.970B − 0.4457C
+ 1.575D + 0.003717E (4)
R𝑡= 3.207 − 0.00970A + 11.84B − 1.601C
+ 6.055D + 0.02091E (5)
Since the R2 values for the first order model
developed for Ra and Rt are low, second order
models have been developed.
Table 4and 5shows the ANOVA table for Raand Rtbased on the second order model. From table
4 it can be seen that tool wear (D) and Vy(E) did
not have a significant effect on Ra showing a p
value of 0.175 and 0.225 respectively which is more than 0.05.
Table 4. ANOVA table for Ra second order model.
Source DF Adj SS Adj MS F p
Model 20 28.8743 1.44371 40.26 0.000 Linear 5 2.3681 0.47363 13.21 0.000 A 1 0.2478 0.24783 6.91 0.009 B 1 0.3326 0.33259 9.28 0.002 C 1 1.1838 1.18375 33.01 0.000 D 1 0.0663 0.06630 1.85 0.175 E 1 0.0530 0.05305 1.48 0.225 Square 5 5.2178 1.04356 29.10 0.000 A*A 1 0.8074 0.80741 22.52 0.000 B*B 1 1.8479 1.84791 51.54 0.000 C*C 1 2.4151 2.41513 67.36 0.000 D*D 1 0.1429 0.14290 3.99 0.047 E*E 1 0.0006 0.00058 0.02 0.899 2-Way Inter. 10 4.9827 0.49827 13.90 0.000 A*B 1 0.5815 0.58151 16.22 0.000 A*C 1 2.4031 2.40313 67.02 0.000 A*D 1 0.0004 0.00044 0.01 0.911 A*E 1 0.1872 0.18721 5.22 0.023 B*C 1 0.0717 0.07175 2.00 0.158 B*D 1 0.8061 0.80606 22.48 0.000 B*E 1 0.3327 0.33267 9.28 0.002 C*D 1 0.1874 0.18741 5.23 0.023 C*E 1 0.4866 0.48657 13.57 0.000 D*E 1 0.0235 0.02349 0.66 0.419 Error 379 13.5893 0.03586
Total 399 42.4636
Table 5. ANOVA table for Rt second order model.
Source DF Adj SS Adj MS F p
Model 20 489.693 24.4846 48.95 0.000 Linear 5 37.065 7.4130 14.82 0.000
A 1 1.794 1.7943 3.59 0.059
B 1 10.590 10.5897 21.17 0.000 C 1 13.537 13.5367 27.06 0.000
D 1 3.772 3.7719 7.54 0.006
E 1 6.613 6.6127 13.22 0.000 Square 5 86.487 17.2975 34.58 0.000 A*A 1 12.194 12.1941 24.38 0.000 B*B 1 23.534 23.5335 47.05 0.000 C*C 1 49.258 49.2577 98.48 0.000 D*D 1 0.060 0.0598 0.12 0.730 E*E 1 0.178 0.1785 0.36 0.551 2-Way Inter. 10 81.652 8.1652 16.32 0.000 A*B 1 14.818 14.8183 29.63 0.000 A*C 1 31.128 31.1282 62.23 0.000 A*D 1 0.026 0.0261 0.05 0.820 A*E 1 0.597 0.5971 1.19 0.275 B*C 1 4.228 4.2276 8.45 0.004 B*D 1 17.523 17.5234 35.03 0.000 B*E 1 1.690 1.6900 3.38 0.067 C*D 1 3.613 3.6131 7.22 0.008 C*E 1 4.510 4.5105 9.02 0.003 D*E 1 0.061 0.0615 0.12 0.726 Error 379 189.566 0.5002
But A, B and C are significant in influencing the surface roughness parameter Ra. It is also
observed that square terms related to A, B, C and D showed a significant effect along with interaction between these parameters namely AB, AC, AE, BD, BE, CD and CE on Raachieving a
R2 of 68 % for training data and 46.14 % for test
data. For Rt, from table 5it can be observed that the individual effect of cutting speed (A), has been less significant on Rt, whereas all other
parameters have significant influence on Rt. Similar observations have been reported for RFR. The square terms corresponding to A, B, C and interaction effects AB, AC, BC, BD, CD and CE have been found to be significant, obtaining a R2
of 72.09 % for training data and 41.72 % for test data. Thus the R2 values obtained for both Raand
Rt for second order models are significantly
higher than the first order models. Further the reason for obtaining relatively low R2 value
could be attributed to inclusion of tool wear and cutting tool vibrations. It cannot be controlled by the user and it is preferred to have controllable parameters which are based on the fundamental of design of experiments [49]. The significant parameters identified differ, when the RSM analysis has been modified from first order model to the second order model. The second order regression equations have been generated for Raand Rtwhich are represented in Eq. 6 and
Eq. 7 respectively.
𝑅𝑎= 8.43 − 0.0726𝐴 + 38.41𝐵 − 12.43𝐶 + 1.80𝐷 +
0.03286𝐸 + 0.000158𝐴2− 63.70𝐵2+ 4.201𝐶2−
2.16𝐷2+ 0.000002𝐸2+ 0.0525𝐴𝐵 + 0.02903𝐴𝐶 +
0.00058𝐴𝐷 − 0.000061𝐴𝐸 − 2.28𝐵𝐶 + 12.42𝐵𝐷 − 0.0386𝐵𝐸 − 1.657𝐶𝐷 − 0.0115𝐶𝐸 −
0.00774𝐷𝐸 (6)
𝑅𝑡= 34.26 − 0.2672𝐴 + 155.1𝐵 − 50.55𝐶 + 1.70𝐷 +
0.0864𝐸 + 0.000614𝐴2+ 227.3𝐵2+ 18.97𝐶2−
1.40𝐷2− 0.000030𝐸2− 0.2548𝐴𝐵 + 0.1045𝐴𝐶 −
0.0044𝐴𝐷 − 0.000109𝐴𝐸 − 17.47𝐵𝐶 + 57.92𝐵𝐷 − 0.0869𝐵𝐸 − 7.27𝐶𝐷 − 0.0339𝐶𝐸 +
0.0125𝐷𝐸 (7) By using Eq. (4), (5), (6) and (7), the Ra and Rt
values have been predicted and prediction accuracies has been calculated by considering the mean squared error as represented in eq. (1).
From the analysis, it has been found that the prediction accuracy for Ra for first order model
has been found to be 87.75 % on training data and 28.04 % on test data whereas for second order model, it has been found to be 92.06 % on training data and 91.78 % on test data. For Rt,
considering first order model it has been found to be 34.75 % on training data and 22.95 % on test data, whereas for second order model, it has been found to be 39.05 % for training data and 38.36 % for test data. Rt has
higher numerical values than Ra. RSM can
predict values more accurately when the surface roughness values are below 1 µm and the prediction accuracy decreases as the values goes higher which has been discussed by Agrawal et al. in his study of surface roughness prediction in hard turning of AISI 4340 steel [36].
7.1 Response Surface Plots
Response plots shows the three dimensional effect of independent variables on response variables. Only Ra surface plots have been
considered and the results discussed. Rt plots
showed similar effects of input variables on the response. The surface plots have been developed by considering feed rate as fixed on one scale, due to the reason that it is a significant parameter affecting surface roughness and other parameters in combinations have been changed on the other scales. Surface plots using second order model have been developed as the R2 of
the model has been found to be higher than the first order model. Figures 15 - 18 shows the response plots generated using second order model to understand the effect of cutting speed, depth of cut, tool wear and cutting tool vibrations (Vy) on Ra. Similar results have been
obtained for Rtand hence has not been discussed
in this paper.
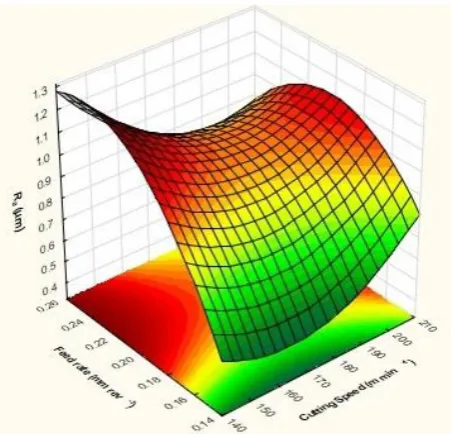
Figure 15 shows the surface plot considering cutting speed and feed rate. It can be seen that surface roughness increases with increase in feed rate, whereas the variation of cutting speed showed a curvy trend. It is maximum at lower cutting speed, decreased gradually and then increased for higher cutting speeds. This might be caused due to the fact that insert loses its coating between 165-175 m min-1 exposing the
substrate and further increase in speed causes poor surface finish. Similar kind of behaviour has been observed in the experimental evaluation where the lowest surface roughness achieved was during turning at an intermediate cutting speed of 175 m min-1.
Figure 16 shows the surface plot considering feed rate and depth of cut. It can be seen that feed rate and surface roughness are directly correlated. As feed rate increases, surface roughness increases, but when there is increase in depth of cut, from 0.8 mm to 1 mm, it showed a gradual decrease in surface roughness beyond which it again increased. From the experimental analysis, it is clearly observed that the lowest surface roughness is achieved for a depth of cut of 1 mm.
Fig. 16. 3-D plot considering feed rate and depth of cut.
Figure 17 shows the surface plot considering feed rate and tool wear. As the feed increased, surface roughness gradually increased and after 0.2 mm/rev, the value slightly decreased. But as the tool wear increased, the surface roughness gradually increased and then again it started to decrease when the tool wear reached the
limiting value. This is due to the deformation experienced at the tool nose thereby resulting in a smoother surface [55].
Fig. 17. 3-D plot considering feed rate and tool wear.
Fig. 18. 3-D plot considering feed rate and Vy.
Figure 18 shows the surface plot considering feed rate and cutting tool vibrations (Vy). Feed
8. COMPARISON OF TECHNIQUES
Table 6 shows the comparison of the two statistical techniques namely Response Surface Methodology and Random Forest Regression for surface roughness modeling during high speed turning of Ti-6Al-4V. A comparison of RSM and RFR has been done in order to understand their application to modeling during machining of titanium alloys. RSM is a widely used technique as cited in the literature for various modeling studies in machining [29]. And RFR is a new technique which can give higher modeling and prediction accuracies. The modeling performance comparison of these techniques has been carried out using two different criteria, namely coefficient of determination (R2) and
prediction accuracies.
From the Table 6, it can be seen that RFR produced better performance in terms of prediction accuracy achieving 95.75 % on training data and 90.16 % on test data for Raand
55.25 % on training data and 34.43 % on test data for Rt. When R2 has been compared, the
highest R2 has been achieved using RFR
technique for Raobtaining a value of 82.52 % for
training data and 68.59 % for test data whereas for Rt, the R2 is 81.78 % on training data and
51.79 % on test data. This comparison shows that RFR is superior in the modeling and prediction of surface roughness than RSM.
Table 6. Comparison of Statistical Techniques.
Sl.
No. Tech. Param. R
2 Prediction
Accuracy Train data Test data Train data Test data 1 RSM Ra 67.87 54.39 92.06 91.78
Rt 68.28 65.24 39.05 38.36
2 RFR Ra 76.27 55.14 92.6984 89.0411 Rt 72.1 53.87 52.0635 30.8219
Table 7 shows the Standard Deviation (SD) of the predicted values of training and test data from RFR and RSM for second order models. It can be seen that RFR exhibits the lower standard deviation for Ra and Rt. RFR is more robust than
RSM [57]. RFR is able to discover complex relationships between the dependent and independent variables. It works effectively even when the data is noisy (as in this application). It does not require any preprocessing and removal of outlier. It automatically partitions the data and generates the necessary fit. There is no need to generate complex quadratic
equations as required in case of RSM with either square, interaction or both terms. RFR can be tuned easily and has the ability to generate visual information for direct usage [42].
Table 7. Standard deviation of the models.
SD of the predicted values for
Roughness
parameters RSM RFR
Training data set
Ra 0.270343306 0.242250104
Rt 1.072109874 1.297331045
Test data set
Ra 0.269763943 0.220568562
Rt 1.085455943 1.323856828
(a)
(b)
Fig. 19. Observed vs. predicted values of test data comparison for Rausing (a) RSM and (b) RFR technique.
Figures 19and 20shows the comparison of the observed vs. predicted values for Raand Rtusing
(a)
(b)
Fig. 20. Observed vs. predicted values of test data comparison for Rtusing (a) RSM and (b) RFR technique.
Similar performance results were obtained by Agrawal et al. in their study for surface roughness prediction in hard turning AISI 4340 steel [36]. The models are good at predicting the surface roughness if the values are less than 1 µm.
9. CONCLUSIONS
This study deals with the experimental evaluation of machining parameters namely cutting speed, feed rate and depth of cut along with parameters like tool wear and cutting tool vibrations on surface roughness parameters Ra
and Rt during turning of Ti-6Al-4V. In order to
find out the statistical significance of different machining parameters on surface roughness parameters and also to develop models for prediction, two statistical techniques namely Response Surface Methodology and Random Forest Regression have been used. Thus the
efforts of the authors have been to use both experimental and modeling studies to validate certain observations with regard to high speed machining of Ti-6Al-4V made and also to suggest a suitable modeling technique for these kinds of application. Based on the experimental investigations and modeling studies, the following conclusions can be made:
1. Increase in cutting speed increases the tool flank wear of the coated carbide inserts, whereas flank wear decreased with increase in feed rate. Better tool life can be achieved for intermediate depth of cut.
2. Surface roughness improves with increase in tool wear for all the cutting conditions investigated.
3. Cutting tool vibration in speed direction (Vy)
has been found to be more than feed (Vz)
and depth of cut (Vx) directions.
4. Cutting tool vibrations (Vy) show a
significant effect on both the surface roughness parameters Raand Rt.
5. The amplitude of vibrations are lowest for an intermediate speed and highest for maximum speed.
6. RFR has been found to be superior in terms of prediction accuracies and Coefficient of Regression (R2) for surface roughness
parameters Raand Rtthan RSM.
7. RFR and RSM revealed that tool wear has significant effect on surface roughness parameters Ra and Rt followed by feed rate,
cutting tool vibrations and depth of cut and cutting speed has the least significance. 8. RFR works more effectively than RSM in
this application, where the authors have considered tool wear and cutting tool vibrations as the input, but in actual those are the output parameters of the machining process.
Acknowledgement
REFERENCES
[1] A.R. Machado, J. Wallbank, Machining Of Titanium And Its Alloys-A Review, Proceedings of the Institution of Mechanical Engineers, Part B: Journal of Engineering Manufacture, vol. 204, pp. 53-60, 1990, doi: 10.1243/Pime_Proc_1990_204_047_02
[2] S. Ramesh, L. Karunamoorthy, K. Palanikumar,
Fuzzy modeling and analysis of machining parameters in machining titanium alloy, Materials and Manufacturing Processes, vol. 23, iss. 4,pp. 439-447, 2008, doi: 10.1080/10426910801976676
[3] S. Ramesh, L. Karunamoorthy, K. Palanikumar,
Surface roughness analysis in machining of titanium alloy, Materials and Manufacturing Processes, vol. 23, iss. 2, pp. 174-181, 2008, doi: 10.1080/10426910701774700
[4] R. Komanduri, Some clarifications on the mechanics of chip formation when machining titanium alloys, Wear, vol. 76, iss. 1, pp. 15-34, 1982. doi: 10.1016/0043-1648(82)90113-2
[5] M. Kikuchi, The use of cutting temperature to evaluate the machinability of titanium alloys, Acta biomaterialia, vol. 5, iss. 2, pp. 770-775, 2009, doi: 10.1016/j.actbio.2008.08.016
[6] N. Fang, Q. Wu, A comparative study of the cutting forces in high speed machining of Ti6Al4V and Inconel 718 with a round cutting edge tool,
Journal of Materials Processing Technology, vol. 209, iss. 9, pp. 4385-4389, 2009, doi: 10.1016/j.jmatprotec.2008.10.013
[7] J. Schey, Introduction to Manufacturing Processes, McGrawHill Book Co, 1221 Avenue of the Americas, New York, New York 10020, USA, 1987. [8] A. Pramanik, Problems and solutions in
Machining of Titanium Alloys, The International Journal of Advanced Manufacturing Technology, vol. 70, iss. 5-8, pp. 919-928, 2014, doi: 10.1007/s00170-013-5326-x
[9] J.I. Hughes, A.R.C. Sharman, K. Ridgway, The effect of cutting tool material and edge geometry on tool life and workpiece surface integrity, Proceedings of the Institution of Mechanical Engineers, Part B: Journal of Engineering Manufacture, vol. 220, no. 2, pp. 93-107, 2006,
doi: 10.1243/095440506X78192
[10]J. Sun, Y.B. Guo, A comprehensive experimental study on surface integrity by end milling Ti6Al4V, Journal of Materials Processing Technology, vol. 209, iss. 8, pp. 4036-4042, 2009, doi: 10.1016/j.jmatprotec.2008.09.022
[11] E.A. Rahim, S. Sharif, Investigation on tool life and surface integrity when drilling Ti-6Al-4V and Ti-5Al-4VMo/Fe, JSME I. J. Series C Mechanical Systems,
Machine Elements and Manufacturing, vol. 49, no. 2, pp. 340-345, 2006, doi: 10.1299/jsmec.49.340
[12]D. Ulutan, T. Ozel, Methodology to determine friction in orthogonal cutting with application to machining titanium and nickel based alloys,
ASME. International Manufacturing Science and Engineering Conference, ASME 2012 International Manufacturing Science and Engineering Conference, Notre Dame, Indiana, USA, June 4–8, pp. 327-334, 2012, doi: 10.1115/MSEC2012-7275
[13]A. Ginting, M. Nouari, Surface integrity of dry machined titanium alloy, International Journal of Machine Tools and Manufacture, vol. 49, iss.
3-4, pp. 325-332, 2009, doi:
10.1016/j.ijmachtools.2008.10.011
[14] E.O. Ezugwu, R.B. Da Silva, J. Bonney, A.R. Machado,
Evaluation of the performance of CBN tools when turning Ti6Al4V alloy with high pressure coolant supplies, International Journal of Machine Tools and Manufacture, vol. 45, iss. 9, pp. 1009-1014, 2005, doi: 10.1016/j.ijmachtools.2004.11.027
[15]Z.A. Zoya, R. Krishnamurthy, The performance of CBN tools in the machining of titanium alloys, Journal of Materials Processing Technology, vol. 100, iss. 1-3, pp. 80-86, 2000, doi: 10.1016/S0924-0136(99)00464-1
[16] A. Jawaid, S. Sharif, S. Koksal, Evaluation of wear mechanisms of coated carbide tools when face milling titanium alloy, Journal of Materials Processing Technology, vol. 99, iss. 1-3, pp. 266-274, 2000, doi: 10.1016/S09240136(99)00438-0
[17]S. Sun, M. Brandt, J.P. Mo, Evolution of tool wear and its effect on cutting forces during dry machining of Ti-6Al- 4V alloy, Proc I Mech Engineers, Part B: Journal of Engineering Manufacture, vol. 228, no. 2, pp. 191-202, 2014,
doi: 10.1177/0954405413500243
[18]M.V. Ribeiro, M.R.V. Moreira, J.R. Ferreira,
Optimization of titanium alloy (6Al4V)
machining, Journal of Materials Processing Technology, vol. 143-144, pp. 458-463, 2003,
doi: 10.1016/S0924-0136(03)00457-6
[19]T. Thepsonthi, T. Ozel, Experimental and finite element simulation based investigations on micro-milling Ti-6Al-4V titanium alloy: Effects of CBN coating on tool wear, Journal of Materials Processing Technology, vol. 213, iss. 4, pp. 532-542, 2013, doi: j.jmatprotec.2012.11.003
[21]P.S. Pai, G. D’Mello, Vibration signal analysis for monitoring tool wear in high speed turning of Ti-6Al-4V, Indian Journal of Engineering & Material Science, vol. 22, pp.652-660, 2015.
[22] E.O. Ezugwu, J. Bonney, R.B. Da Silva, O. Cakir,
Surface integrity of finished turned Ti6Al4V alloy with PCD tools using conventional and high pressure coolant supplies, International Journal of Machine Tools and Manufacture, vol. 47, iss. 6, pp.884-891, 2007, doi: 10.1016/j.ijmachtools.2006.08.005
[23]Y. Su, N. He, L. Li, X.L. Li, An experimental investigation of effects of cooling/lubrication conditions on tool wear in highspeed end milling of Ti-6Al-4V, Wear, vol. 261, iss. 7-8, pp.760-766, 2006, doi: 10.1016/j.wear.2006.01.013
[24]P.G. Benardos, G.C. Vosniakos, Predicting surface roughness in machining: a review, International Journal of Machine Tools and Manufacture, vol. 43, iss. 8, pp. 833-844, 2003, doi: 10.1016/S0890-6955(03)00059-2
[25]R. Yigit, E. Celik, F. Findik, S. Koksal, Effect of cutting speed on the performance of coated and uncoated cutting tools in turning nodular cast iron, Journal of Materials Processing Technology, vol. 204, iss. 1-3, pp. 80-88, 2008, doi: 10.1016/j.jmatprotec.2007.10.082
[26]C.C. Haron, A. Ginting, J.H. Goh, Wear of coated and uncoated carbides in turning tool steel, Journal of Materials Processing Technology, vol. 116, iss. 1, pp.49-54, 2001, doi: 10.1016/S0924-0136(01)00841-X
[27]N. Fang, P.S. Pai, N. Edwards, A comparative study of highspeed machining of Ti-6Al-4V and Inconel 718part II: Effect of dynamic tool edge wear on cutting vibrations, The International Journal of Advanced Manufacturing Technology, vol. 68, iss. 5-8, pp. 1417-1428, 2013, doi: 10.1007/s00170-013-4931-z
[28]S. Kosaraju, V.G. Anne, Optimal machining conditions for turning Ti-6Al-4V using response
surface methodology, Advances in
Manufacturing, vol. 1, iss. 4, pp. 329-339, 2013,
doi: 10.1007/s40436-013-0047-9
[29] K.H. Hashmi, G. Zakria, M.B. Raza, S. Khalil,
Optimization of process parameters for high speed machining of Ti-6Al-4V using response surface methodology, The International Journal of Advanced Manufacturing Technology, vol. 85, iss. 5-8, pp. 1847-1856, 2016, doi: 10.1007/s00170-015-8057-3
[30]S. Ramesh, L. Karunamoorthy, K. Palanikumar,
Measurement and analysis of surface roughness in turning of aerospace titanium alloy (gr5), Measurement, vol. 45, iss. 5, pp. 1266-1276, 2012, doi: 10.1016/j.measurement.2012.01.010
[31] V. Upadhyay, P.K. Jain, N.K. Mehta, In-process prediction of surface roughness in turning of Ti6Al4V alloy using cutting parameters and vibration signals,
Measurement, vol. 46, iss. 1, pp. 154-160, 2013, doi:
10.1016/j.measurement.2012.06.002
[32] N.C. Tsourveloudis, Predictive modeling of the Ti6Al4V alloy surface roughness, Journal of Intelligent & Robotic Systems, vol. 60, iss. 3-4, pp. 513-530, 2010, doi: 10.1007/s10846-010-9427-6 [33]G. DMello, P.S. Pai, N.P. Puneet, Prediction of
surface roughness in high speed turning of Ti 6Al-4V (ES-103), Int Conference on Computational Methods in Engineering and Health Sciences (ICCMEH- 2014), December 17-19, 2014.
[34] G. DMello, P.S. Pai, Prediction of surface roughness in high speed machining: a comparison, Proc. International Journal of Research in Engineering and Technology, vol. 1, pp. 519-525, 2014, doi:
10.15623/ijret.2014.0315098.
[35]L. Breiman, Random forests, Machine learning, vol. 45, iss. 1, pp. 5-32, 2001, doi:
10.1023/A:1010933404324
[36]A. Agrawal, S. Goel, W.B. Rashid, M. Price,
Prediction of surface roughness during hard turning of AISI 4340 steel (69HRC), Applied Soft Computing, vol. 30, pp. 279-286, 2015, doi: 10.1016/j.asoc.2015.01.059
[37]S. Oliveira, F. Oehler, J. San-Miguel-Ayanz, A. Camia, J.M. Pereira, Modeling spatial patterns of fire occurrence in Mediterranean Europe using Multiple Regression and Random Forest, Forest Ecology and Management, vol. 275, pp. 117-129, 2012, doi: 10.1016/j.foreco.2012.03.003 [38] N.A. Kovdienko, P.G. Polishchuk, E.N. Muratov, A.G.
Artemenko, V.E. Kuz’min, L. Gorb, J. Leszczynski,
Application of random forest and multiple linear regression techniques to QSPR prediction of an aqueous solubility for military compounds,
Molecular Informatics, vol. 29, iss. 5, pp. 394-406, 2010, doi: 10.1002/minf.201000001
[39]C. Hultquist, G. Chen, K. Zhao, A comparison of Gaussian process regression, random forests and support vector regression for burn severity assessment in diseased forests, Remote sensing letters, vol. 5, iss. 8, pp. 723-732, 2014, doi: 10.1080/2150704X.2014.963733
[40]H. Pang, A. Lin, M. Holford, B.E. Enerson, B. Lu, M.P. Lawton, H. Zhao, Pathway analysis using random forests classification and regression, Bioinformatics, vol. 22, no. 16, pp. 2028-2036, 2006, doi: 10.1093/bioinformatics/btl344
of Neuroscience Methods, vol. 220, iss. 1, pp. 85-91, 2013, doi: 10.1016/j.jneumeth.2013.08.024
[42]D.Y. Pimenov, A. Bustillo, T. Mikolajczyk,
Artificial intelligence for automatic prediction of required surface roughness by monitoring wear on face mill teeth, Journal of Intelligent Manufacturing, vol. 29, iss. 5, pp. 1045-1061, 2017, doi: 10.1007/s10845-017-1381-8
[43]A. Devillez, G. Le Coz, S. Dominiak, D. Dudzinski,
Dry machining of Inconel 718, workpiece surface
integrity, Journal of Materials Processing
Technology, vol. 211, iss. 10, pp. 1590-1598, 2011, doi: 10.1016/j.jmatprotec.2011.04.011 [44]Standard, I. S. O. (1993). 3685. Tool-life Testing
with Single Point Turning Tools.
[45]Y.W. Wang, J.F. Li, Z.M. Li, T.C. Ding, S. Zhang,
Experimental Investigation on Tool Wear when End-Milling Inconel 718 with Coated Carbide Inserts, Advanced Materials Research, vol. 188,
pp. 410-415, 2011. doi:
10.4028/www.scientific.net/AMR.188.410
[46] V.P. Astakhov, Effects of the cutting feed, depth of cut, and workpiece (bore) diameter on the tool wear rate, The International Journal of Advanced Manufacturing Technology, vol. 34, iss. 7-8, pp. 631-640, 2007, doi: 10.1007/s00170-006-0635-y
[47]M.E.R. Bonifacio, A.E. Diniz, Correlating tool wear, tool life, surface roughness and tool vibration in finish turning with coated carbide tools, Wear, vol. 173, iss. 1-2, pp. 137-144, 1994.
doi: 10.1016/0043-1648(94)90266-6
[48]X. Yang, R.C. Liu, Machining titanium and its alloys, Machining Science and Technology, vol. 3, iss. 1, pp. 107-139, 1999, doi: 10.1080/10940349908945686
[49]D.C. Montgomery, Design and analysis of experiments. John Wiley & Sons. 2008.
[50] F. Wang, J. Zhao, A. Li, J. Zhao, Experimental study on cutting forces and surface integrity in high-speed
side milling of Ti-6Al-4V titanium alloy, Machining Science and Technology, vol. 18, iss. 3, pp. 448-463, 2014, doi: 10.1080/10910344.2014.926690
[51]A.N. Amin, A.F. Ismail, M.N. Khairusshima,
Effectiveness of uncoated WCCo and PCD inserts in end milling of titanium alloyTi6Al4V, Journal of Materials Processing Technology, vol. 192-193,
pp. 147-158, 2007, doi:
10.1016/j.jmatprotec.2007.04.095
[52]A. Pramanik, G. Littlefair, Machining of titanium alloy (Ti-6Al-4V) theory to application, Machining Science and Technology, vol. 19, iss. 1, pp. 1-49, 2015, doi: 10.1080/10910344.2014.991031 [53] C.C. Chen, N.M. Liu, K.T. Chiang, H.L. Chen,
Experimental investigation of tool vibration and surface roughness in the precision end milling process using the singular spectrum analysis, The International Journal of Advanced Manufacturing Technology, vol. 63, iss. 5-8, pp. 797-815, 2012.
doi: 10.1007/s00170-012 3943-4
[54] P.J. Arrazola, A. Garay, L.M. Iriarte, M. Armendia, S. Marya, F. Le Maitre, Machinability of titanium alloys (Ti6Al4V and Ti555. 3), Journal of materials processing technology, vol. 209, iss. 5, pp. 2223-2230, 2009, doi: 10.1016/j.jmatprotec.2008.06.020
[55] C.H. Che-Haron, Tool life and surface integrity in turning titanium alloy, Journal of Materials Processing Technology, vol. 118, iss. 1-3, pp. 231-237, 2001, doi: 10.1016/S09240136(01)00926-8
[56] S. Soft, Statistica 12. Tulsa, OK: Stat Soft Inc. 2013. [57]C. da Silva Chagas, W. de Carvalho Junior, S.B.
Bhering, B. Calderano Filho, Spatial prediction of soil surface texture in a semiarid region using random forest and multiple linear regressions,
Catena, vol. 139, pp. 232-240, 2016, doi: 10.1016/j.catena.2016.01.001