An Application of Categorical Analysis of Variance
in Nested Arrangements
Iwundu M. P.*, Anyanwu C. O.
Department of Mathematics and Statistics, University of Port Harcourt, Nigeria
Abstract
Categorical data, having no underlying metric, are frequently encountered in experimental situations. Analysis of such data deviates from the usual methods involving continuous-type data. In this paper, the significance of main factor (Geo-political Zones) and sub-factor (States) are studied using categorical data in nested arrangements. The CATANOVA technique used is suitable for mixed design, having some factors crossed and others nested. Consideration is made for frequency data involving National Examination Council (NECO) and West African Examination Council (WAEC), from 2003 to 2010. Numerical results show that the main factor, Geo-political Zone and the sub-factor, States, are significant having p-value of less than 0.00001 in each case.Keywords
Categorical data, Categorical Analysis of Variance, Crossed factor, Nested factor, Main effects, Sub-factor effects1. Introduction
According to Agresti (2007), categorical data analysis deals with data that classify an observation into one or more categories. Two main types of categorical variables involves are variables whose data are on nominal or ordinal scale of measurement. By nominal scale, we refer to a discrete classification of data, in which data are neither measured nor ordered but subjects are merely allocated to distinct categories. Nominal scales are used merely for labelling variables, without any quantitative value, to identify or classify the objects. Quantitative data in the case of nominal categorical variables refer to discrete data otherwise called frequency data. Nominal variable yields unordered qualitative variable and possesses no inherent ordering or nominal distance between categories. In other words, the order of listing the categories is not important. According to Weiss (2009), nominal data are inherently less informative than quantitative data, it does not convey information about the magnitude of differences and it is not also clear on how to deal with missing data. Categorical variables having ordered scales are ordinal variables. Ordinal variables give rise to natural ordering. It is common sometimes to use numerical values to denote the ordering information in an ordinal variable. However, numerical variables corresponding to
* Corresponding author:
[email protected] (Iwundu M. P.) Published online at http://journal.sapub.org/ijps
Copyright©2018The Author(s).PublishedbyScientific&AcademicPublishing This work is licensed under the Creative Commons Attribution International License (CC BY). http://creativecommons.org/licenses/by/4.0/
categories of ordinal variables only show the ranking order in a particular attribute.
A number of researchers have displayed categorical variable in a 2 x 2 contingency table or by cross classification. Cross-classified data are viewed as when subjects are classified by two or more types of clusters, but the clusters are not hierarchical or nested within one another. As is commonly seen, many data sets come in the form of counts of individuals, classified into one of a finite set of disjoint categories. The data consist of the numbers of observations falling into each category. Thus, two factors are crossed when every category of one factor occurs in the design with every category of the other factor. In other words, there is at least one observation in every combination of categories for the two factors. On the other hand, a factor is nested within another factor when each category of the first factor co-occurs with only one category of the other factors. In other words, an observation has to be within one category of say Factor 2 in order to have a specific category of Factor 1.
treatment combinations in which some factors are crossed with other factors, and some factors are nested within other factors. The need for nesting of factors arises when an experimental situations requires that unique levels of one factor occur within each level of a second factor.
Researchers are faced with the problem of developing useful methods for analysing categorical data. Although methods for analysing quantitative (continuous) variables are vast, the assumptions are completely different when the data structure is non-quantitative. This puts a big restriction on the use of such techniques for categorical data. Due to the seeming complexity with categorical data, many inferential problems still remain unanswered when considering nominal categorical data. The aim of this paper is to illustrate the analysis of variance of categorical data involving frequency data in nested arrangement, using performance of students examinations conducted by National Examination Council (NECO) and West Africa Examination Council (WAEC). The main factor shall be the Geo-political Zones and the sub-factor shall be the States. The objectives of this study include
1. Assessing the significance of the main factor. 2. Assessing the significance of the sub-factor.
In all cases, investigation shall be gender-based (sex) and Period-based or Duration-base (year of examination).
Many literatures have shown the existence of several techniques for analysing data in contingency table. Some group of researchers deal with categorical data in their original format while a second group of researchers transform categorical data to enable the data be treated with existing methods for quantitative data. For instance, Winsor (1948) introduced logit transformation for factorial analysis of multiple dichotomous data. Cochran (1950) while considering comparison of percentages in matched samples suggested assigning values of 0 or 1 to represent the responses in the two categories. Dyke and Patterson (1952) provided a method for the case in which the data are proportions, applicable whether the numbers of observations are equal or not. The data are subjected to logit transformation such that in the new scale of measurements observations can reasonably be represented as linear functions of a number of parameters. Gart and Zweifel (1967) extended the technique of Dyke and Patterson (1952) by introducing weighting function for a special case of dichotomous data. Light and Margolin (1971) reported the measure of variations for categorical data and developed a general approach of analysis of variance for a one-way table with categorical response.
The general approach to categorical data proposed by Light and Moagolin (1971) started with the computation of the total variation in the data and then partitioning this variation into specific components. The distributions of the various components are derived using a multinomial model. Onukogu (1985a) studied the effect of specification such as random, fixed and mixed models on test for significance of factors in a CATANOVA. A linear additive model for a
two-way classification was proposed, hence establishing a strong link between Analysis of variance (ANOVA) and Categorical Analysis of variance (CATANOVA). Onukogu (1985a) obtained an F-test for main effects as well as estimate of missing responses and adjusted row and column effects for balanced incomplete designs. Transformation such as log-linear and logit were not necessary rather data were analysed using their original format. According to Onukogu (1985b), a two-way ANOVA with quantal responses is equivalent to a three-way contingency table in which one of the classifications is treated as responses to the other two classifications. Knowing that sum of square in ANOVA is viewed as the departure of individual observations from their mean which is not helpful in the case of nominal data since mean is an undefined concept, Onukogu (1985b) reported that one of the hard nut to crack in any analysis of variance of categorical data is the definition and computation of sum of squares. However, he viewed sum of square (SS) of a set of data as the trace of its variance-covariance matrix. Singh (1996) obtained the adjusted sum of squares for rows and columns with restriction to situation where interaction is absent. He used the one moment approximation to derive the asymptotic null distribution of the test statistic as used by Light and Margolin (1971) and Onukogu (1985a,b).
It is believed that categorical outcomes can be analysed using ANOVA technique if the arcsine-squre-root logit transformation is applied according to Cochran (1940), Rao (1960), Winer et al (1971). However, Florian (2008) argued that the use of ANOVA for the analysis of categorical data is misleading as with ANOVA over arcsine-square-root transformation, proportions of categorical outcomes can lead to spurious null result and spurious significances which go beyond normal chance of type I and type II error. Singh (2004) studied the validity of the existing CATANOVA method to analyse the nominal data for single and multi-group repeated measure designs and developed a modified test for single and multiple-repeated measure design.
since two variables will either match or do not match. Onukogu (2014) provided the analytical tools for mixed design when some factors may be crossed while other are nested. In the technique, frequency data are analysed in their original format, without the need for any transformation. The work provides a CATANOVA method for testing for the significance of nested factors. In his study, a breakdown was given of the total observed variation into independent sources such that the effect of each factor can be tested and concluded separately.
2. Methodology
The data for this research work involve m-way contingency table in which one of the classifications may be viewed as response to the others as in Onukogu (1985b). The m-way contingency table is equivalent to an (m-1)-way CATANOVA. Throughout this work, frequency data
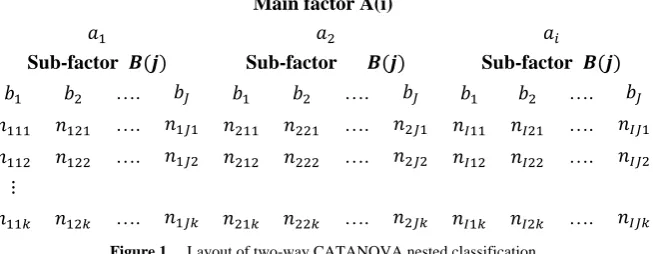
involving the performance of students in senior category Examinations conducted by West African Examination council (WAEC) and National Examination Council (NECO) for the period of 2003 to 2010 are employed. The data satisfy the general layout for Categorical data in nested arrangement as presented in Onukogu (2014). Geopolitical Zones and States shall respectively form the main factor and the sub-factor. The performance in the examination shall be viewed as (i) Gender-based and (ii) Duration or Time-based. The two-way Categorical analysis of variance in a nested arrangement due to Onukogu (2014) is adopted for this research. We assume no loss in generality using the method, for unequal levels of sub-factor that do not differ significantly. However, for computational ease, the average of the sub-factor levels shall be employed. The layout for the two-way CATANOVA nested classification is presented in Figure 1 as follows;
Main factor A(i)
Sub-factor Sub-factor Sub-factor
…. …. ….
…. …. ….
…. …. ….
…. …. ….
Figure 1. Layout of two-way CATANOVA nested classification
In Figure 1, factor A and factor B have responses per unit where factor A has levels and factor B has levels. The cell totals are such that
The statistical model for the two-way nested classification for the Categorical data is the three- component model.
(1)
where
is a constant for the response
is the effect of the level of factor A is the effect of the j level of factor B within
the level of factor A.
The fundamental assumptions in Categorical analysis of variance are associated with statistical distributions,
statistical independence and constant variance. It is general to assume multinomial probability model given by
P (
where
is binomial with probability . The covariance
is given as
The variance is given as
More details regarding the assumptions may be seen in the literature used in this work. The two hypotheses considered in a nested classification, given that the data are enumerative, are;
The interpretation of the statistical statement in is
interpretation of the statistical statement in is that
there is no sub-factor effect. Let the model be;
(2)
(3)
is a constant for the response
is the effect of the level of factor A is the effect of the j level of factor B within
the level of factor A. Equating (2) and (3) gives
Squaring both sides
(4)
Multiplying both sides by gives
(5)
Taking summation over both sides yields
(6) This implies (7) This implies
(8) Since (Onukogu; 2014) (9) Expanding (9) gives
(10)
which results in
(11)
By rearrangement, we have
(12)
Adding n to both sides gives
(13)
Equation (13) is a partition of the sum of squares. Thus (14) (15) (16) (17)
If we let
then
The total sum of squares (TSS) has degree of freedom. The unit of sum of squares (USS) has degrees of freedom. The sum of squares (SSA) of factor A has degrees of freedom. The sum of squares ( )
of the sub-factor B has degrees of freedom. It has been shown in Onukogu (2014) that as tends
to infinity, have approximate Chi-square
distributions with and degress of freedom respectively. Hence in testing the hypothesis about the main factor effects, the test statistics is
Also, in testing the hypothesis about the sub-factor effects, the test statistics is
provided that TSS is independent of
Further details on asymptotic distribution may be seen in Onukogu (2014).
The CATANOVA table is summarized in Table 2.1.
Table 2.1. CATANOVA table for significance of effects
Source of variation Degrees of freedom Sum of squares Mean Squares Test
ratio Hypothesis
3. Results
With reference to the two-way nested classification for NECO 2003 in Appendix 1, the components of the sums of squares are computed as
= 14873.44 + 43775.86 + … + 21753.45
The respective sums of squares are
The test statistic for assessing the significance of main factor effect is computed as
The test statistics for assessing the significance of sub-main factor effect is computed as
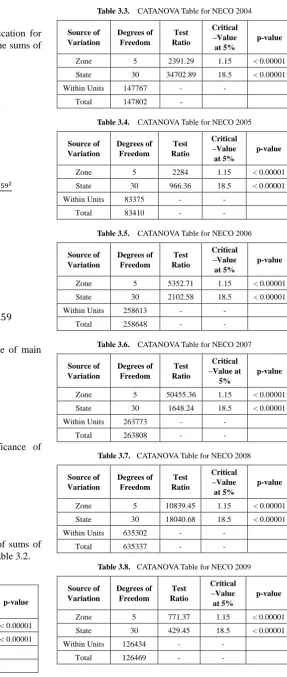
The CATANOVA Table for the partitioning of sums of squares and testing relevant hypotheses is as in Table 3.2.
Table 3.2. CATANOVA Table for NECO 2003
Source of Variation
Degrees of
Freedom Test Ratio
Critical –Value at 5%
p-value
Zone 5 2391.29 1.15 < 0.00001
State 30 34702.89 18.5 < 0.00001
Within Units 247401 - -
Total 2474436 - -
Table 3.3. CATANOVA Table for NECO 2004
Source of Variation Degrees of Freedom Test Ratio Critical –Value at 5% p-value
Zone 5 2391.29 1.15 < 0.00001
State 30 34702.89 18.5 < 0.00001
Within Units 147767 - -
Total 147802 -
Table 3.4. CATANOVA Table for NECO 2005
Source of Variation Degrees of Freedom Test Ratio Critical –Value at 5% p-value
Zone 5 2284 1.15 < 0.00001
State 30 966.36 18.5 < 0.00001
Within Units 83375 - -
Total 83410 - -
Table 3.5. CATANOVA Table for NECO 2006
Source of Variation Degrees of Freedom Test Ratio Critical –Value at 5% p-value
Zone 5 5352.71 1.15 < 0.00001
State 30 2102.58 18.5 < 0.00001
Within Units 258613 - -
Total 258648 - -
Table 3.6. CATANOVA Table for NECO 2007
Source of Variation Degrees of Freedom Test Ratio Critical –Value at 5% p-value
Zone 5 50455.36 1.15 < 0.00001
State 30 1648.24 18.5 < 0.00001
Within Units 263773 - -
Total 263808 - -
Table 3.7. CATANOVA Table for NECO 2008
Source of Variation Degrees of Freedom Test Ratio Critical –Value at 5% p-value
Zone 5 10839.45 1.15 < 0.00001
State 30 18040.68 18.5 < 0.00001
Within Units 635302 - -
Total 635337 - -
Table 3.8. CATANOVA Table for NECO 2009
Source of Variation Degrees of Freedom Test Ratio Critical –Value at 5% p-value
Zone 5 771.37 1.15 < 0.00001
State 30 429.45 18.5 < 0.00001
Within Units 126434 - -
Table 3.9. CATANOVA Table for NECO 2010 Source of Variation Degrees of Freedom Test Ratio Critical –Value at 5% p-value
Zone 5 909.77 1.15 < 0.00001
State 30 538.30 18.5 < 0.00001
Within Units 105946 - -
Total 105981 - -
Table 3.10. CATANOVA Table for WAEC 2003
Source of Variation Degrees of Freedom Test Ratio Critical –Value at 5% p-value
Zone 5 5352.71 1.15 < 0.00001
State 30 2102.58 18.5 < 0.00001
Within Units 200111 - -
Total 200146 - -
Table 3.11. CATANOVA Table for WAEC 2004
Source of Variation Degrees of Freedom Test Ratio Critical –Value at 5% p-value
Zone 5 1503.01 1.15 < 0.00001
State 30 615.05 18.5 < 0.00001
Within Units 191902 - -
Total 191937 - -
Table 3.12. CATANOVA Table for WAEC 2005
Source of Variation Degrees of Freedom Test Ratio Critical –Value at 5% p-value
Zone 5 1266.48 1.15 < 0.00001
State 30 897.48 18.5 < 0.00001
Within Units 203955 - -
Total 203990 - -
Table 3.13. CATANOVA Table for WAEC 2006
Source of Variation Degrees of Freedom Test Ratio Critical –Value at 5% p-value
Zone 5 782.51 1.15 < 0.00001
State 30 919.75 18.5 < 0.00001
Within Units 105464 - -
Total 105499 - -
Table 3.14. CATANOVA Table for WAEC 2007
Source of Variation Degrees of Freedom Test Ratio Critical –Value at 5% p-value
Zone 5 489.18 1.15 < 0.00001
State 30 335.57 18.5 < 0.00001
Within Units 98121 - -
Total 98156 - -
Table 3.15. CATANOVA Table for WAEC 2008
Source of Variation Degrees of Freedom Test Ratio Critical –Value at 5% p-value
Zone 5 541.19 1.15 < 0.00001
State 30 453.56 18.5 < 0.00001
Within Units 127111 - -
Total 127146 - -
Table 3.16. CATANOVA Table for WAEC 2009
Source of Variation Degrees of Freedom Test Ratio Critical –Value at 5% p-value
Zone 5 782.51 1.15 < 0.00001
State 30 919.75 18.5 < 0.00001
Within Units 37859 - -
Total 37894 - -
Table 3.17. CATANOVA Table for WAEC 2010
Source of Variation Degrees of Freedom Test Ratio Critical –Value at 5% p-value
Zone 5 1751 1.15 < 0.00001
State 30 70779 18.5 < 0.00001
Within Units 307287 - -
Total 307322 - -
Table 3.18. CATANOVA Table for WAEC (Duration-based)
Source of Variation Degrees of Freedom Test Ratio Critical –Value at 5% p-value
Zone 5 73997.52 1.15 < 0.00001
State 30 158297.52 18.5 < 0.00001
Within Units 1272063 - -
Total 1272098 - -
Table 3.19. CATANOVA Table for NECO (Duration-based)
Source of Variation Degrees of Freedom Test Ratio Critical –Value at 5% p-value
Zone 5 250943.03 1.15 < 0.00001
State 30 177780.34 18.5 < 0.00001
Within Units 1868863 - -
Total 1868898 - -
With reference to Appendices 1-4, the computational requirements for the nested data arrangements are summarized in CATANOVA Tables 3.3-3.19.
4. Discussion of Results
when an experimental situation requires that unique levels of one factor occur within each level of a second factor. Two-way nesting due to Onukogu (2014) was considered where Geopolitical Zone served as the main factor and State served as the sub-factor. In one instance, Gender was viewed as the “response” factor, having two levels. In another instance, “Duration of Examination” was viewed as the “response” factor, having eight levels. Six levels of Geopolitical Zone were considered. Although the States within each Geopolitical Zone are not constant, thus creating imbalance to sub-factor levels, an average of sub-factor levels was used throughout the research. It is assumed that for large sample size, the CATANOVA technique employed is robust against slight imbalance in sub-factor levels. In examining the performances in WAEC and NECO in relation to Geopolitical Zones and States within Zones, two aspects, namely, Gender-based assessment and Duration-based assessment were considered. The categorical data analysis revealed significant difference in the performance of students in WAEC and NECO within the Geo-political Zones (main factor) and the States (sub-factor). The p-value for each test revealed that the test
is significant at an Observed Significance Level (OSL) less than 0.00001. When sub-factor levels, nested within the main factor, are not constant, an average of sub-factor levels may be used in the analysis of the data having unbalanced structure, particularly if the sub-factor levels are not grossly different and if the sample size is large.
5. Conclusions
Frequency data are increasingly encountered in real-life situations. Unfortunately, some of such data have been erroneously analysed without the consciousness that there is no underlying metric with such data. Fortunately, attention is gradually being drawn to the need for methods of handling frequency (count, categorical or nominal) data. In this work, an application of categorical analysis of variance has been presented for data in nested arrangement, in view of establishing the significance of main factor and sub-factor effects. It provides a practical guide for determining the significance of categorical factors when data are in nested arrangements.
Appendix 1: Two-way Nested Classification for NECO (Gender-based)
NECO2003Z1 Z2
1 2 3 4 5 1 2 3 4 5 6
male 2209 1776 2508 3872 2826 13191 8218 4691 3779 6940 7700 13466 44794
female 2290 1839 2222 6161 3738 16250 9701 4320 2734 7099 6901 11953 42708
4499 3615 4730 10033 6564 17919 9011 6513 14039 14601 25419
total
29441 87502
Z3 Z4
1 2 3 4 5 6 1 2 3 4 5 6 7
male 2107 12064 8765 3803 4726 2793 34258 1393 5349 1329 165 1213 1630 252 11331
female 2160 11115 8059 2975 4530 2387 31226 241 3964 1010 186 411 55 621 6488
4267 23179 16824 6778 9256 5180 1634 9313 2339 351 1624 1685 873
Total
65844 17819
Z5 Z6 Total
1 2 3 4 5 6 1 2 3 4 5 6 7
male 373 721 1185 163 420 186 3048 5615 5232 8310 973 2096 2010 494 24730 131352
female 145 389 1013 108 190 16 1861 3599 3792 6814 557 1170 1371 259 17562 116095
518 1110 2198 271 610 202 9214 9024 15124 1530 3266 3381 753
Total
4909 42292 247447
2004 NECO
Z1 Z2
1 2 3 4 5 1 2 3 4 5 6
male 1801 1475 2479 3093 1753 10601 4398 1563 1957 6036 2635 9279 25868
female 2130 1699 2257 4281 2252 12619 5507 1639 1491 5998 2532 8301 25468
3931 3174 4736 7374 4005 9905 3202 3448 12034 5167 17580
Total
Z3 Z4
1 2 3 4 5 6 1 2 3 4 5 6 7
male 1699 7255 4403 2782 4959 3383 24481 982 2529 227 230 301 55 27 4351
female 1736 6681 4416 2395 4781 3167 23176 271 1815 117 380 193 78 26 2880
3435 13936 8819 5177 9740 6550 1253 4344 344 610 494 133 53
Total
47657 7231
Z5 Z6 Total
1 2 3 4 5 6 1 2 3 4 5 6 7
male 239 660 1248 171 370 74 2762 2907 1513 995 923 1022 594 520 8474 76537
female 132 205 838 30 180 34 1419 1802 1014 814 462 712 474 426 5704 71266
371 865 2086 201 550 108 4709 2527 1809 1385 1734 1068 946
total
4181 14178 147803
2005NECO
Total Z1 Z2
1 2 3 4 5 1 2 3 4 5 6
male 1019 615 1039 1456 624 4753 1365 672 931 2034 1591 6112 12705
female 1271 742 850 2215 779 5857 1535 461 747 2117 1387 5455 11702
2290 1357 1889 3671 1403 2904 1133 1678 4151 2978 11567
Total
10610 24411
Z3 Z4
1 2 3 4 5 6 1 2 3 4 5 6 7
male 1425 3973 1988 577 1898 2145 12006 2800 71 736 644 537 905 387 6080
female 1434 3848 1936 498 1872 1782 11370 349 81 492 179 347 365 245 2058
2859 7821 3924 1075 3770 3927 3149 152 1228 823 884 1270 632
total
23376 8138
Z5 Z6 Total
1 2 3 4 5 6 1 2 3 4 5 6 7
male 657 845 984 158 291 58 2993 1820 1443 1007 1693 566 595 374 7498 46035
female 311 358 902 75 125 38 1809 1028 1069 671 854 288 366 300 4576 37372
968 1203 1886 233 416 96 2848 2512 1678 2547 854 961 674
total
4802 12074 83411
2006 NECO
Z1 Z2
1 2 3 4 5 1 2 3 4 5 6
male 3465 2406 2802 4583 4100 17356 5199 1711 3619 5852 3772 8823 28976
female 3766 2604 2573 5827 5457 20227 5729 1629 2771 5840 3495 8197 27661
7231 5010 5375 10410 9557 10928 3340 6390 11692 7267 17020
Total
37583 56637
Z3 Z4
1 2 3 4 5 6 1 2 3 4 5 6 7
male 4035 8148 5792 3972 5888 6503 34338 2238 7557 2202 2285 1051 5459 673 21465
female 3828 8152 5623 2979 5396 5783 31761 335 5566 1246 856 307 2872 381 11563
7863 16300 11415 6951 11284 12286 2573 13123 3448 3141 1358 8331 1054
total
66099 33028
Z5 Z6 Total
1 2 3 4 5 6 1 2 3 4 5 6 7
male 1815 3328 2106 775 1651 989 10664 7928 6714 3514 5459 2213 2485 928 29241 142040
female 901 1501 1126 403 912 647 5490 5019 5431 2709 2872 1370 1727 779 19907 116609
2716 4829 3232 1178 2563 1636 12947 12145 6223 8331 3583 4212 1707
total
2007NECO
Z1 Z2
1 2 3 4 5 1 2 3 4 5 6
male 3892 3116 4218 5206 4913 21345 6739 3012 4693 7144 6558 11232 39378
female 4101 3463 3681 6567 6845 24657 7501 2688 3711 7072 6247 10686 37905
7993 6579 7899 11773 11758 14240 5700 8404 14216 12805 21918
Total
46002 77283
Z3 Z4
1 2 3 4 5 6 1 2 3 4 5 6 7
male 4817 11839 7572 4837 4030 8335 41430 2180 8048 4997 3875 1838 115 655 21708
female 4627 11480 7143 3754 3645 7502 38151 488 5465 2346 1419 584 35 571 10908
9444 23319 14715 8591 7675 15837 2668 13513 7343 5294 2422 150 1226
total
79581 32616
Z5 Z6 Total
1 2 3 4 5 6 1 2 3 4 5 6 7
male 1458 2471 1787 1063 1267 73 8119 8662 6972 5634 5806 3464 4397 1450 36385 147020
female 739 884 962 461 720 49 3815 5443 5332 4390 3719 2314 3328 1484 26010 116789
2197 3355 2749 1524 1987 122 14105 12304 10024 9525 5778 7725 2934
total
11934 62395 263809
2008NECO
Z1 Z2
1 2 3 4 5 1 2 3 4 5 6
male 4948 5948 9376 10399 6601 37272 12061 7250 5850 13359 11511 19661 69692
female 5947 6716 8812 13197 2426 37098 13199 5131 4655 12714 11590 17709 64998
10895 12664 18188 23596 9027 25260 12381 10505 26073 23101 37370
Total
74370 134690
Z3 Z4
1 2 3 4 5 6 1 2 3 4 5 6 7
male 7244 20889 11893 8684 11015 14810 74535 4877 19761 18801 10305 3661 2691 6601 66697
female 6522 20282 11323 7504 9708 421 55760 784 13745 7895 3755 1536 671 2426 30812
13766 41171 23216 16188 20723 15231 5661 33506 26696 14060 5197 3362 9027
total
130295 97509
Z5 Z6 Total
1 2 3 4 5 6 1 2 3 4 5 6 7
male 9676 10272 8973 9816 5229 3991 47957 19340 13684 6475 15893 9287 9072 2096 75847 372000
female 5689 4353 5849 4222 2379 1378 23870 12451 10391 4848 9008 5239 6973 1890 50800 263338
15365 14625 14822 14038 7608 5369 31791 24075 11323 24901 14526 16045 3986
total
71827 126647 635338
2009NECO
Z1 Z2
1 2 3 4 5 1 2 3 4 5 6
male 2347 1327 1125 1448 1762 8009 2463 1256 2337 5186 2566 5607 19415
female 3061 1621 1065 1680 2391 9818 2763 1143 2038 5148 2626 5392 19110
5408 2948 2190 3128 4153 5226 2399 4375 10334 5192 10999
Total
17827 38525
Z3 Z4
1 2 3 4 5 6 1 2 3 4 5 6 7
male 1071 10049 3554 1554 2241 3775 22244 42 2619 1065 997 67 168 119 5077
female 1212 10049 3554 1464 2146 3613 22038 20 2397 782 398 63 48 70 3778
2283 20098 7108 3018 4387 7388 62 5016 1847 1395 130 216 189
Total
Appendix 2: Two-way Nested Classification for WAEC (Gender-based)
Z5 Z6 Total
1 2 3 4 5 6 1 2 3 4 5 6 7
male 180 316 793 83 254 69 1695 2465 1688 794 927 1020 731 536 8161 64601
female 116 130 606 54 128 40 1074 1758 1406 757 590 572 536 432 6051 61869
296 446 1399 137 382 109 4223 3094 1551 1517 1592 1267 968
total
2769 14212 126470
2010Neco
Z1 Z2
1 2 3 4 5 1 2 3 4 5 6
male 2881 1062 799 1365 1796 7903 962 1434 1709 3060 2046 3966 13177
female 3413 1206 592 1695 2386 9292 957 1356 1476 3171 2142 3792 12894
6294 2268 1391 3060 4182 1919 2790 3185 6231 4188 7758
Total
17195 26071
Z3 Z4
1 2 3 4 5 6 1 2 3 4 5 6 7
male 874 6367 3186 1635 2002 3629 17693 536 2818 1230 367 283 263 102 5599
female 921 6893 3275 1452 1960 3677 18178 88 2218 720 206 197 130 132 3691
1795 13260 6461 3087 3962 7306 624 5036 1950 573 480 393 234
Total
35871 9290
Z5 Z6 Total
1 2 3 4 5 6 1 2 3 4 5 6 7
male 218 294 573 117 336 54 1592 2447 2242 651 1082 869 931 428 8650 54614
female 142 108 490 91 170 37 1038 1560 1700 610 571 749 697 388 6275 51368
360 402 1063 208 506 91 4007 3942 1261 1653 1618 1628 816
total
2630 14925 105982
WAEC2003
Z1 Z2
1 2 3 4 5 1 2 3 4 5 6
male 1545 1121 1427 2348 2790 9231 7092 2590 214 9232 2820 9307 31255
female 1728 1451 1120 3385 3349 11033 8641 2208 85 10553 2738 9382 33607
3273 2572 2547 5733 6139 15733 4798 299 19785 5558 18689
total
20264 64862
Z3 Z4
1 2 3 4 5 6 1 2 3 4 5 6 7
male 1010 23071 9874 4503 2821 1818 43097 152 1956 1547 105 139 159 481 4539
female 900 21830 9232 3564 2759 1599 39884 22 1548 1724 46 67 110 160 3677
1910 44901 19106 8067 5580 3417 174 3504 3271 151 206 269 641
Total
82981 8216
Z5 Z6 Total
1 2 3 4 5 6 1 2 3 4 5 6 7
male 125 2356 669 32 237 175 3594 3665 1657 2263 514 414 916 469 9898 101614
female 66 1885 629 21 169 67 2837 2525 1205 2152 412 257 690 254 7495 98533
191 4241 1298 53 406 242 6190 2862 4415 926 671 1606 723
Total
2004WAEC
Z1 Z2
1 2 3 4 5 1 2 3 4 5 6
male 2118 1992 1808 3097 3985 13000 6391 1289 116 11203 2643 9280 30922
femal 2443 2683 1771 4678 5102 16677 7639 1321 96 13151 2274 9274 33755
4561 4675 3579 7775 9087 14030 2610 212 24354 4917 18554
Total
29677 64677
Z3 Z4
1 2 3 4 5 6 1 2 3 4 5 6 7
male 1025 21894 3319 4757 1446 2901 35342 461 2795 1630 174 137 192 675 6064
female 913 21374 3056 3836 1378 2610 33167 126 2078 1494 68 136 166 505 4573
1938 43268 6375 8593 2824 5511 587 4873 3124 242 273 358 1180
total
68509 10637
Z5 Z6 Total
1 2 3 4 5 6 1 2 3 4 5 6 7
male 227 2010 635 63 133 153 3221 2571 1743 462 815 645 1024 459 7719 96268
female 131 1546 487 26 82 43 2315 1669 1323 351 440 446 675 279 5183 95670
358 3556 1122 89 215 196 4240 3066 813 1255 1091 1699 738
total
5536 12902 191938
2005WAEC
Z1 Z2
1 2 3 4 5 1 2 3 4 5 6
male 3220 2902 1575 3556 3828 15081 5264 1272 226 12628 2118 13080 34588
female 3684 3063 1356 4734 4401 17238 5841 1078 145 13271 1819 12611 34765
6904 5965 2931 8290 8229 11105 2350 371 25899 3937 25691
Total
32319 69353
Z3 Z4
1 2 3 4 5 6 1 2 3 4 5 6 7
male 1492 25904 2852 1847 1418 2288 35801 262 3413 2253 307 132 489 1319 8175
female 1279 26068 2665 1504 1327 2070 34913 255 2742 1835 127 91 205 282 5537
2771 51972 5517 3351 2745 4358 517 6155 4088 434 223 694 1601
total
70714 13713
Z5 Z6 Total
1 2 3 4 5 6 1 2 3 4 5 6 7
male 370 1600 825 73 334 203 3405 1903 2024 718 750 485 901 547 7328 104378
female 173 1189 608 37 153 67 2227 1113 1476 631 387 384 593 349 4933 99613
543 2789 1433 110 487 270 3016 3500 1349 1137 869 1494 896
total
5632 12261 203991
2006WAECZ1 Z2
1 2 3 4 5 1 2 3 4 5 6
male 1993 1216 404 1850 2373 7836 3974 111 260 8324 1573 8408 22650
female 1800 845 329 1607 2441 7022 3726 543 180 6084 1036 6217 17786
3793 2061 733 3457 4814 7700 654 440 14408 2609 14625
total
14858 40436
Z3 Z4
1 2 3 4 5 6 1 2 3 4 5 6 7
male 1370 11190 1966 1085 1448 1945 19004 176 2540 1266 194 22 52 427 4677
female 1071 7947 1462 742 1205 1494 13921 19 1531 820 100 16 17 132 2635
2441 19137 3428 1827 2653 3439 195 4071 2086 294 38 69 559
toal
Z5 Z6 Total
1 2 3 4 5 6 1 2 3 4 5 6 7
male 199 942 566 173 103 124 2107 996 961 449 587 603 593 523 4712 60986
female 119 501 337 51 34 39 1081 320 516 352 255 235 315 76 2069 44514
318 1443 903 224 137 163 1316 1477 801 842 838 908 599
total
3188 6781 105500
2007WAECZ1 Z2
1 2 3 4 5 1 2 3 4 5 6
male 2246 1308 745 1817 1134 7250 2687 504 169 8598 1810 8150 21918
female 2273 1132 568 1712 1365 7050 2644 355 102 7020 1329 6583 18033
4319 2440 1313 3529 2499 5331 859 271 15618 3139 14733
Total
14100 39951
Z3 Z4
1 2 3 4 5 6 1 2 3 4 5 6 7
male 1043 8502 1461 1575 971 1332 14884 65 2449 1291 426 42 135 252 4660
female 959 6188 1211 1236 842 990 11426 37 1689 857 265 13 18 130 3009
2002 14690 2672 2811 1813 2322 102 4138 2148 691 55 153 382
Total
26310 7669
Z5 Z6 Total
1 2 3 4 5 6 1 2 3 4 5 6 7
male 168 1355 384 70 202 181 2360 843 659 505 359 334 677 630 4007 55079
female 68 741 239 36 109 82 1275 324 419 424 195 187 384 452 2385 43178
236 2096 623 106 311 263 1167 1078 929 554 621 1061 1082
total
3635 6492 98157
2008WAECZ1 Z2
1 2 3 4 5 1 2 3 4 5 6
male 2868 2320 890 2874 1835 10787 4122 1496 242 10331 2741 9243 28175
female 2637 1830 736 2541 2063 9807 4073 1023 147 7832 1779 7393 22247
5505 4150 1626 5415 3898 8195 2519 389 18163 4520 16636
Total
20594 50422
Z3 Z4
1 2 3 4 5 6 1 2 3 4 5 6 7
male 797 11916 1917 1521 1295 1642 19088 70 2867 2065 532 75 104 311 6024
female 718 8792 1555 1171 1188 1262 14686 35 1934 1324 232 24 31 213 3793
1515 20708 3472 2692 2483 2904 105 4801 3389 764 99 135 524
33774 9817
Z5 Z6 Total
1 2 3 4 5 6 1 2 3 4 5 6 7
male 232 1145 472 75 211 125 2260 1316 1351 369 322 622 1001 803 5784 72118
female 104 619 335 49 85 65 1257 563 769 320 112 298 624 553 3239 55029
336 1764 807 124 296 190 1879 2120 689 434 920 1625 1356
total
3517 9023 127147
2009WAECZ1 Z2
1 2 3 4 5 1 2 3 4 5 6
male 254 131 28 64 114 591 1344 1413 75 2551 946 3786 10115
female 157 71 13 50 92 383 1266 830 36 1612 658 2980 7382
411 202 41 114 206 2610 2243 111 4163 1604 6766
Total
Appendix 3: Two-way Nested Classification for WAEC (Duration-based)
Z3 Z4
1 2 3 4 5 6 1 2 3 4 5 6 7
male 141 1592 545 406 183 118 2985 56 1827 299 175 110 99 217 2783
female 113 1112 485 367 180 121 2378 2 1286 219 63 20 4 101 1695
254 2704 1030 773 363 239 58 3113 518 238 130 103 318
total
5363 4478
Z5 Z6 Total
1 2 3 4 5 6 1 2 3 4 5 6 7
male 260 1573 269 28 436 107 2673 735 800 80 800 458 344 130 3347 22494
female 157 962 149 8 174 23 1473 454 639 89 372 206 186 144 2090 15401
417 2535 418 36 610 130 1189 1439 169 1172 664 530 274
total
4146 5437 37895
2010WAECZ1 Z2
1 2 3 4 5 1 2 3 4 5 6
male 8265 7908 2288 5206 4764 28431 4148 5542 3324 6568 6927 7270 33779
fmale 10019 10536 2183 6531 6064 35333 4493 4563 2989 7147 7138 7616 33946
18284 18444 4471 11737 10828 8641 10105 6313 13715 14065 14886
Total
63764 67725
Z3 Z4
1 2 3 4 5 6 1 2 3 4 5 6 7
male 3755 28485 6130 7849 3426 4917 54562 221 8840 2871 929 380 253 430 13924
female 3690 30478 6319 7149 3347 4653 55636 204 7514 2166 556 276 190 625 11531
7445 58963 12449 14998 6773 9570 425 16354 5037 1485 656 443 1055
total
110198 25455
Z5 Z6 Total
1 2 3 4 5 6 1 2 3 4 5 6 7
male 295 401 1401 84 795 67 3043 5444 4575 1034 3083 1490 2692 1496 19814 153553
female 227 344 1092 59 365 64 2151 3728 3705 1032 1963 1165 2181 1399 15173 153770
522 745 2493 143 1160 131 9172 8280 2066 5046 2655 4873 2895
total
5194 34987 307323
WAEC
Z1 Z2
yearly/per 1 2 3 4 5 1 2 3 4 5 6
2003 3273 2572 2547 5733 6139 20264 15733 4798 299 19785 5558 18689 64862
2004 4561 4675 3579 7775 9087 29677 14030 2610 212 24354 4917 18554 64677
2005 6904 5965 2931 8290 8229 32319 11105 2350 371 25899 3937 25691 69353
2006 3793 2061 733 3457 4814 14858 7700 654 440 14408 2609 14625 40436
2007 4319 2440 1313 3529 2499 14100 5331 859 271 15618 3139 14733 39951
2008 5505 4150 1626 5415 3898 20594 8195 2519 389 18163 4520 16636 50422
2009 411 202 41 114 206 974 2610 2243 111 4163 1604 6766 17497
2010 18284 18444 4471 11737 10828 63764 8641 10105 6313 13715 14065 14886 67725
47051 40511 17244 46054 45705 73346 26140 8409 136109 40354 130586
Total
Appendix 4: Two-way Nested Classification for NECO (Duration-based)
Z3 Z4
yearly 1 2 3 4 5 6 1 2 3 4 5 6 7
2003 1910 44901 19106 8067 5580 3417 82981 174 3504 3271 151 206 269 641 8216
2004 1938 43268 6375 8593 2824 5511 68509 587 4873 3124 242 273 358 1180 10637
2005 2771 51972 5517 3351 2745 4358 70714 517 6155 4088 434 223 694 1601 13712
2006 2441 19137 3428 1827 2653 3439 32925 195 4071 2086 294 38 69 559 7312
2007 2002 14690 2672 2811 1813 2322 26310 102 4138 2148 691 55 153 382 7669
2008 1515 20708 3472 2692 2483 2904 33774 105 4801 3389 764 99 135 524 9817
2009 254 2704 1030 773 363 239 5363 58 3113 518 238 130 103 318 4478
2010 7445 58963 12449 14998 6773 9570 110198 163 16354 5037 1485 656 443 1055 25193
20277 256345 54052 43116 25239 31766 1902 47011 23664 4303 1685 2230 6267
total
430774 87034
Z5 Z6 Total
yearly 1 2 3 4 5 6 1 2 3 4 5 6 7
2003 191 4241 1298 53 406 242 6431 6190 2862 4415 926 671 1606 723 17393 200147
2004 358 3556 1122 89 215 196 5536 4240 3066 813 1255 1091 1699 738 12902 191938
2005 543 2789 1433 110 487 270 5632 3016 3500 1349 1137 869 1494 896 12261 203991
2006 318 1443 903 224 137 163 3188 1316 1477 801 842 838 908 599 6781 105500
2007 236 2096 623 106 311 263 3635 1167 1078 929 554 621 1061 1082 6492 98157
2008 336 1764 807 124 296 190 3517 1879 2120 689 434 920 1625 1356 9023 127147
2009 417 2535 418 36 610 130 4146 1189 1439 169 1172 664 530 274 5437 37895
2010 522 745 2493 143 1160 131 5194 9172 8280 2066 5046 2655 4873 2895 34987 307061
2922 19171 9100 889 3627 1591 28170 23824 11234 11370 8334 13802 8570
total
37279 105276 1271836
NECO Z1 Z2
yearly/per 1 2 3 4 5 1 2 3 4 5 6
2003 4499 3615 4730 10033 6554 29431 17919 9011 6513 14039 14601 25419 87502
2004 3931 3174 4736 7374 4005 23220 9905 3202 3448 12034 5167 17580 51336
2005 2290 1357 1889 3671 1403 10610 2904 1133 1678 4151 2978 11567 24411
2006 7231 5010 5375 10410 9557 37583 10928 3340 6390 11692 7267 17020 56637
2007 7993 6579 7899 11773 11758 46002 14240 5700 8404 14216 12805 21918 77283
2008 10895 12664 18188 23596 9027 74370 25260 12381 10505 26073 23101 37370 134690
2009 5408 2948 2190 3128 4153 17827 5226 2399 4375 10334 5192 10999 38525
2010 6294 2268 1391 3060 4182 17195 1919 2790 3185 6231 4188 7758 26071
48541 37615 46398 73045 50639 88301 39956 44498 98770 75299 149631
Total
256238 496455
Z3 Z4
yearly 1 2 3 4 5 6 1 2 3 4 5 6 7
2003 4267 23179 16824 6778 9256 5180 65484 1634 9313 2339 351 1624 1685 873 17819
2004 3435 13936 8819 5177 9740 6550 47657 1253 4344 344 610 494 133 53 7231
2005 2859 7821 3924 1075 3770 3927 23376 3149 152 1228 823 884 1270 632 8138
2006 7863 16300 11415 6951 11284 12286 66099 2573 13123 3448 3141 1358 8331 1054 33028
2007 9444 23319 14715 8591 7675 15837 79581 2668 13513 7343 5294 2422 150 1226 32616
2008 13766 41171 23216 16188 20723 15231 130295 5661 33506 26696 14060 5197 3362 9027 97509
2009 2283 20098 7108 3018 4387 7388 44282 62 5016 1847 1395 130 216 189 8855
2010 1795 13260 6461 3087 3962 7306 35871 624 5036 1950 573 480 393 234 9290
45712 159084 92482 50865 70797 73705 17624 84003 45195 26247 12589 15540 13288
total
492645 214486
Z5 Z6 Total
yearly 1 2 3 4 5 6 1 2 3 4 5 6 7
2003 518 1110 2198 271 610 202 4909 9214 9024 15124 1530 3266 3381 753 42292 247437
2004 371 865 2086 201 550 108 4181 4709 2527 1809 1385 1734 1068 946 14178 147803
2005 968 1203 1886 233 416 96 4802 2848 2512 1678 2547 854 961 674 12074 83411
2006 2716 4829 3232 1178 2563 1636 16154 12947 12145 6223 8331 3583 4212 1707 49148 258649
2007 2197 3355 2749 1524 1987 122 11934 14105 12304 10024 9525 5778 7725 2934 62395 263809
2008 15365 14625 14822 14038 7608 5369 71827 31791 24075 11323 24901 14526 16045 3986 126647 635338
2009 296 446 1399 137 382 109 2769 4223 3094 1551 1517 1592 1267 968 14212 126470
2010 360 402 1063 208 506 91 2630 4007 3942 1261 1653 1618 1628 816 14925 105982
22791 26835 29435 17790 14622 7733 83844 69623 48993 51389 32951 36287 12784
total
REFERENCES
[1] Agresti, A. (2007). Categorical data analysis. New York: Wiley Interscience.
[2] Cochran W. G. (1940). The analysis of variances when experimental errors follow the Poisson or binomial laws. The Annals of Mathematical Statistics, II, 335-347.
[3] Cochran, W. G (1950). “The comparison of percentages in matched samples,” Biometrika, 37: 256-55.
[4] Dyke, G. V. and Patterson, H. D. (1952). Analysis of factorial arrangements when the data are proportions. Biometrics, 8, 1-12.
[5] Florian T. J. (2008). Categorical data analysis: Away from ANOVAs (transformation or not) and towards logit mixed models. Journals of memory and Language 59, 434-446. [6] Gart, J. J. and Zweifel, J. R. (1967). “On the bias of various
estimators of the logit and its variance with applications to quantal bioassay,” Biometrika, 52, 181-7.
[7] Light, R. J. and Margolin, B. H. (1971). An analysis of variance for categorical data. Journal of the American Statistical Association, 66: 534-544
[8] Onukogu, I. B. (1985a). Reasoning by Analogy from ANOVA to CATANOVA. Biom. Journal, 27: 839-849. [9] Onukogu, I. B. (1985b). An analysis of variance of nominal
data. Biom. Journal, 27: 375-383.
[10] Onukogu I. B. (2014). Analysis of variance of Categorical data-Nested Designs. Journal of Statistics: Advances in Theory and Aplications 12: 109-116.
[11] Rao, M. M. (1960). Some asymptotic results on transformations in the analysis of variance. ARL Technical Note. 60-126. Aerospace research laboratory, Wright-Patterson Air Force Base.
[12] Singh, B. (1996). On CATANOVA method for analysis of two-way classified nominal data. Sankhya, B58(3), 379-388. [13] Singh, B. (2004). CATANOVA for analysis of nominal data from Repeated Measures Design J.ind.Soc. Agril. Statist. 58(3): 257-268.
[14] Weiss, D. J. (2009). Nominal analysis of “variance” Behavior
Research Methods, 41(3), 901-908.
[15] Winer, B. J., Brown, D. R., and Michel, K. M. (1971).
Statistical principles in experimental design. New York: Graw-Hill.