INFORMATION PAPER NO. 24
FEBRUARY 2015
SUMMARY REPORT OF THE
UNESCO
The constitution of the United Nations Educational, Scientific and Cultural Organization (UNESCO) was adopted by 20 countries at the London Conference in November 1945 and entered into effect on 4 November 1946. The Organization currently has 195 Member States and 9 Associate Members.
The main objective of UNESCO is to contribute to peace and security in the world by promoting collaboration among nations through education, science, culture and communication in order to foster universal respect for justice, the rule of law, and the human rights and fundamental freedoms that are affirmed for the peoples of the world, without distinction of race, sex, language or religion, by the Charter of the United Nations.
To fulfil its mandate, UNESCO performs five principal functions: 1) prospective studies on education, science, culture and communication for tomorrow's world; 2) the advancement, transfer and sharing of knowledge through research, training and teaching activities; 3) standard-setting actions for the preparation and adoption of internal instruments and statutory recommendations; 4) expertise through technical cooperation to Member States for their development policies and projects; and 5) the exchange of specialized information.
UNESCO Institute for Statistics
The UNESCO Institute for Statistics (UIS) is the statistical office of UNESCO and is the UN depository for global statistics in the fields of education, science and technology, culture and communication.
The UIS was established in 1999. It was created to improve UNESCO's statistical programme and to develop and deliver the timely, accurate and policy-relevant statistics needed in today’s increasingly complex and rapidly changing social, political and economic environments.
This report was prepared by Luciana Marins, Assistant Programme Specialist, assisted by Oula Hajjar, Statistical Assistant, and reviewed by Martin Schaaper, Programme Specialist (UNESCO Institute for Statistics).
Published in 2015 by:
UNESCO Institute for Statistics P.O. Box 6128, Succursale Centre-Ville Montreal, Quebec H3C 3J7
Canada
Tel: +1 514-343-6880
Email: [email protected] http://www.uis.unesco.org
ISBN 978-92-9189-175-7 Ref: UIS/2015/COM/TD/2
http://dx.doi.org/10.15220/978-92-9189-175-7-en
© UNESCO-UIS 2015
This publication is available in Open Access under the Attribution-ShareAlike 3.0 IGO (CC-BY-SA 3.0 IGO) license
(http://creativecommons.org/licenses/by-sa/3.0/igo/). By using the content of this publication, the users accept to be bound by the terms of use of the UNESCO Open Access Repository (http://www.unesco.org/open-access/terms-use-ccbysa-en).
Acknowledgements
Country and region codes
ARG Argentina
AUS Australia
AUT Austria
BLR Belarus
BEL Belgium
BRA Brazil
BUL Bulgaria
CAN Canada
CHN China
HKG China, Hong Kong Special Administrative Region (China, Hong Kong)
COL Colombia
CRI Costa Rica
CRO Croatia
CUB Cuba
CYP Cyprus
CZE Czech Republic
DNK Denmark
ECU Ecuador
EGY Egypt
SLV El Salvador
EST Estonia
FIN Finland
FRA France
DEU Germany
GHA Ghana
HUN Hungary
ISL Iceland
IND India
IDN Indonesia
IRL Ireland
ISR Israel
ITA Italy
JPN Japan
KAZ Kazakhstan
KEN Kenya
LVA Latvia
LTU Lithuania
LUX Luxembourg
MYS Malaysia
MLT Malta
MEX Mexico
MAR Morocco
NLD Netherlands
NZL New Zealand
NIG Nigeria
NOR Norway
PRT Portugal
KOR Republic of Korea (Korea, Rep.)
ROM Romania
RUS Russian Federation
SRB Serbia
SVK Slovakia
SVN Slovenia
ZAF South Africa
ESP Spain
SWE Sweden
TUR Turkey
UGA Uganda
UKR Ukraine
GBR United Kingdom of Great Britain and Northern Ireland (United Kingdom) TZA United Republic of Tanzania
Table of contents
Page
Acknowledgements ... iii
Country and region codes ... iv
Section 1. The 2013 UIS innovation data collection ... 8
Section 2. Innovation rates ... 9
2.1 Types of innovators ... 9
2.2 Innovation-active and innovative firms ... 11
Section 3. Innovation activities ... 15
Section 4. Linkages ... 17
4.1 Sources of information ... 17
4.2 Cooperation ... 19
Section 5. Hampering factors ... 22
5.1 Hampering factors for innovation-active firms ... 22
5.2 Hampering factors for non-innovative firms ... 24
Section 6. Final remarks ... 26
Annex I. Notes ... 27
Annex II. Methodological procedures of the national innovation surveys ... 28
Section 1.
The 2013 UIS innovation data collection
The key role that innovation plays in the process of economic growth and development has been widely recognised and discussed. In order to design and implement adequate industrial and innovation policies, policymakers need to have the appropriate data in hand. Unfortunately, this is not always the case. Despite efforts over the last two decades to standardise innovation definitions and indicators, it remains a challenge to understand and measure innovation, as well as produce innovation indicators, at both national and international levels.
The UNESCO Institute for Statistics (UIS) is committed to increasing the availability of timely, accurate and policy-relevant statistics in the field of science, technology and innovation (STI). For this purpose, in 2013 the UIS launched its first global innovation data collection. Country-level data covering innovation in manufacturing were gathered in order to produce a set of indicators on the types of innovation implemented by firms, the activities and linkages that they made use of, as well as the obstacles they faced when trying to innovate.
This was the first time that a dataset with innovation indicators was produced and made publicly available – not just by the UIS but by organizations worldwide – for countries at different stages of development. In addition to the innovation indicators, details on the methodological procedures of the national surveys of the 65 countries can also be found in the UIS Data Centre1.
This report presents the main results of the 2013 UIS innovation data collection. For analytical purposes, countries are arranged into two groups according to their income levels2, namely: i) high-income countries; and ii) low- and middle-income countries.
Lastly, it is worth stressing that instead of comparing countries in a ‘most or least, best or worst’ ranking fashion, this report seeks to identify trends, common features or dissimilarities presented by firms in countries with different levels of income when undertaking innovative efforts (see also Box 1).
Box 1. Methodological procedures of the national surveys and international comparisons
The main purpose of the Oslo Manual is to provide the methodological guidelines for the collection and interpretation of innovation data that are reliable and internationally comparable. Despite the existence of the Oslo Manual for more than 20 years, innovation statistics are not fully harmonised at the international level, as countries do not always adopt exactly the same methodological procedures to carry out their national innovation surveys.
In the UIS innovation data collection in 2013, countries were asked to report data only for manufacturing. This was a deliberate choice that aimed to foster comparability, as customarily manufacturing industries are fully – or at least almost fully – covered in innovation surveys. In practice, however, not all countries were able to supply data that solely and fully covered manufacturing. There were cases where the data in addition to manufacturing covered other industries – such as mining, construction and services – and others where the manufacturing industries were partially covered. Another issue that hinders comparability is the fact that not all the countries were able to produce estimations. This means that for such countries the indicators produced do not represent the whole national manufacturing industry. They only refer to the firms that replied to the national innovation survey.
Detailed information on the methodological procedures of the national surveys can be found in Annex II.
Section 2.
Innovation rates
Guidelines to measure product innovation and process innovation have been part of the scope of the Oslo Manual since its first edition (OECD, 1992). The most recent edition of the manual (OECD and Eurostat, 2005) also covers two other types of innovation, namely organizational and marketing innovation.
Definition
An innovation is the implementation of a new or significantly improved product (good or service), or process, a new marketing method, or a new organizational method in business practices, workplace organization or external relations. A common feature of an innovation is that it must have been implemented. A new or improved product is implemented when it is introduced on the market. New processes, marketing methods or organizational methods are implemented when they are brought into actual use in the firm’s operations (Oslo Manual §37, 146).
An innovation does not need to be commercially successful: a new product may not sell as much as expected and can turn out to be a commercial failure.
Until the publication of the third edition of the Oslo Manual, the term technological innovation was used to refer to product and process innovation, while non-technological innovation would relate to organizational and marketing innovations. In addition to including these two types of innovations in its scope, the updated manual has eliminated this distinction, particularly to avoid a narrow interpretation of the word ‘technological’ by firms from the services sector. However, still ten years after the third edition was published, the misuse of this nomenclature is recurrent.
This section presents innovation rates of countries. Firstly, these rates are presented for each one of the four types of innovation. Subsequently, the discussion is narrowed to indicators related to product and process innovation, regardless of organizational or marketing innovation.
2.1 Types of innovators
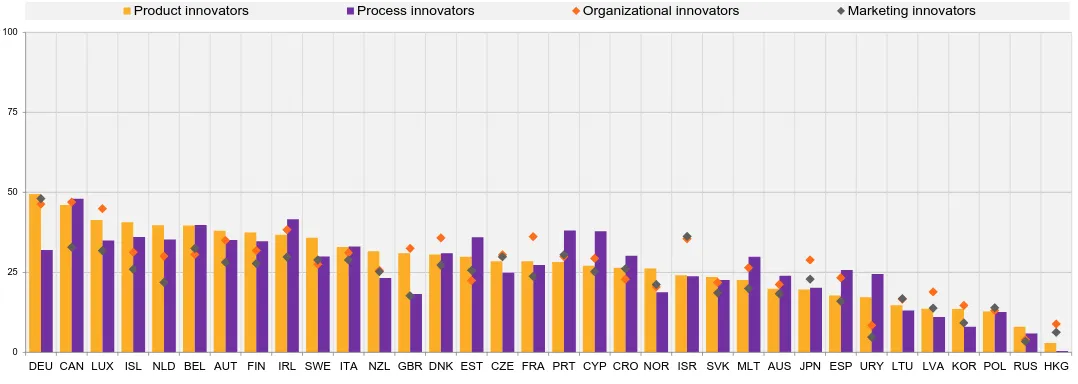
Figure 1 illustrates the shares of manufacturing firms that implemented the four types of innovation in high-income countries. Process innovation prevails with the highest shares of innovators in 12 out of 34 countries – including Canada (48%) and Ireland (41.6%). Product innovation appears in second place, prevailing in ten high-income countries as the type of innovation that was implemented by most firms. This was, for example, observed in Germany, where 49.5% of the manufacturing firms were product innovators.
Definitions
Product innovation is the implementation of a good or service that is new or significantly improved with respect to its characteristics or intended uses. This includes significant improvements in technical specifications, components and materials, incorporated software, user friendliness, or other functional characteristics (Oslo Manual §156). Firms that implemented at least one product innovation are product innovators.
Process innovation is the implementation of a new or significantly improved production or delivery method. This includes significant changes in techniques, equipment and/or software (Oslo Manual §163). Firms that implemented at least one process innovation are process innovators.
Organizational innovation is the implementation of a new organizational method in the firm’s business practices, workplace organization or external relations (Oslo Manual §177). Firms that implemented at least one organizational innovation are organizational innovators.
Marketing innovation is the implementation of a new marketing method involving significant changes in product design or packaging, product placement, product promotion, or pricing (Oslo Manual §169). Firms that implemented at least one marketing innovation are marketing innovators.
Figure 1. Innovators in high-income countries(as a percentage of manufacturing firms)
Notes: Please consult Annexes I and II.
Source: 2013 UIS innovation data collection and Eurostat
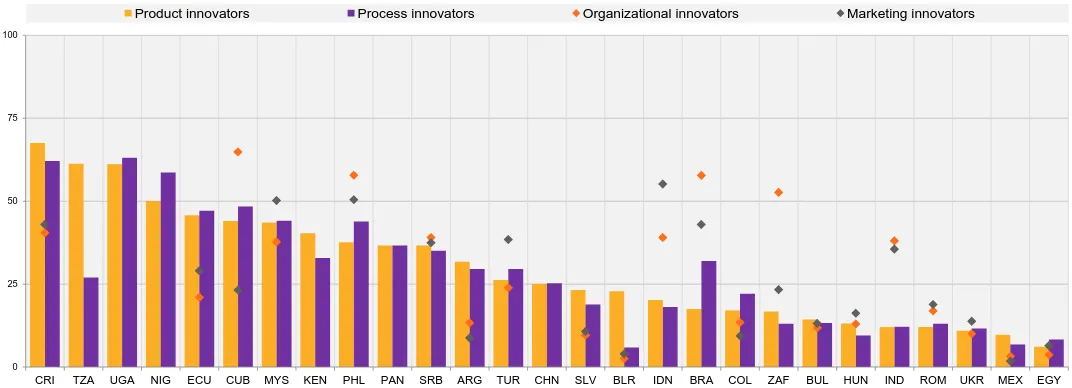
The shares of innovators in low- and middle-income countries are shown in Figure 2. In this group, product innovation leads the way in 9 out of 27 countries. This is the case in Costa Rica (67.5%), for example. Process innovation is implemented by most firms in 7 countries, including Uganda (63.1%) and Nigeria (58.6%).
0 25 50 75 100
DEU CAN LUX ISL NLD BEL AUT FIN IRL SWE ITA NZL GBR DNK EST CZE FRA PRT CYP CRO NOR ISR SVK MLT AUS JPN ESP URY LTU LVA KOR POL RUS HKG
In relative terms, there are more countries where firms mostly implemented marketing innovation. It is important to note, however, the number of countries without data on organizational and marketing innovation. There seems to be two main reasons for this. The first one is the low quality and reliability of the data, which impede their dissemination, while the second is due to the fact that when conducting an innovation survey for the first time some countries prefer to leave these two types of innovation out of the survey scope, mainly because of their complexity and subjectivity.
Figure 2. Innovators in low- and middle-income countries (as a percentage of manufacturing firms)
Notes: Please consult Annexes I and II.
Source: 2013 UIS innovation data collection, Eurostat and AU/NEPAD
2.2 Innovation-active and innovative firms
There are a few basic indicators3 on innovation that are often used along with the indicators on the share of innovators. Mainly they refer to the combination of firms that implemented more than one type of innovation or had abandoned or ongoing innovation activities. In this report, two basic indicators are examined: the percentage of innovative firms and the percentage of innovation-active firms. At times, these indicators can cover the four types of innovation. However, it is common practice – particularly in regard to the latter – to cover only product or process innovation, as is done in this report.
Henceforth, this report will focus on product and process innovation, regardless of organizational or marketing innovation. Despite the formal measurement of four types of innovation, most of the innovation indicators traditionally cover product and process innovations and subjects related to their development and implementation. This is mainly attributable to the fact that organizational and marketing innovations were out of the measurement scope of previous editions of the Oslo Manual.
3
Contrary to research and experimental development (R&D) indicators, a flagship innovation indicator has not been established yet, despite the existence of methodological guidelines for more than 20 years.
0 25 50 75 100
CRI TZA UGA NIG ECU CUB MYS KEN PHL PAN SRB ARG TUR CHN SLV BLR IDN BRA COL ZAF BUL HUN IND ROM UKR MEX EGY
Definitions
Innovation-active firms are those that implemented product or process innovations or had abandoned or ongoing innovation activities to develop product or process innovations. Innovative firms, in turn, only include those firms that really implemented product or process innovations.
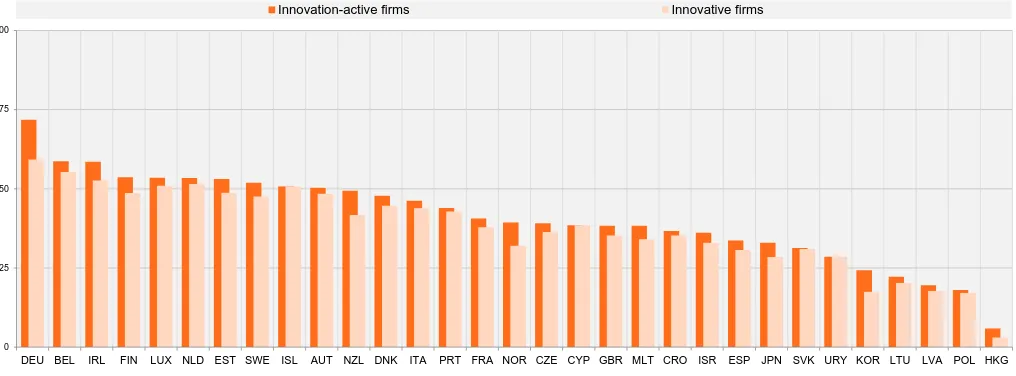
Figures 3 and 4 present the shares of product or process innovation-active and innovative firms in high- and low- and middle-income countries, respectively. In these figures, the difference between the darker and lighter bars is the share of firms that only had abandoned or ongoing innovation activities.
In the group of high-income countries, not many gaps are observed between the two bars. There is only one country, Germany, where the percentage of innovation-active firms includes more than 10% of firms with abandoned or ongoing innovation activities. From the share of 71.8% innovation-active firms, around 12.5% correspond to firms that only had abandoned or ongoing innovation activities. This means that 59.3% of firms in fact implemented product or process innovations.
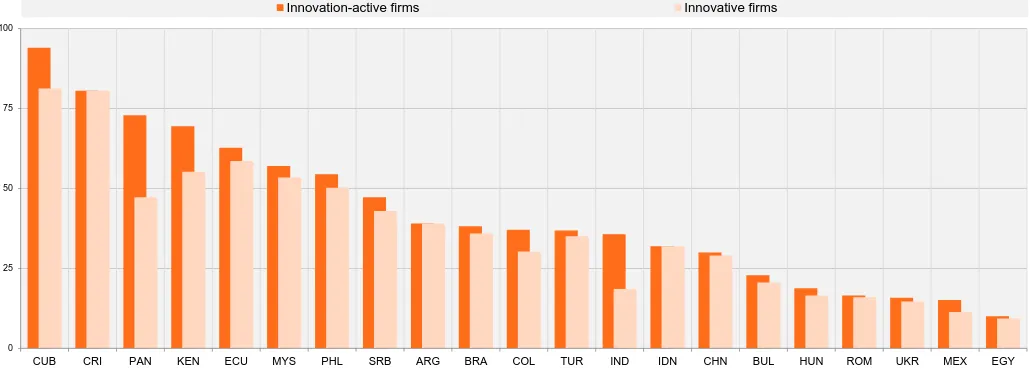
When it comes to low- and middle-income countries, there are four cases where the participation of firms with only abandoned or ongoing innovation activities in the composition of the rate of innovation-active firms is higher than 10%. For example, in Panama 72.9% of innovation-active firms includes 25.6% of firms with only abandoned or ongoing innovation activities. This gives the country a share of 47.3% firms that were actually innovative.
Figure 3. Innovation-active and innovative firms in high-income countries (as a percentage of manufacturing firms)
Notes: Please consult Annexes I and II.
Source: 2013 UIS innovation data collection and Eurostat
0 25 50 75 100
DEU BEL IRL FIN LUX NLD EST SWE ISL AUT NZL DNK ITA PRT FRA NOR CZE CYP GBR MLT CRO ISR ESP JPN SVK URY KOR LTU LVA POL HKG
Figure 4. Innovation-active and innovative firms in low- and middle-income countries (as a percentage of manufacturing firms)
Notes: Please consult Annexes I and II.
Source: 2013 UIS innovation data collection and Eurostat
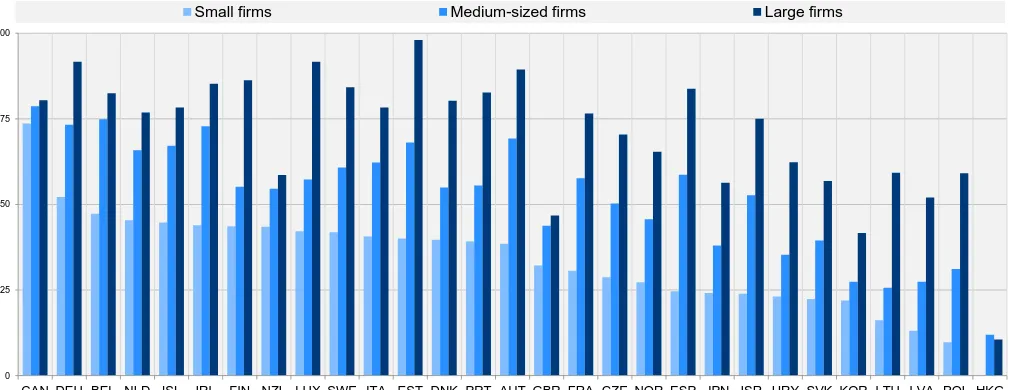
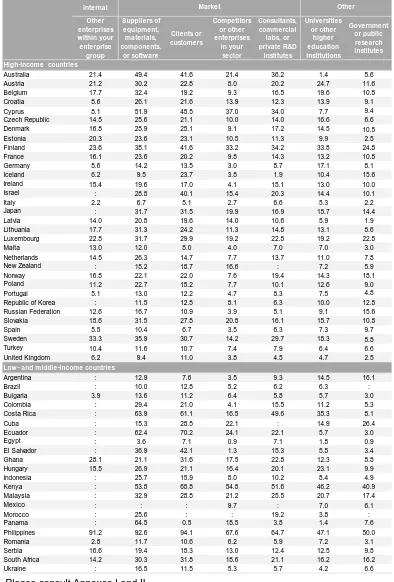
Since the size of a firm is indicative in innovation, size breakdowns are another important component to cover when producing business innovation indicators. The shares of product or process innovative firms by size class are illustrated in Figures 5 and 6 for high-, low- and middle-income countries. Overall, larger manufacturing firms tend to present higher rates of innovation.
In the group of high-income countries, the share of innovators in large firms is above 50% in 26 out of the 29 countries for which this breakdown is available. The exceptions are the United Kingdom (46.8%), the Republic of Korea (41.7%) and Hong Kong Special Administrative Region of China (10.5%). In fact, there are 17 high-income countries where more than 75% of large firms implemented product or process innovations. In low- and middle-income countries, a higher concentration of innovative firms is also observed. The difference is that there is only one country where the share of large innovative firms surpasses 75%, Costa Rica at 75.9%.
Lastly, it is important to highlight the fact that product or process innovations are basically present in all countries, regardless of the size class analysed. The only economy where a deviation is observed is in Hong Kong Special Administrative Region of China where only 0.1% of small firms were innovative in terms of product or process.
0 25 50 75 100
CUB CRI PAN KEN ECU MYS PHL SRB ARG BRA COL TUR IND IDN CHN BUL HUN ROM UKR MEX EGY
Figure 5. Innovative firms in high-income countries by size class (as a percentage of manufacturing firms in each size class)
Notes: Please consult Annexes I and II.
Source: 2013 UIS innovation data collection and Eurostat
Figure 6. Innovative firms in low- and middle-income countries by size class (as a percentage of manufacturing firms in each size class)
Notes: Please consult Annexes I and II.
Source: 2013 UIS innovation data collection and Eurostat
0 25 50 75 100
CAN DEU BEL NLD ISL IRL FIN NZL LUX SWE ITA EST DNK PRT AUT GBR FRA CZE NOR ESP JPN ISR URY SVK KOR LTU LVA POL HKG
Small firms Medium-sized firms Large firms
0 25 50 75 100
CRI ECU PHL MYS SRB TUR ARG COL IND ZAF ROM HUN MEX UKR EGY
Section 3.
Innovation activities
There is a difference between implementing an innovation and engaging in innovation activities. The former represents either the introduction of a new or significantly improved product on the market or the actual use of new or significantly improved processes and new organizational and marketing methods in the firm’s operations. The latter, in turn, refers to steps taken by firms with the aim of implementing an innovation. Innovation activities include: intramural R&D; extramural R&D; acquisition of machinery, equipment and software; acquisition of other external knowledge; training; market introduction of innovations; and other preparations.
Definition
Innovation activities are all scientific, technological, organizational, financial and commercial steps which actually lead, or are intended to lead, to the implementation of innovations. Some innovation activities are themselves innovative, others are not novel activities but are necessary for the implementation of innovations. Innovation activities also include R&D that is not directly related to the development of a specific innovation (Oslo Manual §149).
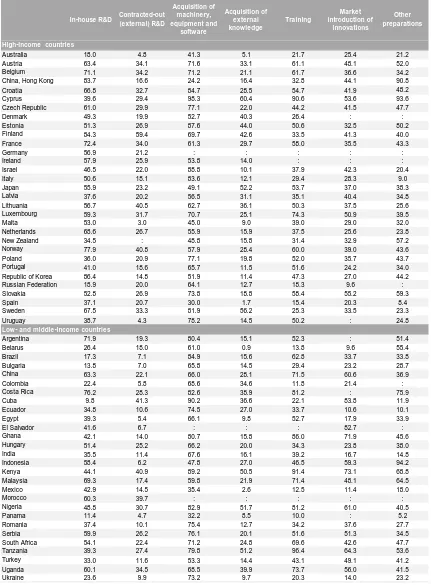
In national innovation surveys, questions about innovation activities are usually addressed to product or process innovation-active firms. In some countries, however, all innovators respond to the questions4. Table 1 presents the percentage of innovation-active manufacturing firms that engaged in different types of innovation activities.
The predominant innovation activity in 58% of high-income countries is the acquisition of machinery, equipment and software. The share of firms that engaged in such activity varies from 24.2% in Hong Kong Special Administrative Region of China to 98.3% in Cyprus. Internal R&D prevails as the activity performed by most of the innovation-active firms in 32% of these countries. In the Republic of Korea, for instance, 86.4% of firms were internal R&D performers. In contrast, the acquisition of other external knowledge presented the lowest shares of engagement in 55% of high-income countries. In Spain, for instance, only 1.7% of the innovation-active firms engaged in such activity.
In the group of low- and middle-income countries, the predominant innovation activity is also the acquisition of machinery, equipment and software, with 64% of countries having the highest shares of firms engaging in this activity. There are only three countries in this group with the shares of firms performing this activity being lower than 50%. Another interesting finding is that training for innovation prevails in four African countries: Tanzania (96.4%), Kenya (91.4%), Ghana (86%) and Uganda (73.7%). External R&D, conversely, was the activity that presented the lowest shares of engagement in 71% of these countries. Cuba has a much higher share of firms that contracted out R&D (41.3%) than those that performed it internally (9.8%).
4
Table 1. Firms that engaged in innovation activities (as a percentage of innovation-active manufacturing firms)
In-house R&D Contracted-out (external) R&D Acquisition of machinery, equipment and software Acquisition of external knowledge Training Market introduction of innovations Other preparations
Australia 18.0 4.8 41.3 5.1 21.7 25.4 21.2
Austria 63.4 34.1 71.6 33.1 61.1 48.1 52.0
Belgium 71.1 34.2 71.2 21.1 61.7 36.6 34.2
China, Hong Kong 83.7 16.6 24.2 16.4 32.8 44.1 90.8
Croatia 66.8 32.7 84.7 28.5 54.7 41.9 48.2
Cyprus 39.6 29.4 98.3 60.4 90.6 53.6 93.6
Czech Republic 61.0 29.9 77.1 22.0 44.2 41.5 47.7
Denmark 49.3 19.9 52.7 40.3 26.4 : :
Estonia 51.3 26.9 87.6 44.0 50.6 32.5 80.2
Finland 84.3 59.4 69.7 42.6 33.5 41.3 40.0
France 72.4 34.0 61.3 29.7 58.0 35.5 43.3
Germany 56.9 21.2 : : : : :
Ireland 57.9 25.9 53.8 14.0 : : :
Israel 46.5 22.0 88.8 10.1 37.9 42.3 20.4
Italy 50.6 18.1 83.6 12.1 29.4 28.3 9.0
Japan 55.9 23.2 49.1 52.2 53.7 37.0 38.3
Latvia 37.6 20.2 56.5 31.1 35.1 40.4 34.8
Lithuania 56.7 40.5 62.7 36.1 50.3 37.5 25.6
Luxembourg 59.3 31.7 70.7 25.1 74.3 50.9 39.5
Malta 53.0 3.0 45.0 9.0 39.0 29.0 32.0
Netherlands 68.6 26.7 55.9 15.9 37.5 25.6 23.8
New Zealand 34.5 : 48.8 15.8 31.4 32.9 57.2
Norway 77.9 40.8 57.9 28.4 60.0 39.0 43.6
Poland 36.0 20.9 77.1 19.8 52.0 35.7 43.7
Portugal 41.0 18.6 65.7 11.5 51.6 24.2 34.0
Republic of Korea 86.4 14.8 51.9 11.4 47.3 27.0 44.2 Russian Federation 18.9 20.0 64.1 12.7 18.3 9.6 :
Slovakia 52.8 26.9 73.8 18.8 58.4 55.2 59.3
Spain 37.1 20.7 30.0 1.7 15.4 20.3 8.4
Sweden 67.5 33.3 81.9 56.2 25.3 33.5 23.3
Uruguay 38.7 4.3 78.2 14.5 50.2 : 24.8
Argentina 71.9 19.3 80.4 15.1 52.3 : 51.4
Belarus 26.4 18.0 61.0 0.9 13.8 9.6 55.4
Brazil 17.3 7.1 84.9 15.6 62.8 33.7 33.8
Bulgaria 13.8 7.0 65.8 14.5 29.4 23.2 28.7
China 63.3 22.1 66.0 28.1 71.5 60.6 36.9
Colombia 22.4 5.8 68.6 34.6 11.8 21.4 :
Costa Rica 76.2 28.3 82.6 38.9 81.2 : 75.9
Cuba 9.8 41.3 90.2 36.6 22.1 83.8 11.9
Ecuador 34.8 10.6 74.5 27.0 33.7 10.6 10.1
Egypt 39.3 5.4 66.1 9.8 52.7 17.9 33.9
El Salvador 41.6 6.7 : : : 82.7 :
Ghana 42.1 14.0 80.7 15.8 86.0 71.9 45.6
Hungary 51.4 25.2 66.2 20.0 34.3 23.8 38.0
India 35.5 11.4 67.6 16.1 39.2 16.7 14.8
Indonesia 58.4 6.2 47.8 27.0 46.5 59.3 94.2
Kenya 44.1 40.9 89.2 50.5 91.4 73.1 68.8
Malaysia 69.3 17.4 59.8 21.9 71.4 48.1 64.5
Mexico 42.9 14.5 35.4 2.6 12.5 11.4 18.0
Morocco 60.3 39.7 : : : : :
Nigeria 48.8 30.7 82.9 51.7 81.2 61.0 40.5
Panama 11.4 4.7 32.2 8.5 10.0 : 5.2
Romania 37.4 10.1 75.4 12.7 34.2 37.6 27.7
Serbia 59.9 26.2 76.1 20.1 51.6 51.3 34.5
South Africa 54.1 22.4 71.2 24.8 69.6 42.6 47.7
Tanzania 39.3 27.4 79.8 51.2 96.4 64.3 53.6
Turkey 33.0 11.6 53.3 14.4 43.1 49.1 41.2
Uganda 60.1 34.5 68.5 39.9 73.7 56.0 41.5
High-income countries
Section 4.
Linkages
The guidelines of the Oslo Manual place business firms – active in manufacturing, primary industries or the services sector – in the centre of the innovation measurement framework. This by no means suggests that firms are alone when innovating. On the contrary, innovation is an interactive process and the innovation activities of firms may rely on their linkages with other sources of knowledge.
Linkages are sources of knowledge and technology, ranging from passive sources of information to suppliers of embodied and disembodied knowledge and technology to cooperative partnerships. Each linkage connects the firm to other agents in the innovation system: government laboratories, universities, policy departments, regulators, competitors, suppliers and customers (Oslo Manual §252-254).
From a policymaking perspective, it is therefore important to clearly identify the linkages that firms rely on to foster innovation. Innovation surveys usually try to measure two types of linkages: sources of information and cooperation.
4.1 Sources of information
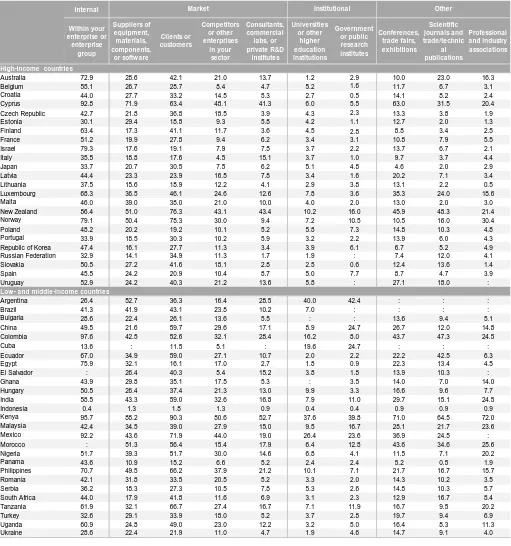
Table 2 presents the sources of information that are rated as ‘highly important’ for innovation by innovation-active firms. Internal sources of information are most frequently rated as highly important by firms from both groups of countries.
Definition
The innovative activities of a firm partly depend on the variety and structure of its links to sources of information, knowledge, technologies, practices, and human and financial resources (Oslo Manual §252). Sources of information are the sources that provide information for new innovation projects or contribute to the completion of existing innovation projects.
The enterprise or enterprise group is the source of information most frequently rated as highly important for 96% of high-income countries. Only one country in this group has a predominance of another source of information – in the Russian Federation, 34.9% of firms rated clients or customers as highly important sources. Even in this case, the share is just marginally higher – around 2 percentage points.
Table 2. Firms that rated sources of information as highly important(as a percentage of innovation-active manufacturing firms)
Notes: Please consult Annexes I and II. “:” Not available.
Source: 2013 UIS innovation data collection, Eurostat and AU/NEPAD Internal Within your enterprise or enterprise group Suppliers of equipment, materials, components, or software Clients or customers Competitors or other enterprises in your sector Consultants, commercial labs, or private R&D institutes Universities or other higher education institutions Government or public research institutes Conferences, trade fairs, exhibitions Scientific journals and trade/technic al publications Professional and industry associations
Australia 72.9 28.6 42.1 21.0 13.7 1.2 2.9 10.0 23.0 16.3
Belgium 55.1 26.7 28.7 8.4 4.7 5.2 1.6 11.7 6.7 3.1
Croatia 44.0 27.7 33.2 14.5 5.3 2.7 0.5 14.1 8.2 2.4
Cyprus 92.8 71.9 63.4 48.1 41.3 6.0 5.5 63.0 31.5 20.4
Czech Republic 42.7 21.8 36.8 18.5 3.9 4.3 2.3 13.3 3.8 1.9
Estonia 30.1 29.4 18.8 9.3 5.8 4.2 1.1 12.7 2.0 1.3
Finland 63.4 17.3 41.1 11.7 3.6 4.5 2.8 8.8 3.4 2.5
France 51.2 19.9 27.8 9.4 6.2 3.4 3.1 10.8 7.9 5.5
Israel 79.3 17.6 19.1 7.9 7.5 3.7 2.2 13.7 6.7 2.1
Italy 35.5 18.8 17.6 4.5 15.1 3.7 1.0 9.7 3.7 4.4
Japan 33.7 20.7 30.5 7.5 6.2 5.1 4.8 4.6 2.0 2.9
Latvia 44.4 23.3 23.9 16.5 7.8 3.4 1.6 20.2 7.1 3.4
Lithuania 37.5 15.6 18.9 12.2 4.1 2.9 3.8 13.1 2.2 0.5
Luxembourg 68.3 36.5 46.1 24.6 12.6 7.8 3.6 38.3 24.0 18.6
Malta 46.0 39.0 38.0 21.0 10.0 4.0 2.0 13.0 2.0 3.0
New Zealand 86.4 51.0 76.3 43.1 43.4 10.2 16.0 45.9 48.3 21.4
Norway 79.1 50.4 78.3 30.0 9.4 7.2 10.5 10.5 16.0 30.4
Poland 48.2 20.2 19.2 10.1 5.2 5.8 7.3 14.8 10.3 4.8
Portugal 33.9 18.5 30.3 10.2 5.9 3.2 2.2 13.9 6.0 4.3
Republic of Korea 47.4 16.1 27.7 11.3 3.4 3.9 6.1 6.7 5.2 4.9 Russian Federation 32.9 14.1 34.9 11.3 1.7 1.9 : 7.4 12.0 4.1
Slovakia 50.5 27.2 41.6 18.1 2.8 2.5 0.6 12.4 13.6 1.4
Spain 45.5 24.2 20.9 10.4 8.7 5.0 7.7 8.7 4.7 3.9
Uruguay 52.9 24.2 40.3 21.2 13.6 5.8 : 27.1 18.0 :
Argentina 26.4 52.7 36.3 16.4 28.5 40.0 42.4 : : :
Brazil 41.3 41.9 43.1 23.8 10.2 7.0 : : : :
Bulgaria 28.6 22.4 26.1 13.6 5.5 : : 13.6 9.4 5.1
China 49.5 21.6 59.7 29.6 17.1 8.9 24.7 26.7 12.0 14.8
Colombia 97.6 42.5 52.6 32.1 28.4 16.2 8.0 43.7 47.3 24.5
Cuba 13.6 : 11.5 5.1 : 19.6 24.7 : : :
Ecuador 67.0 34.9 59.0 27.1 10.7 2.0 2.2 22.2 42.5 6.3
Egypt 75.9 32.1 16.1 17.0 2.7 1.8 0.9 22.3 13.4 4.5
El Salvador : 26.4 40.3 5.4 15.2 3.8 1.8 13.9 10.3 :
Ghana 43.9 29.8 35.1 17.5 5.3 : 3.5 14.0 7.0 14.0
Hungary 50.5 26.4 37.4 21.3 13.0 9.9 3.3 16.6 9.6 7.7
India 58.5 43.3 59.0 32.6 16.8 7.9 11.0 29.7 15.1 24.5
Indonesia 0.4 1.3 1.8 1.3 0.9 0.4 0.4 0.9 0.9 0.9
Kenya 95.7 88.2 90.3 80.6 52.7 37.6 39.8 71.0 64.5 72.0
Malaysia 42.4 34.5 39.0 27.9 15.0 9.5 16.7 28.1 21.7 23.6
Mexico 92.2 43.6 71.9 44.0 19.0 26.4 23.6 36.9 24.5 :
Morocco : 51.3 56.4 15.4 17.9 6.4 12.8 43.6 34.6 25.6
Nigeria 51.7 39.3 51.7 30.0 14.6 6.8 4.1 11.5 7.1 20.2
Panama 43.6 10.9 15.2 6.6 5.2 2.4 2.4 5.2 0.5 1.9
Philippines 70.7 49.5 66.2 37.9 21.2 10.1 7.1 21.7 16.7 15.7
Romania 42.1 31.8 33.5 20.5 5.2 3.3 2.0 14.3 10.2 3.5
Serbia 36.2 18.3 27.3 10.5 7.8 5.3 2.6 14.8 10.3 5.7
South Africa 44.0 17.9 41.8 11.6 6.9 3.1 2.3 12.9 16.7 8.4
Tanzania 61.9 32.1 66.7 27.4 16.7 7.1 11.9 16.7 9.5 20.2
Turkey 32.6 29.1 33.9 18.0 5.2 3.7 2.8 19.7 9.4 6.9
Uganda 60.9 24.8 49.0 23.0 12.2 3.2 5.0 16.4 8.3 11.3
Ukraine 28.6 22.4 21.9 11.0 4.7 1.9 4.6 14.7 9.1 4.0
Low- and middle-income countries
Market Institutional Other
4.2 Cooperation
In contrast to the use of sources of information, innovation cooperation requires that the parties collaborating play an active role in the work being undertaken. Innovation cooperation can take place along supply chains and involve customers and suppliers in the joint development of new products, processes or other innovations. Exchange of technological and business information naturally accompanies the trade of goods and services. Information on customer needs and their experience with a supplier’s product play a key role in innovation. Innovation cooperation can also involve horizontal collaboration, with firms working jointly with other firms or public research institutions (Oslo Manual §273-274).
Definition
Cooperation is the active participation in joint innovation projects with other organizations. These may either be other firms or non-commercial institutions. The partners need not derive immediate commercial benefit from the venture. Pure contracting out of work, where there is no active collaboration, is not regarded as cooperation (Oslo Manual §271).
Table 3 presents the percentage of innovation-active manufacturing firms that cooperated with certain partners in order to develop their innovation activities. When it comes to the active collaboration in innovation projects, linkages with the market appear to play a more important role than internal ones.
Opposite to the indicator on sources of information, the enterprise or enterprise group prevails as a partner in only one high-income country – Malta at 13%. In 74% of countries in this group, suppliers predominate as innovation partners. Likewise, the predominance of suppliers and clients or customers as innovation partners is observed in low- and middle-income countries, where competitors and consultants also appear as the leading cooperation partners of firms in Argentina (9.7%) and Egypt (7.1%), respectively.
Box 2. Linkages with institutional sources and partners
In this report, the term ‘institutional’ covers interactions with two types of agents: i) universities or other higher education institutions; and ii) the government or public research institutes. Overall, the linkages with them are remarkably low.
There is only one country where an institutional source prevails as a source of information: in Cuba, 24.7% of innovation-active firms rated the government or public research institutes as a highly important source of information.
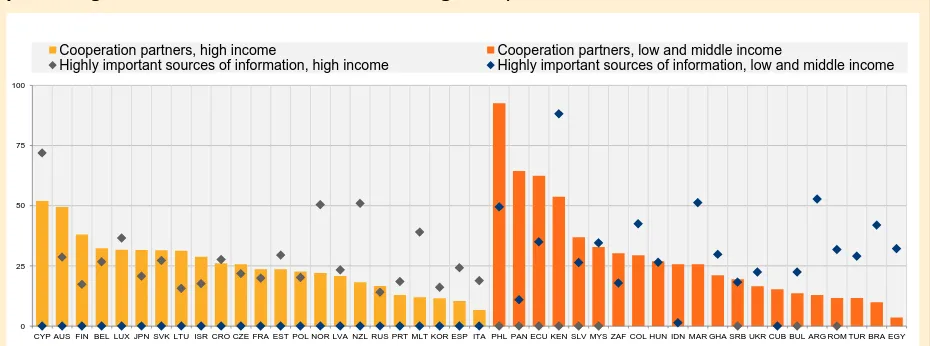
The situation is more critical when it comes to cooperation. Only in Argentina (16.1%) and the Republic of Korea (12.8%) is the government or public research institutes an important innovation partner for firms. Moreover, universities and other higher educational institutions – major contributors to the innovation process of business firms – are the predominant innovation partners in Germany5 only, where 17.1% of innovation-active firms cooperated with such partners.
Figure 7 illustrates the percentages of firms that had linkages with universities or other higher education institutions. With the exception of New Zealand, high-income countries have higher shares of firms cooperating with these agents than rating them as a highly important information source. In low- and middle-income countries, this happens in 65% of cases.
5
Figure 7. Firms that had linkages with universities or other higher education institutions(as a percentage of innovation-active manufacturing firms)
Notes: Please consult Annexes I and II.
Source: 2013 UIS innovation data collection, Eurostat and AU/NEPAD.
0 25 50 75 100
CYP AUS FIN BEL LUX JPN SVK LTU ISR CRO CZE FRA EST POL NOR LVA NZL RUS PRT MLT KOR ESP ITA PHL PAN ECU KEN SLV MYS ZAF COL HUN IDN MAR GHA SRB UKR CUB BUL ARG ROM TUR BRA EGY
Cooperation partners, high income Cooperation partners, low and middle income
Table 3. Firms that cooperated with partners (as a percentage of innovation-active manufacturing firms)
Notes: Please consult Annexes I and II. “:” Not available.
Source: 2013 UIS innovation data collection, Eurostat and AU/NEPAD Internal Other enterprises within your enterprise group Suppliers of equipment, materials, components, or software Clients or customers Competitors or other enterprises in your sector Consultants, commercial labs, or private R&D institutes Universities or other higher education institutions Government or public research institutes
Australia 21.4 49.4 41.6 21.4 36.2 1.4 5.6
Austria 21.2 30.2 22.8 8.0 20.2 24.7 11.6
Belgium 17.7 32.4 19.2 9.3 16.5 19.6 10.8
Croatia 8.6 26.1 21.6 13.9 12.3 13.9 9.1
Cyprus 8.1 51.9 45.5 37.0 34.0 7.7 9.4
Czech Republic 14.5 25.6 21.1 10.0 14.0 16.6 6.6
Denmark 16.8 28.9 25.1 9.1 17.2 14.5 10.5
Estonia 20.3 23.6 23.1 10.5 11.3 9.9 2.5
Finland 23.6 38.1 41.6 33.2 34.2 33.8 24.8
France 16.1 23.6 20.2 9.8 14.3 13.2 10.8
Germany 8.6 14.2 13.5 3.0 8.7 17.1 8.1
Iceland 6.2 9.5 23.7 3.8 1.9 10.4 15.6
Ireland 15.4 19.6 17.0 4.1 15.1 13.0 10.0
Israel : 28.8 40.1 15.4 20.3 14.4 10.1
Italy 2.2 6.7 5.1 2.7 6.6 5.3 2.2
Japan : 31.7 31.5 19.9 16.9 15.7 14.4
Latvia 14.0 20.8 19.6 14.0 10.6 5.9 1.9
Lithuania 17.7 31.3 24.2 11.3 14.8 13.1 8.6 Luxembourg 22.8 31.7 29.9 19.2 22.8 19.2 22.8
Malta 13.0 12.0 8.0 4.0 7.0 7.0 3.0
Netherlands 14.5 26.3 14.7 7.7 13.7 11.0 7.8
New Zealand : 18.2 18.7 16.6 : 7.2 5.9
Norway 16.8 22.1 22.0 7.6 19.4 14.3 18.1
Poland 11.2 22.7 15.2 7.7 10.1 12.6 9.0
Portugal 5.1 13.0 12.2 4.7 8.3 7.5 4.8
Republic of Korea : 11.5 12.8 8.1 6.3 10.0 12.8 Russian Federation 12.6 16.7 10.9 3.9 5.1 9.1 15.6
Slovakia 18.6 31.5 27.8 20.8 16.1 15.7 10.8
Spain 5.5 10.4 6.7 3.5 6.3 7.3 9.7
Sweden 33.3 35.9 30.7 14.2 29.7 18.3 8.8
Turkey 10.4 11.6 10.7 7.4 7.9 6.4 6.6
United Kingdom 6.2 9.4 11.0 3.8 4.5 4.7 2.5
Argentina : 12.9 7.6 3.5 9.3 14.5 16.1
Brazil : 10.0 12.8 5.2 6.2 6.3 :
Bulgaria 3.9 13.6 11.2 6.4 5.8 5.7 3.0
Colombia : 29.4 21.0 4.1 15.5 11.2 5.3
Costa Rica : 63.9 61.1 16.5 49.6 35.3 8.1
Cuba : 15.3 28.5 22.1 : 14.9 26.4
Ecuador : 62.4 70.2 24.1 22.1 5.7 3.0
Egypt : 3.6 7.1 0.9 7.1 1.8 0.9
El Salvador : 36.9 42.1 1.3 15.3 5.5 3.4
Ghana 28.1 21.1 31.6 17.5 22.8 12.3 8.8
Hungary 15.5 26.9 21.1 16.4 20.1 23.1 9.9
Indonesia : 25.7 15.9 8.0 10.2 8.4 4.9
Kenya : 53.8 68.8 54.8 51.6 46.2 40.9
Malaysia : 32.9 28.8 21.2 25.5 20.7 17.4
Mexico : : : 9.7 : 7.0 6.1
Morocco : 25.6 : : 19.2 3.8 :
Panama : 64.5 0.5 18.5 3.8 1.4 7.6
Philippines 91.2 92.6 94.1 67.6 64.7 47.1 50.0
Romania 2.8 11.7 10.6 6.2 5.9 7.2 3.1
Serbia 16.6 19.4 18.3 13.0 12.4 12.5 9.8
South Africa 14.2 30.3 31.8 18.6 21.1 16.2 16.2
Ukraine : 16.5 11.5 5.3 5.7 4.2 6.6
Low- and middle-income countries High-income countries
Section 5.
Hampering factors
Policymakers and business leaders need accurate information on factors that support innovation, as well as on the obstacles that may hinder it, which may take many forms. For this report, the hampering factors for innovation activities have been divided into four categories: cost factors; knowledge factors; market factors; and reasons not to innovate. The results are presented for innovation-active firms and non-innovative firms.
Definitions
Innovation activity may be hampered by a number of factors. There may be reasons for not starting innovation activities at all; there may be factors that slow innovation activity or affect them negatively. These hampering factors include: economic factors, such as high costs or lack of demand; knowledge factors, such as lack of skilled personnel; market factors, such as uncertainty in the demand for innovative products; and other factors, such as regulations (Oslo Manual §410).
5.1 Hampering factors for innovation-active firms
Table 4 presents the hampering factors which were highly important for innovation-active firms. Cost factors are the prevailing obstacles in both groups of countries.
In the high-income group, the lack of funds within the enterprise or enterprise group was the cost factor rated as highly important by most of the firms in 48% of countries, followed by the high costs of innovation, which prevailed in 33% of the countries. Altogether cost factors were the obstacle that was most frequently rated as highly important by innovation-active firms in 81% of high-income countries.
Moreover, in a few high-income countries there was the predominance of hampering factors of a different nature, namely knowledge and institutional factors. The lack of qualified personnel was the knowledge hampering factor most frequently rated as highly important by the innovation-active firms in Australia, Japan and Uruguay. The difficulty of finding cooperation partners was the prevailing knowledge hampering factor for firms in Canada. Additionally, the uncertain demand for innovative goods or services, a market hampering factor, prevailed in Luxembourg (16.8%).
Table 4. Innovation-active firms that rated hampering factors as highly important (as a percentage of innovation-active manufacturing firms)
Notes: Please consult Annexes I and II. “:” Not available.
“-” Nil.
Source: 2013 UIS innovation data collection, Eurostat and AU/NEPAD
Lack of funds within your enterprise or enterprise group Lack of financing from sources outside the enterprise Innovation costs are too
high Lack of qualified personnel Lack of information on technology Lack of information on markets Difficulty in finding cooperation partners for innovation Market dominated by established enterprises Uncertain demand for innovative goods or services
No need due to prior innovations by your enterprise No demand for innovations
Australia : 33.8 28.7 36.2 4.1 : : : 22.4 : :
Belgium 16.8 10.7 19.2 16.2 5.6 5.0 6.2 14.0 10.2 1.9 3.1
Canada 21.5 12.9 : 25.8 : : 27.4 : 22.5 : :
Croatia 46.3 33.0 38.5 18.1 5.5 6.5 12.6 17.9 13.5 1.2 2.4
Cyprus 28.5 28.9 33.6 11.5 8.9 1.7 9.4 14.5 14.9 : :
Czech Republic 35.7 20.0 24.8 11.9 2.5 2.5 4.1 19.4 12.7 2.9 4.4
Estonia 23.4 18.8 15.4 15.2 3.8 3.0 4.7 11.3 9.3 5.5 3.9
Finland 22.5 14.6 16.4 9.2 2.9 5.3 3.9 7.1 10.8 3.5 3.7
France 33.6 20.3 29.0 15.1 5.8 7.0 9.7 15.7 21.8 3.2 4.6
Iceland 23.7 19.9 15.6 4.3 2.4 2.4 5.7 2.8 8.1 2.4 2.8
Ireland 27.6 22.9 18.8 10.9 3.6 5.8 7.8 15.7 18.8 3.4 5.1
Italy 27.6 28.4 32.0 9.2 3.6 4.7 12.5 16.9 23.0 0.1 1.9
Japan 11.0 5.2 12.0 14.2 9.0 7.6 6.4 5.3 8.8 3.8 6.9
Latvia 25.8 17.7 28.9 15.2 4.3 9.3 16.8 20.8 14.6 7.8 7.8
Lithuania 27.1 20.1 26.6 14.1 4.5 5.7 8.8 18.2 8.8 1.4 a
Luxembourg 10.2 4.8 9.6 10.2 3.0 5.4 10.8 15.6 16.8 1.8 4.2
Malta 23.0 22.0 31.0 8.0 4.0 12.0 10.0 24.0 25.0 4.0 5.0
New Zealand : : 30.3 12.1 : : 2.4 : : : :
Norway 19.8 18.3 27.7 14.2 3.4 4.1 6.9 9.5 11.5 1.3 3.5
Poland 32.0 26.0 34.5 8.2 6.2 6.1 9.6 17.9 17.0 5.0 6.3
Portugal 39.6 34.9 42.9 15.2 7.6 7.4 15.3 18.2 21.7 4.2 8.2
Republic of Korea 24.6 11.1 16.8 15.8 11.8 9.3 6.0 5.6 14.5 2.0 2.5
Russian Federation 39.8 : 27.8 5.3 1.8 2.9 1.6 : 9.1 : :
Slovakia 33.2 : 26.1 13.6 5.5 5.5 5.1 15.5 10.5 -
-Spain 40.0 37.9 39.0 10.9 8.1 8.9 11.7 18.6 29.4 5.8 7.5
Sweden 21.2 11.8 12.4 12.0 2.3 4.2 3.4 12.6 8.3 1.3 2.6
Uruguay : : : 32.0 13.0 18.4 : : : : :
Belarus 35.5 8.4 24.3 6.8 3.7 4.4 2.3 : 5.1 : 8.4
Brazil : 20.1 25.0 23.7 8.1 6.5 10.6 : : : :
Bulgaria 40.1 31.2 40.6 18.1 : : 21.4 21.4 27.9 : 7.8
Colombia 27.0 18.2 : 11.0 7.3 9.4 16.4 : 19.4 : :
Costa Rica : 27.2 17.6 26.9 9.2 12.9 23.2 23.8 : : :
Cuba 55.3 39.1 10.6 26.8 54.0 33.2 : : 27.2 : :
Ecuador 28.2 23.9 37.9 23.8 22.5 17.8 15.5 20.9 16.7 : :
Egypt 28.6 30.4 22.3 26.8 33.9 35.7 28.6 24.1 31.3 25.9 25.9
El Salvador 55.6 : : 50.7 28.9 : : : 41.4 : 34.7
Ghana 47.4 28.2 38.6 14.1 7.0 8.8 17.5 19.3 12.3 5.3 :
Hungary 31.1 20.4 29.3 14.2 4.0 4.2 7.0 13.4 22.5 2.3 4.9
India 58.7 32.0 36.0 53.3 31.2 34.8 : 24.3 19.7 : :
Indonesia 1.8 1.3 1.3 1.3 1.3 1.3 1.3 1.3 1.3 : :
Kenya 47.3 35.5 51.6 17.2 12.9 10.8 17.2 23.7 18.3 3.2 5.4
Malaysia 50.5 46.2 61.9 38.3 20.5 21.4 23.3 40.0 36.9 7.6 7.4
Mexico 48.5 57.9 52.6 19.1 22.6 24.3 : : 26.4 : :
Nigeria 51.0 45.9 48.5 13.7 15.6 14.4 23.4 22.7 22.0 11.5 9.3
Panama 33.6 7.1 15.6 77.3 59.7 59.7 55.5 69.7 44.1 47.9 32.2
Philippines 19.1 10.2 20.9 11.7 8.2 10.0 5.6 14.7 9.9 : :
Romania 39.3 26.4 30.4 8.5 2.4 4.7 7.1 22.2 19.6 5.8 5.7
Serbia 56.4 38.3 45.1 9.7 5.7 5.4 16.6 22.0 21.7 5.4 6.6
South Africa 38.1 23.5 33.5 23.0 11.9 11.7 13.1 17.5 15.5 3.0 2.9
Tanzania 52.4 48.8 42.9 33.3 20.2 13.1 16.7 21.4 19.0 7.1 3.6
Uganda 50.3 40.2 51.1 13.3 19.7 15.2 26.3 28.3 26.1 5.8 7.6
Ukraine 65.6 38.1 57.0 13.5 6.6 6.0 17.9 34.7 16.8 6.1 9.9
Low- and middle-income countries
Cost factors Knowledge factors Market factors Reasons not to innovate
Other factors, such as the lack of information on technology, market domination by established enterprises, prior implementation of innovations and the absence of demand for innovation, were not seen as important obstacles in any country in both groups. As previously mentioned, cost factors – particularly lack of funds within the enterprise or enterprise group – appear to be predominant for both groups.
One noticeable difference between the two groups is the percentage of firms that rated hampering factors as highly important. Amongst the high-income countries, Portugal had the highest share, with 42.9% of innovation-active firms considering innovation costs to be too high. In low- and middle-income countries, in contrast, a few countries had more than one-half of innovation-active firms rating these factors as highly important. In Panama, for instance, in addition to the already mentioned 77.3% of firms that considered the lack of qualified personnel to be highly important, four other factors were also rated as highly important by more than one-half of the firms: the lack of information on technology (59.7%), the lack of information on markets (59.7%), the difficulty in finding cooperation partners for innovation (55.5%) and the market domination by established enterprises (69.7%).
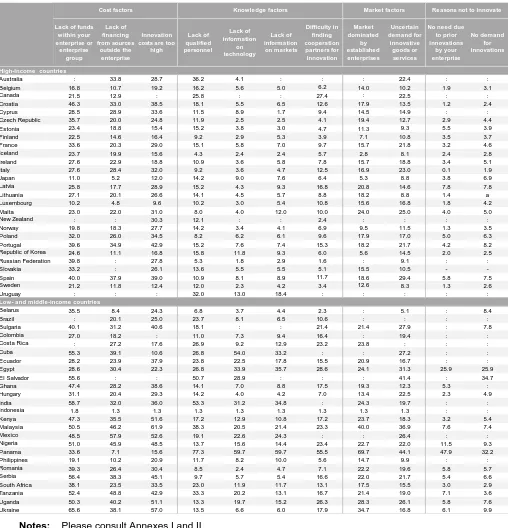
5.2 Hampering factors for non-innovative firms
Table 5 presents the the hampering factors which were highly important for non-innovative firms. Similar to what was observed in the case of innovation-active firms, cost factors are also the obstacle that hindered innovation most in non-innovative firms.
In 42% of high-income countries, high costs of innovation were the hampering factor that firms that did not innovate most frequently rated as highly important. Lack of funds within the enterprise or enterprise group appears in second place, prevailing in 23% of these countries. It is worth noticing that in 19% of countries, most of the non-innovative firms considered the lack of need to innovate due to no demand for innovations to be a highly important hampering factor. This was the case for instance for 29.1% of the non-innovative firms in the Czech Republic.
High costs of innovation also prevailed as an obstacle for non-innovative firms in 38% of low- and middle-income countries. As observed in the case of innovation-active firms, high costs of innovation appear in second place for non-innovative firms, being the predominant hampering factor in 21% of the low- and middle-income countries. Moreover, it is interesting to observe that the lack of funding from sources outside the enterprise is the predominant hampering factor for non-innovative firms in the same two countries where it prevailed amongst innovation-active firms, namely: Costa Rica and Mexico.
Table 5. Non-innovative firms that rated hampering factors as highly important (as a percentage of non-innovative manufacturing firms)
Notes: Please consult Annexes I and II. “:” Not available.
“-” Nil.
Source: 2013 UIS innovation data collection, Eurostat and AU/NEPAD
Lack of funds within your enterprise or enterprise group Lack of financing from sources outside the enterprise Innovation costs are too
high Lack of qualified personnel Lack of information on technology Lack of information on markets Difficulty in finding cooperation partners for innovation Market dominated by established enterprises Uncertain demand for innovative goods or services
No need due to prior innovations by your enterprise No demand for innovations
Australia : 12.4 9.5 15.3 : : : : 18.5 : :
Belgium 13.4 10.3 19.0 12.4 4.4 4.3 6.8 13.9 14.8 12.1 22.9
Croatia 28.3 21.4 29.2 9.8 3.8 3.3 8.4 13.1 11.5 4.0 5.6
Cyprus 63.3 56.0 64.2 19.3 13.0 8.9 13.9 42.1 52.2 43.0 43.7
Czech Republic 27.3 15.8 23.7 7.1 2.5 2.5 6.0 16.5 12.9 10.2 29.1
Estonia 23.7 21.2 16.6 8.6 2.2 2.1 5.2 13.6 9.7 6.4 7.8
Finland 15.1 8.8 14.0 7.3 5.4 5.0 7.6 8.9 13.5 8.2 7.4
France 21.2 12.2 21.5 11.3 4.8 5.1 7.7 12.9 17.4 12.9 24.5
Iceland 7.0 12.4 4.3 : : : : 2.7 : 5.4 2.7
Ireland 25.9 22.4 24.8 7.0 2.7 3.6 4.8 13.0 16.0 14.7 17.2
Italy 36.4 27.5 35.1 8.8 4.0 4.7 12.9 19.1 24.3 2.1 15.1
Japan 10.8 4.1 9.0 11.1 7.8 6.5 5.7 5.3 7.1 4.0 7.6
Latvia 28.4 23.8 35.7 13.3 7.1 8.4 18.2 25.9 21.4 9.6 16.3
Lithuania 34.6 28.2 35.3 14.5 9.2 9.9 15.5 26.6 22.0 25.3 21.8
Luxembourg 2.8 - 3.7 1.9 - - 0.9 0.9 1.9 6.5 24.3
Malta 8.5 3.5 12.7 4.9 2.8 2.1 2.1 8.5 5.6 3.5 7.0
New Zealand : : 17.4 7.2 : : 2.0 : : : :
Norway 6.8 6.7 7.7 3.8 1.5 1.7 2.7 3.5 6.5 1.2 2.2
Poland 31.4 26.6 33.4 16.4 14.0 13.5 18.4 21.7 22.7 16.7 16.8
Portugal 34.7 30.8 45.0 11.2 7.6 9.2 18.3 23.6 34.1 10.3 19.4
Republic of Korea 10.8 3.9 5.8 6.0 3.5 3.5 2.6 2.4 6.4 3.4 12.4
Russian Federation 32.9 : 24.1 8.0 4.2 4.1 3.3 : 8.1 : :
Slovakia 23.9 : 31.6 9.7 4.5 4.6 12.8 12.4 16.9 11.8 16.8
Spain 36.7 31.0 38.1 18.3 14.3 13.1 15.2 18.8 28.5 11.2 24.5
Sweden 8.5 4.9 7.5 4.7 2.7 1.7 2.4 7.1 6.1 3.9 7.9
Uruguay : : : 32.6 5.0 8.5 : : : : :
Belarus 83.4 57.7 69.5 69.4 63.9 62.0 49.4 : 47.7 : 54.1
Brazil : 7.9 11.5 8.4 2.8 2.1 2.6 : : 13.6 2.1
Bulgaria 39.6 28.1 36.4 14.4 8.9 8.9 18.7 20.7 23.9 5.5 10.4
Colombia 25.6 22.2 : 28.5 28.5 28.4 21.9 : 26.2 : :
Costa Rica : 37.7 26.4 34.0 15.1 26.4 22.6 37.7 : : :
Cuba 60.0 26.7 : 33.3 53.3 66.7 : : 40.0 : :
Ecuador 6.8 5.9 11.5 10.3 7.0 6.2 5.0 7.1 4.7 20.6 14.9
Egypt 16.0 17.0 13.2 17.2 24.3 32.9 20.1 17.6 20.2 20.1 21.6
Hungary 26.2 18.4 28.0 11.0 5.0 5.1 8.7 16.1 22.8 5.3 11.9
India 67.2 43.8 28.5 44.2 32.1 35.0 : 23.7 20.3 : :
Indonesia 0.8 0.6 0.8 0.6 0.6 0.6 0.6 0.6 0.6 : :
Kazakhstan 15.2 : : 3.1 : : : 16.9 : 23.0 41.8
Malaysia 38.2 32.2 45.1 35.3 12.6 13.2 12.6 34.4 32.5 6.6 6.0
Mexico 49.9 55.9 52.7 31.5 34.3 30.1 : : 27.8 : :
Nigeria 55.2 47.1 41.6 20.8 22.6 18.6 21.7 20.4 18.6 9.5 12.2
Panama 17.7 12.9 35.5 22.6 48.4 46.8 25.8 43.5 46.8 35.5 6.5
Philippines 23.9 14.5 26.0 9.5 13.3 8.2 8.6 16.0 12.1 7.4 13.0
Romania 39.2 26.3 34.6 12.9 7.0 6.6 14.5 19.9 19.0 : :
Serbia 11.5 15.2 22.9 29.7 26.5 18.0 22.2 24.8 24.9 23.0 27.6
South Africa 31.0 20.2 24.6 16.7 8.8 3.9 8.8 28.3 19.1 11.0 54.6
Tanzania 30.2 26.4 26.4 20.8 15.1 11.3 13.2 20.8 9.4 3.8 1.9
Turkey 26.0 19.3 38.5 14.7 9.1 6.6 11.0 19.0 19.6 10.0 23.6
Uganda 41.7 25.5 29.8 11.9 14.9 10.6 19.3 40.5 22.3 13.6 8.8
Ukraine 21.6 10.5 19.0 4.5 2.3 2.2 7.6 10.9 6.5 3.3 7.7
Low- and middle-income countries
Cost factors Knowledge factors Market factors Reasons not to innovate
Section 6.
Final remarks
Over the last decade, there has been a remarkable increase in the number of countries conducting innovation surveys, notably on the African continent. The production of reliable statistics for international comparison, however, remains a challenge, mainly due to the variations in the methodological procedures adopted by countries. Therefore, caution is required when making comparisons, especially when dealing with countries that do not have grossed up results. Likewise, drafting policy recommendations should not be based uniquely on the results of this data collection.
The purpose of this report was to present the main results of the 2013 UIS innovation data collection and examine the main features of the innovation process in high- and low- and middle-income countries, identifying its communalities and variations between these two groups.
First, manufacturing firms that implement innovations are present in all countries. Process innovation was the most frequently implemented by firms in high-income countries, while product innovation prevailed amongst firms in the group of low- and middle-income countries. The pervasiveness of innovation was also observed size-wise. The results showed that firms from all size classes implemented product or process innovation, with the exception of Hong Kong Special Administrative Region of China with a share of 0.1% of small product or process innovators. Moreover, as one would expect, larger size classes concentrate higher shares of innovators.
Second, in terms of innovation activities, the acquisition of machinery, equipment and software was the activity performed by most firms in both groups of countries. However, differences are observed in regard to the runner-up activity. In high-income countries, the second most performed innovation activity was internal R&D, while training held the second place in low- and middle-income countries. Moreover, evidence showed that in 20 out of 31 high-income countries (around 65%), internal R&D was performed by more than one-half of innovation-active firms. In the low- and middle-income group, internal R&D was performed by more than one-half of innovation-active firms in 10 out of 28 countries (36%).
Moreover, evidence showed that most of the innovation-active firms in both groups relied on internal information sources to develop their innovation activities or projects. However, market sources, mainly clients or customers, also played a relevant role as a source of information in 33% of the low- and middle-income countries.
The situation is different when it comes to cooperation for innovation, where overall internal linkages prevailed only in Malta (13%) within the high-income countries. Suppliers were the predominant cooperation partners of innovation-active firms in 74% of high-income countries and in 52% of low- and middle-income countries. In the latter group, clients or customers were also the most frequent cooperation partners of innovation-active firms in 39% of countries. As suppliers and clients or customers are market sources, this could be an indication of the importance of the connection to the market for the innovation process.
Annex I. Notes
Abandoned and ongoing innovation activities include activities in which firms engaged in order to develop product or process innovation. Differences are observed in the following countries: Argentina, Canada, Morocco: firms with abandoned and ongoing innovation activities are not identified; Kazakhstan: firms with abandoned innovation activities are not identified; Australia, Costa Rica (for innovation activities and cooperation), Cuba, El Salvador, Malaysia, Panama (except for Figure 4), Russian Federation (except for innovation activities): coverage refers to product, process, organizational or marketing innovation.
Innovation-active firms include firms that implemented or had abandoned or ongoing innovation activities to develop product or process innovation. Differences are observed in the following countries: Kazakhstan: firms with abandoned innovation activities are not identified; Australia, Cuba, El Salvador, Panama (except for Figure 4), Russian Federation (except for innovation activities): coverage refers to product, process, organizational or marketing innovation; Costa Rica (for innovation activities and cooperation): coverage refers to product, process, organizational or marketing innovation and firms with abandoned or ongoing innovation activities are not identified; Malaysia: firms that implemented or had abandoned or ongoing innovation activities for product or process innovation, regardless of organizational or marketing innovation or had abandoned or ongoing innovation activities for product, process, organizational or marketing innovation.
The degree of importance of the sources of information for innovation was not measured in Argentina, Australia and Colombia. Data for Panama also cover medium degree of importance.
Cooperation covers the active participation with other firms or public institutions in innovation activities, as well as non-active collaboration in El Salvador and Republic of Korea.
The degree of importance of the factors hampering innovation was not measured in Australia, Canada and Kazakhstan. Data for Panama also cover medium degree of importance.
Data are population estimates, except for the following countries that submitted survey data: Argentina, Costa Rica, Cuba, Egypt, Ghana, India, Indonesia, Kenya, Malaysia, Morocco, Nigeria, Panama, Philippines and Tanzania. Use of survey data in comparisons is not recommended.
Eurostat countries: Austria, Belgium, Bulgaria, Croatia, Cyprus, Czech Republic, Denmark, Estonia, Finland, France, Germany, Hungary, Iceland, Ireland, Italy, Latvia, Lithuania, Luxembourg, Malta, Netherlands, Norway, Poland, Portugal, Romania, Serbia, Slovakia, Slovenia, Spain, Sweden, Turkey, United Kingdom of Great Britain and Northern Ireland.
Annex II. Methodological procedures of the
national innovation surveys
Table A1. Basic methodological procedures of the national innovation surveys for high-income countries
Notes: “:” Not available.
Source: 2013 UIS innovation data collection Observation
period Statistical unit Sampling frame
Cut-off point criterion/
criteria
Survey method Type of data Other remarks
Australia 2010-2011 Kind of activity unit (KAU)
National statistical
business register Number of employees Sample survey
Grossed up data
(population estimates) :
Canada 2010-2012 Enterprise National statistical business register
Number of employees
and revenues Sample survey
Grossed up data
(population estimates) :
China,
Hong Kong 2011
Kind of activity unit (KAU)
National statistical business register, alternative admin/
commercial sources, ad hoc
lists
Number of employees Sample survey Grossed up data (population estimates)
Data cover all industry sections except agriculture, forestry, and fishing; mining and quarrying; taxi; public light buses;
and personal services
Israel 2010-2012 Establishment National statistical
business register Number of employees Sample survey
Grossed up data
(population estimates) :
Japan 2009-2011 Enterprise National statistical
business register Number of employees Sample survey
Grossed up data
(population estimates) ISIC Rev. 4 C12 is not covered
New Zealand 2011/12-2012/13 Enterprise National statistical business register
Number of employees
and turnover Sample survey
Grossed up data (population estimates)
Occasional differences in some indicators may be due to independent
rounding
Korea, Rep. 2009-2011 Enterprise National statistical
business register Number of employees Sample survey
Grossed up data (population estimates)
ISIC Rev. 4 C12 is not covered; ISIC Rev. 4 C33 is dispersed into a couple of
other categories; Occasional differences in some indicators may be
due to independent rounding
Russian
Federation 2010 Enterprise :
Number of employees
and turnover Census
Grossed up data (population estimates)
Data cover only medium-sized and large enterprises
Uruguay 2007-2009 Enterprise Administrative data Number of employees
and turnover Sample survey
Grossed up data
Table A2. Basic methodological procedures of the national innovation surveys for low- and middle-income countries
Notes: “:” Not available.
Source: 2013 UIS innovation data collection Observation
period Statistical unit Sampling frame
Cut-off point criterion/
criteria
Survey method Type of data Other remarks
Argentina 2007 Enterprise National statistical
business register Turnover Sample survey
Survey data (use in comparisons is not recommended)
:
Belarus 2012 Enterprise National statistical
business register Number of employees Census Survey data :
Brazil 2009-2011 Enterprise National statistical business register Number of employees
Combined (Sample survey: firms with 10-499 employees; Census: firms with 500
or more employees)
Grossed up data (population estimates)
Occasional differences in some indicators may be due to independent rounding; Cut off point: at least
10 employees China 2004-2006 Enterprise National statistical
business register
Number of employees, turnover and total
assets
Combined (Sample survey: small enterprises; Census: medium-sized and
large enterprises)
Grossed up data
(population estimates) :
Colombia 2009-2010 Enterprise National statistical
business register Number of employees Census Survey data
ISIC Rev. 3.1 D37 is not covered; For organizational and marketing innovation: ISIC Rev. 3.1 16 is
included in ISIC Rev. 3.1 36 Costa Rica 2010-2011 Enterprise National statistical business register Number of employees Sample survey
Survey data (use in comparisons is not recommended)
:
Cuba 2003-2005 Enterprise National statistical business register Number of employees Sample survey
Survey data (use in comparisons is not recommended)
Data cover only large enterprises
Ecuador 2009-2011 Enterprise National statistical business register Number of employees and turnover Sample survey (population estimates)Grossed up data :
Egypt 2008-2010 Enterprise Ad hoc lists Number of employees Sample survey
Survey data (use in comparisons is not recommended)
ISIC Rev. 4 C19, C24 and C29 are not included
El Salvador 2010-2012 Enterprise
National statistical business register,
alternative admin/commercial sources and ad hoc
lists
Number of employees
and turnover Sample survey
Grossed up data
(population estimates) ISIC Rev. 4 C12 and C33 are not covered
Ghana 2008-2010 Enterprise : Number of employees Sample survey
Survey data (use in comparisons is not recommended)
Industries covered: Material engineering, Other engineering and technologies, Economic and
business, Basic medicine, Media and communication, Environmental engineering, etc;
Source: AU/NEPAD India
2007/08-2009/10 Enterprise
National statistical
business register Number of employees Sample survey
Survey data (use in comparisons is not recommended)
:
Indonesia 2009-2010 Establishment National statistical business register Number of employees Sample survey
Survey data (use in comparisons is not recommended)
Data cover only medium-sized and large enterprises
Kazakhstan 2012 Enterprise National statistical
business register Number of employees
Combined (Sample survey: small enterprises; Census: medium-sized and
large enterprises)
Grossed up data
(population estimates) :
Kenya 2008-2011 Enterprise National statistical
business register Number of employees Sample survey
Survey data (use in comparisons is not recommended)
Industries covered: Agric, forestry & fishing, Min & quar, Manuf, Elect act, Water supply, Constr, Wholesale and retail trade, Transp and storage, Hosp, Info & com, Fin & insurance act, Prof serv, Public admin & defense, Educ, Health, Arts, entert & recreation, Admin & other sup act; Cut off point:
at least 10 employees Malaysia 2009-2011 Establishment Ad hoc lists Number of employees
and turnover Sample survey
Survey data (use in comparisons is not recommended)
ISIC Rev. 4 C12, C19 and C30 are not covered
Mexico 2010-2011 Enterprise
National statistical business register and ad hoc lists
Number of employees Sample survey Grossed up data (population estimates)
ISIC Rev. 3.1 D37 is not covered; Data for organisational and marketing innovation refer to
2011 only
Morocco 2009-2010 Enterprise
National statistical business register & Statistics Direct, Min of Com, Ind & New Technologies
Turnover Sample survey
Survey data (use in comparisons is not recommended)
:
Nigeria 2008-2010 Enterprise : Number of employees Sample survey
Survey data (use in comparisons is not recommended)
Cut off point: at least 10 employees; - Data cover manufacturing and services; Source: AU/NEPAD
Panama 2006-2008 Enterprise
National statistical business register and ad hoc lists
Turnover Sample survey
Survey data (use in comparisons is not recommended)
Data cover only large enterprises
Philippines Jan 2009-Jun
2010 Establishment
National statistical
business register Number of employees Sample survey
Survey data (use in comparisons is not recommended)
Industries covered: Food manufacturing, Electronics, IT manuf, ICT trade, SW publishing,
Telecom serv, HW consultancy, Other sw, Consultancy and Supply South Africa 2005-2007 Enterprise National statistical
business register Turnover Sample survey
Grossed up data
(population estimates) : Tanzania 2008-2010 Enterprise : Number of employees Sample survey
Survey data (use in comparisons is not recommended)
Cut off point: at least 5 employees; Industrial coverage: manuf, process, eng, serv & print;
Source: AU/NEPAD Uganda 2008-2010 Enterprise : Number of employees
and turnover Sample survey
Grossed up data (population estimates)
Cut off point: at least 5 employees and turnover of at least 10 million Shillings; Data cover mining,
manuf & serv; Source: AU/NEPAD Ukraine 2010-2012 Enterprise National statistical business register Number of employees
Combined (Sample survey: small enterprises; Census: medium-sized and
large enterprises)
Grossed up data (population estimates)
Table A3. Size classes for high-income countries
Source: 2013 UIS innovation data collection
Micro firms Small firms Medium-sized firms Large firms
Australia 0-4 employees 5-19 employees 20-199 employees 200 or more employees
Canada Not covered
20-99 employees and revenues of at least $250,000
Canadian dollars (CAD)
100-249 employees and revenues of at least CAD
$250,000
250 employees or more and revenues of at least CAD
$250,000
China,
Hong Kong Not covered 0-9 employees 10-99 employees 100 employees and over
Israel Not covered 10-49 employees 50-249 employees 250 or more employees
Japan Not covered 10-49 employees 50-249 employees 250 or more employees
New Zealand
6-19 employees and a turnover of at least 30,000 NZ
dollars
20-49 employees and a turnover of at least 30,000 NZ
dollars
50-99 employees and a turnover of at least 30,000 NZ
dollars
100 or more employees and a turnover of at least 30,000 NZ
dollars
Korea, Rep. 10-49 employees 50-99 employees 100-299 employees 300 or more employees
Russian
Federation Not covered Not covered
101-250 employees / 401-1,000 million Roubles
250 employees and more / 1,000 million Roubles and
more
Uruguay Not covered
5-19 employees / 0-19,448,999 Uruguayan Pesos
(UP)
20-99 employees / 19,449,000-145,867,499 UP