RESEARCH
Selection and validation of reference genes
for quantitative expression analysis of miRNAs
and mRNAs in Poplar
Fang Tang
1,2†, Liwei Chu
1†, Wenbo Shu
1,3, Xuejiao He
1, Lijuan Wang
1,2and Mengzhu Lu
1,2*Abstract
Background: Quantitative reverse transcriptase polymerase chain reaction (qRT-PCR) is a rapid and sensitive approach to identify miRNA and protein-coding gene expression in plants. However, because of the specially desig-nated reverse transcription and shorter PCR products, very few reference genes have been identified for the quantita-tive analysis of miRNA expression in plants, and different internal reference genes are needed to normalize the expres-sion of miRNAs and mRNA genes respectively. Therefore, it is particularly important to select the suitable common reference genes for normalization of quantitative PCR of miRNA and mRNA.
Results: In this study, a modified reverse transcription PCR protocol was adopted for selecting and validating uni-versal internal reference genes of mRNAs and miRNAs. Eight commonly used reference genes, four stably expressed novel genes in Populus tremula, three small noncoding RNAs and three conserved miRNAs were selected as candidate genes, and the stability of their expression was examined across a set of 38 tissue samples from four developmental stages of poplar clone 84K (Populus alba×Populus glandulosa). The expression stability of these candidate genes was evaluated systematically by four algorithms: geNorm, NormFinder, Bestkeeper and DeltaCt. The results showed that
Eukaryotic initiation factor 4A III (EIF4A) and U6-2 were suitable for samples of the callus stage; U6-1 and U6-2 were best for the seedling stage; Protein phosphatase 2A-2 (PP2A-2) and U6-1 were best for the plant stage; and Protein phos-phatase 2A-2 (PP2A-2) and Oligouridylate binding protein 1B (UBP) were the best reference genes in the adventitious root (AR) regeneration stage.
Conclusions: The purpose of this study was to identify the most appropriate reference genes for qRT-PCR of miRNAs and mRNAs in different tissues at several developmental stages in poplar. U6-1, EIF4A and PP2A-2 were the three most appropriate reference genes for qRT-PCR normalization of miRNAs and mRNAs during the plant regeneration process, and PP2A-2 and UBP represent the best reference genes in the AR regeneration stage of poplar. This work will benefit future studies of expression and function analysis of miRNAs and their target genes in poplar.
Keywords: Reference genes, MicroRNAs, mRNAs, qRT-PCR, Normalization, Development, Poplar
© The Author(s) 2019. This article is distributed under the terms of the Creative Commons Attribution 4.0 International License (http://creat iveco mmons .org/licen ses/by/4.0/), which permits unrestricted use, distribution, and reproduction in any medium, provided you give appropriate credit to the original author(s) and the source, provide a link to the Creative Commons license, and indicate if changes were made. The Creative Commons Public Domain Dedication waiver (http://creat iveco mmons .org/ publi cdoma in/zero/1.0/) applies to the data made available in this article, unless otherwise stated.
Introduction
Given its high sensitivity, quantitative accuracy, low cost and specificity, quantitative reverse transcriptase polymerase chain reaction (qRT-PCR) has become the
most common and widely used technique for quanti-fying miRNA expression and mRNA transcript levels among different tissues and experimental conditions in plants [1, 2]. However, the accuracy of qRT-PCR is eas-ily affected by several factors, including the quality of RNA samples, reverse transcription efficiency, cDNA quality and amount, and differences in extraneous tis-sue and cell activities [2–4]. To avoid bias in qRT-PCR analysis, validation of suitable reference genes for data normalization is an elementary prerequisite for each
Open Access
*Correspondence: [email protected]
†Fang Tang and Liwei Chu contributed equally to this work 1 State Key Laboratory of Tree Genetics and Breeding, Key Laboratory
of Tree Breeding and Cultivation of the National Forestry and Grassland Administration, Research Institute of Forestry, Chinese Academy of Forestry, Beijing 100091, China
experimental condition in different tissues or species [5]. However, no single reference gene can be universal under all experimental situations, even including the most stable reference gene(s) reported [6, 7]. Therefore, optimal reference genes should be validated for differ-ent species, tissues or specific treatmdiffer-ents.
MicroRNAs (miRNAs) are endogenous ~ 22 nt small noncoding RNAs that guide the cleavage or repress the translation of their target mRNAs by approximate base-pairing rules [8, 9] or mediate mRNA decay by directing rapid deadenylation of mRNAs [10]. In plants, miR-NAs are master regulators in controlling developmental processes and in response to biotic and abiotic stress responses [11–15]. Due to its short sequence (only ~ 22 nt in length), the quantification of miRNAs by qRT-PCR requires extending the length of mature miRNAs using stem-loop primers [7, 16] or adding poly(A)-tails [17– 20]. This extension requirement causes different internal reference genes to be commonly used for normaliza-tion in qRT-PCR of miRNAs and mRNAs. Some house-keeping genes, such as actin 7 (ACT 7), eukaryotic initiation factor 4A III (EIF4A), polyubiquitin (UBQ),
glyceraldehyde-3-phosphate dehydrogenase (GAPDH) and protein phosphatase 2A-2 (PP2A-2), were widely adopted for gene expression analysis in diverse plants as reference genes [21–23]. Several noncoding RNA and small RNA, such as 5.8S ribosomal RNA (5.8S rRNA) and U6 small nuclear RNA (U6 snRNA), are commonly used as reference genes for miRNA quantity [24, 25]. Hurteau developed a modified universal reverse tran-scription PCR protocol, in which mature miRNAs could be polyadenylated by poly (A) polymerase and reverse transcribed into cDNA using oligo-dT primers [17]. Then, mRNAs and miRNAs could be specifically ampli-fied and quantiampli-fied at same transcriptional level, and the relative quantification of a miRNA and its predicted mRNA target can be both assessed precisely [17]. In this case, it is particularly important to select a suitable ref-erence gene for normalization in quantitative PCR of miRNA and mRNA.
As a typical model woody plant, Populus has many advantages in basic research, such as rapid and peren-nial growth, moderate genome size, biomass-related traits and facile transformation [26]. Completion of the genomic sequence for Populus trichocarpa (black cotton-wood) [27] has led to the development of genomic and molecular resources, and the ideal genetic transforma-tion system provides a powerful genetic analysis tool for dissecting adaptive traits in poplar [28, 29]. Poplar clone 84K (Populus alba×Populus glandulosa) is now com-monly used for gene functional studies because it is easier to obtain transgenic plants through Agrobacterium tume-faciens-mediated leaf discs [30–32]. The regeneration of
transgenic plants involves callus induction, shoot differ-entiation, seedling culture and plant growth. This pro-cess is time consuming, requiring 2–3 months for tissue culture seedling and approximately 3–4 months for plant growth in soil. Therefore, we perform transgenic identifi-cation and gene expression analysis of early regenerated shoots and/or roots even small seedlings to reduce the time for identifying gene function in transgenic plants. In addition, the expression levels of miRNAs or target genes in different tissues are also required for analysis between transgenic and normal plants. However, most miRNA and mRNA expression levels vary greatly in dif-ferent developmental stages and tissues, so it is neces-sary to identify a more stably expressed miRNA or gene as the internal reference to normalize expression using qRT-PCR.
In this study, we have tested 18 genes and noncoding RNAs for candidate reference genes. The expression sta-bility of these genes was validated across a set of 38 tissue samples from four developmental biological processes of 84K poplar using a modified universal reverse transcrip-tion PCR protocol [17]. The cycle threshold (Ct) values of candidates were used to evaluate the expression stability using four algorithms: geNorm, NormFinder, Bestkeeper and DeltaCt. U6-1, EIF4A and PP2A-2 were the top three most appropriate reference genes for qRT-PCR of miR-NAs and mRmiR-NAs (including miRNA target genes) dur-ing the plant regeneration process, and PP2A-2 and UBP
were the best combination as reference genes in the AR regeneration stage of poplar.
Results
Verification of amplification and efficiency of the primers
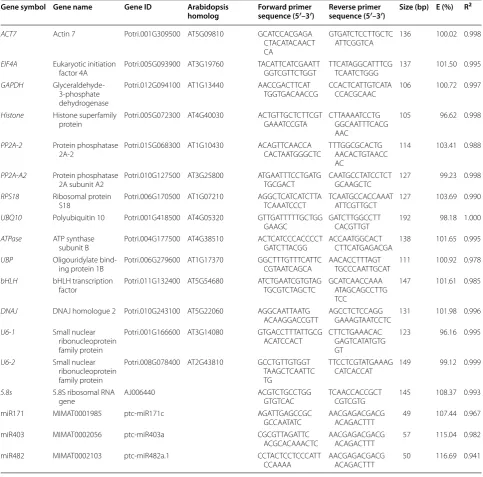
the regression coefficient (R2) varied between 0.941 and 1.000 (Table 1). These results suggest that the prim-ers of all the candidate reference genes exhibit high amplification efficiency and specificity in the qRT-PCR system.
Expression profile of candidate reference genes during plant regeneration
To evaluate the stability of the reference genes across all experimental samples, the transcript abundance of the 18
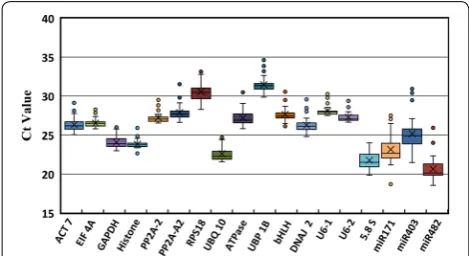
candidate reference genes was assessed based on mean Ct values. The average Ct values for the 18 candidate reference genes ranged from 21 to 33, with most values between 26 and 27 across all samples. miR482 had the highest expression level with a Ct value of 20.65 cycle, whereas UBP was the lowest abundantly expressed gene with Ct values up to 31.47 (Fig. 1). The Ct values of EIF4A
(26.50 ± 0.55) and U6-2 (27.27 ± 0.59) with minimum SD data indicate that these genes are the most stable genes in all the samples. The next most stable genes include
Table 1 The description of candidate reference genes and primers used in this study
Gene symbol Gene name Gene ID Arabidopsis
homolog Forward primer sequence (5′–3′) Reverse primer sequence (5′–3′) Size (bp) E (%) R 2
ACT7 Actin 7 Potri.001G309500 AT5G09810 GCA TCC ACG AGA CTA CAT ACA ACT CA
GTG ATC TCC TTG CTC
ATT CGG TCA 136 100.02 0.998
EIF4A Eukaryotic initiation
factor 4A Potri.005G093900 AT3G19760 TAC ATT CAT CGA ATT GGT CGT TCT GGT TTC ATA GGC ATT TCG TCA ATC TGG G 137 101.50 0.995
GAPDH
Glyceraldehyde-3-phosphate dehydrogenase
Potri.012G094100 AT1G13440 AAC CGA CTT CAT
TGG TGA CAA CCG CCA CTC ATT GTC ATA CCA CGC AAC 106 100.72 0.997
Histone Histone superfamily
protein Potri.005G072300 AT4G40030 ACT GTT GCT CTT CGT GAA ATC CGT A CTT AAA ATC CTG GGC AAT TTC ACG AAC
105 96.62 0.998
PP2A-2 Protein phosphatase
2A-2 Potri.015G068300 AT1G10430 ACA GTT CAA CCA CAC TAA TGG GCT C TTT GGC GCA CTG AAC ACT GTA ACC AC
114 103.41 0.988
PP2A-A2 Protein phosphatase
2A subunit A2 Potri.010G127500 AT3G25800 ATG AAT TTC CTG ATG TGC GACT CAA TGC CTA TCC TCT GCA AGCTC 127 99.23 0.998
RPS18 Ribosomal protein
S18 Potri.006G170500 AT1G07210 AGG CTC ATC ATC TTA TCA AAT CCC T TCA ATG CCA CCA AAT ATT CGT TGC T 127 103.69 0.990
UBQ10 Polyubiquitin 10 Potri.001G418500 AT4G05320 GTT GAT TTT TGC TGG
GAA GC GAT CTT GGC CTT CAC GTT GT 192 98.18 1.000
ATPase ATP synthase
subunit B Potri.004G177500 AT4G38510 ACT CAT CCC ACC CCT GAT CTT ACG G ACC AAT GGC ACT CTT CAT GAG ACG A 138 101.65 0.995
UBP Oligouridylate
bind-ing protein 1B Potri.006G279600 AT1G17370 GGC TTT GTT TCA TTC CGT AAT CAG CA AAC ACC TTT AGT TGC CCA ATT GCA T 111 100.92 0.978
bHLH bHLH transcription
factor Potri.011G132400 AT5G54680 ATC TGA ATC GTG TAG TGC GTC TAG CTC GCA TCA ACC AAA ATA GCA GCC TTG TCC
147 101.61 0.985
DNAJ DNAJ homologue 2 Potri.010G243100 AT5G22060 AGG CAA TTA ATG
ACA AGG ACC GTT AGC CTC TCC AGG GAA AGT AAT CCT C 131 101.98 0.996
U6-1 Small nuclear ribonucleoprotein family protein
Potri.001G166600 AT3G14080 GTG ACC TTT ATT GCG
ACA TCC ACT CTT CTG AAA CAC GAG TCA TAT GTG GT
123 96.16 0.995
U6-2 Small nuclear ribonucleoprotein family protein
Potri.008G078400 AT2G43810 GCC TGT TGT GGT TAA GCT CAA TTC TG
TTC CTC GTA TGA AAG
CAT CAC CAT 149 99.12 0.999
5.8s 5.8S ribosomal RNA
gene AJ006440 ACG TCT GCC TGG GTG TCA C TCA ACC ACC GCT CGT CGT G 145 108.37 0.993 miR171 MIMAT0001985 ptc-miR171c AGA TTG AGC CGC
GCC AAT ATC AAC GAG ACG ACG ACA GAC TTT 49 107.44 0.967 miR403 MIMAT0002056 ptc-miR403a CGC GTT AGA TTC
ACG CAC AAA CTC AAC GAG ACG ACG ACA GAC TTT 57 115.04 0.982 miR482 MIMAT0002103 ptc-miR482a.1 CCT ACT CCT CCC ATT
Histone (23.83 ± 0.62) and U6-1 (28.07 ± 0.62). Genes with more variable expression levels include miR403 (25.16 ± 2.29) and miR171 (23.16 ± 2.00) (Additional file 3: Table S1).
Expression stability of candidate reference genes during plant regeneration
To detect the expression stability of 18 candidate refer-ence genes more accurately, four software programs, including geNorm, NormFinder, BestKeeper and Delta-Ct method, were used for statistical analysis. These can-didate reference genes were evaluated by each program and ranked from the most to the least stably expressed genes. Then, the geometric mean of each gene was cal-culated and reordered using RankAggreg software. Data of each reference gene from samples of different devel-opmental stages were analyzed separately and then inte-grated together.
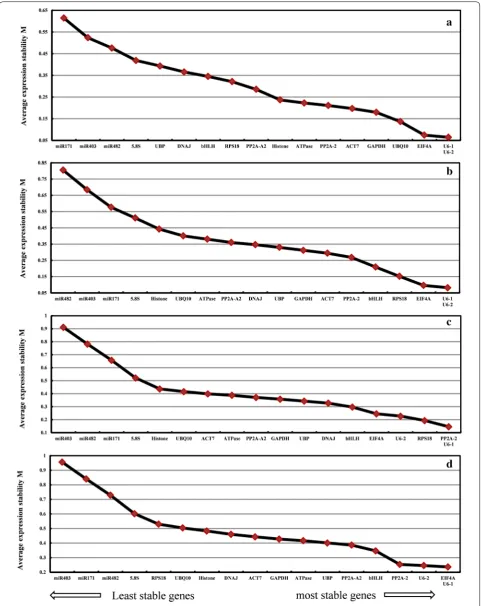
The M-values of 18 candidate reference genes calcu-lated by geNorm were all less than 1.5 in different tissues at plants developmental stages. U6-1 and U6-2 exhib-ited the highest stable expression with least M-values of 0.064 (Fig. 2a) and 0.082 (Fig. 2b) at the callus and seedling stage, respectively. PP2A-2 and U6-1 both exhibited the highest stable expression with the low-est M-value of 0.1456 at the plant stage (Fig. 2c), and
EIF4A and U6-1 exhibited the lowest M-value at 0.236 in all samples of these three stages (Fig. 2d). Overall, U6-1
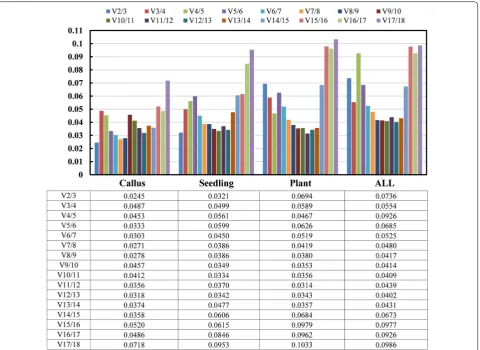
and EIF4A could be chosen as the most sable reference genes because of their lower M-value in various tissues at different developmental stages, whereas miR403 and miR171 were the least stable genes with increased M-val-ues (from 0.577 to 0.955) in all samples. In the subsets of different developmental stages, all the pairwise variation values of V2/3 were less than 0.15, which suggests that
the combined use of the two most stable reference genes would be most effective for normalizing gene expression analysis (Fig. 3).
The stability values of the candidate reference genes constructed by NormFinder are presented in Table 2. At the callus stage, Histone was the most stable gene with the lowest stability value followed by EIF4A and U6-2.
U6-1, U6-2 and EIF4A exhibited more stable expression at the seedling stage, whereas UBP, bHLH and DNAJ
exhibited increased stability in various tissues at the plant stage. In all samples, bHLH, PP2A-2 and U6-1 were the top three stable genes. miR403, miRN482 and miR171 were the least stable genes during the plant regeneration process.
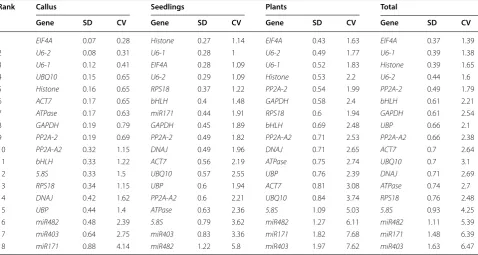
The most stable genes based on BestKeeper analysis exhibiting the lowest CV ± SD were EIF4A (0.28 ± 0.07),
Histone (1.14 ± 0.27) and EIF4A (1.63 ± 0.43) in various tissues at the callus, seedling and plant stages, respec-tively (Table 3). U6-1 and U6-2 exhibited stable expres-sion during all these developmental stages. In all samples,
EIF4A (1.39 ± 0.37) was the most stable gene followed by U6-1 (1.38 ± 0.39) and Histone (1.65 ± 0.39), whereas miR403, miR171 and miR482 were the most unstable genes with highest SV ± SD and a SD value greater than 1.
The rankings using the Delta Ct method are presented in Table 4. EIF4A, U6-2 and U6-1 were the top three sta-ble genes at the callus and seedling stages. PP2A-2 was the most stable gene at the plant stage and in all samples during these three developmental stages, followed by U6
-1. This finding indicates that EIF4A, PP2A-2 and U6-1
might be the most stably expressed genes as determined using the Delta Ct method.
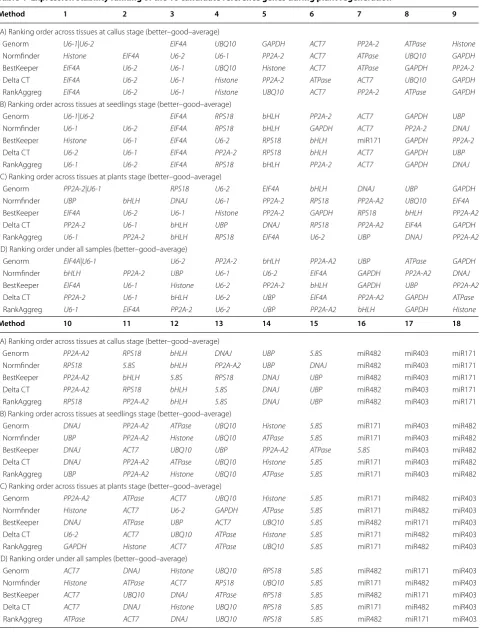
To obtain a consensus regarding the most stable ref-erence genes as recommended by the four methods, the geometric mean of four algorithms corresponding rankings for each candidate gene were calculated using the RankAggreg software. EIF4A, U6-2 and U6-1 were ranked as the top three stable reference genes in sam-ples from the callus developmental stage. U6-1 was the most stable gene at the seedling and plant stages, and U6
-2 and PP2A-2 ranked second at the seedling stage and plant stage respectively. The expression values of miR403, miR171 and miR482 were extremely variable in all tissues at different stages. Based on these results, U6-1, EIF4A
and PP2A-2 are the best combination of reference genes in all samples of different developmental stages. EIF4A
and U6-2 are the most stable reference genes for the sam-ples from callus stage. U6-1 and U6-2 are the best refer-ence genes for the seedling stage, and U6-1 and PP2A-2
suitable for the plant stage. Fig. 1 Box plots of the Ct values of 18 candidate reference genes
Fig. 2 GeNorm analysis of average expression stability values (M) and ranking of the 18 candidate reference genes during plant regeneration. a
Expression stability of the candidate reference genes in AR developmental stage
The expression profiles of the 18 candidate reference genes and the ranking of their expression stability in the AR developmental stage were different from those dur-ing the plant regeneration processes. With the exception of 5.8 s and miRNAs, the Ct values for the remaining 14 candidate reference genes in the AR developmental stage were relatively higher compared with the other stages having most values between 27 and 33. The Ct values of miR482 (24.62 ± 0.42) had a minimum SD value and
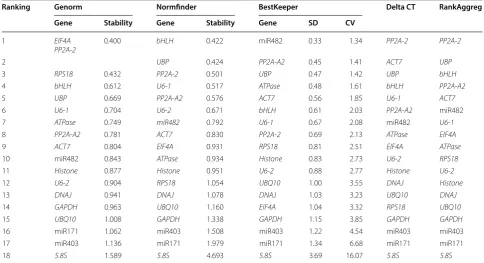
5.8s (22.93 ± 4.70) had a maximum SD value (Additional file 3: Table S1). In geNorm analysis, EIF4A and PP2A
-2 exhibited the highest stability with the lowest M-value. The pairwise variation was 0.133 for V2/3 values. Thus, the combined use of the two most stable reference genes would be suitable for normalizing gene expression analy-sis. Using NormFinder software, bHLH was identified as the most stable gene with the lowest stability value
followed by UBP and PP2A-2. miR482 (1.34 ± 0.33),
PP2A-A2 (1.41 ± 0.45) and UBP (1.42 ± 0.47) exhibited more stability with lower CV ± SD calculated by Best-Keeper. PP2A-2, ACT7 and UBP were the top three stable genes calculated using the Delta Ct method. RankAggreg ranked PP2A-2, UBP and bHLH as the top three stable reference genes in the AR developmental stages. In con-trast, 5.8s, miR171, miR403 and GAPDH were unstable genes identified by all algorithms (Table 5).
Reference genes validation
PP2A-2) either alone or combination and two unstable reference genes (5.8 s and miR403), were used as refer-ence genes for RT-qPCR analysis at callus, seedling and
plant stages. As shown in Fig. 4, the relative expression profiles of miR166a and PtHB4 normalized with U6
-1, EIF4A, PP2A-2, U6-1+EIF4A and U6-1+PP2A-2
Table 2 Ranking of the expression stability of candidate reference genes calculated using NormFinder during plant regeneration
Rank Callus Seedlings Plants Total
Gene Stability Gene Stability Gene Stability Gene Stability
1 Histone 0.041 U6-1 0.041 UBP 0.210 bHLH 0.275
2 EIF4A 0.168 U6-2 0.041 bHLH 0.228 PP2A-2 0.302
3 U6-2 0.213 EIF4A 0.043 DNAJ 0.247 U6-1 0.303
4 U6-1 0.221 RPS18 0.082 U6-1 0.288 UBP 0.308
5 PP2A-2 0.222 bHLH 0.151 PP2A-2 0.296 U6-2 0.376
6 ACT7 0.277 GAPDH 0.267 RPS18 0.380 EIF4A 0.402
7 ATPase 0.284 ACT7 0.282 PP2A-A2 0.418 GAPDH 0.419
8 UBQ10 0.310 PP2A-2 0.288 UBQ10 0.424 PP2A-A2 0.427
9 GAPDH 0.335 DNAJ 0.374 EIF4A 0.427 DNAJ 0.461
10 RPS18 0.417 UBP 0.392 Histone 0.440 Histone 0.485
11 5.8S 0.424 PP2A-A2 0.472 ACT7 0.468 ATPase 0.499
12 bHLH 0.428 Histone 0.508 U6-2 0.471 ACT7 0.521
13 PP2A-A2 0.441 UBQ10 0.558 GAPDH 0.471 RPS18 0.561
14 UBP 0.526 ATPase 0.575 ATPase 0.544 UBQ10 0.582
15 DNAJ 0.533 5.8S 0.855 5.8S 0.921 5.8S 0.967
16 miR482 0.712 miR171 0.901 miR171 1.405 miR171 1.473
17 miR403 0.773 miR403 1.498 miR482 1.618 miR482 1.506
18 miR171 1.288 miR482 1.710 miR403 1.852 miR403 1.767
Table 3 Ranking of the expression stability of candidate reference genes calculated by BestKeeper during plant regeneration
Rank Callus Seedlings Plants Total
Gene SD CV Gene SD CV Gene SD CV Gene SD CV
1 EIF4A 0.07 0.28 Histone 0.27 1.14 EIF4A 0.43 1.63 EIF4A 0.37 1.39
2 U6-2 0.08 0.31 U6-1 0.28 1 U6-2 0.49 1.77 U6-1 0.39 1.38
3 U6-1 0.12 0.41 EIF4A 0.28 1.09 U6-1 0.52 1.83 Histone 0.39 1.65
4 UBQ10 0.15 0.65 U6-2 0.29 1.09 Histone 0.53 2.2 U6-2 0.44 1.6
5 Histone 0.16 0.65 RPS18 0.37 1.22 PP2A-2 0.54 1.99 PP2A-2 0.49 1.79
6 ACT7 0.17 0.65 bHLH 0.4 1.48 GAPDH 0.58 2.4 bHLH 0.61 2.21
7 ATPase 0.17 0.63 miR171 0.44 1.91 RPS18 0.6 1.94 GAPDH 0.61 2.54
8 GAPDH 0.19 0.79 GAPDH 0.45 1.89 bHLH 0.69 2.48 UBP 0.66 2.1
9 PP2A-2 0.19 0.69 PP2A-2 0.49 1.82 PP2A-A2 0.71 2.53 PP2A-A2 0.66 2.38 10 PP2A-A2 0.32 1.15 DNAJ 0.49 1.96 DNAJ 0.71 2.65 ACT7 0.7 2.64
11 bHLH 0.33 1.22 ACT7 0.56 2.19 ATPase 0.75 2.74 UBQ10 0.7 3.1
12 5.8S 0.33 1.5 UBQ10 0.57 2.55 UBP 0.76 2.39 DNAJ 0.71 2.69
13 RPS18 0.34 1.15 UBP 0.6 1.94 ACT7 0.81 3.08 ATPase 0.74 2.7
14 DNAJ 0.42 1.62 PP2A-A2 0.6 2.21 UBQ10 0.84 3.74 RPS18 0.76 2.48
15 UBP 0.44 1.4 ATPase 0.63 2.36 5.8S 1.09 5.03 5.8S 0.93 4.25
16 miR482 0.48 2.39 5.8S 0.79 3.62 miR482 1.27 6.11 miR482 1.11 5.39
17 miR403 0.64 2.75 miR403 0.83 3.36 miR171 1.82 7.68 miR171 1.48 6.39
Table 4 Expression stability ranking of the 18 candidate reference genes during plant regeneration
Method 1 2 3 4 5 6 7 8 9
(A) Ranking order across tissues at callus stage (better–good–average)
Genorm U6-1|U6-2 EIF4A UBQ10 GAPDH ACT7 PP2A-2 ATPase Histone
Normfinder Histone EIF4A U6-2 U6-1 PP2A-2 ACT7 ATPase UBQ10 GAPDH
BestKeeper EIF4A U6-2 U6-1 UBQ10 Histone ACT7 ATPase GAPDH PP2A-2
Delta CT EIF4A U6-2 U6-1 Histone PP2A-2 ATPase ACT7 UBQ10 GAPDH
RankAggreg EIF4A U6-2 U6-1 Histone UBQ10 ACT7 PP2A-2 ATPase GAPDH
(B) Ranking order across tissues at seedlings stage (better–good–average)
Genorm U6-1|U6-2 EIF4A RPS18 bHLH PP2A-2 ACT7 GAPDH UBP
Normfinder U6-1 U6-2 EIF4A RPS18 bHLH GAPDH ACT7 PP2A-2 DNAJ
BestKeeper Histone U6-1 EIF4A U6-2 RPS18 bHLH miR171 GAPDH PP2A-2
Delta CT U6-2 U6-1 EIF4A PP2A-2 RPS18 bHLH ACT7 GAPDH UBP
RankAggreg U6-1 U6-2 EIF4A RPS18 bHLH PP2A-2 ACT7 GAPDH DNAJ
(C) Ranking order across tissues at plants stage (better–good–average)
Genorm PP2A-2|U6-1 RPS18 U6-2 EIF4A bHLH DNAJ UBP GAPDH
Normfinder UBP bHLH DNAJ U6-1 PP2A-2 RPS18 PP2A-A2 UBQ10 EIF4A
BestKeeper EIF4A U6-2 U6-1 Histone PP2A-2 GAPDH RPS18 bHLH PP2A-A2
Delta CT PP2A-2 U6-1 bHLH UBP DNAJ RPS18 PP2A-A2 EIF4A GAPDH
RankAggreg U6-1 PP2A-2 bHLH RPS18 EIF4A U6-2 UBP DNAJ PP2A-A2
(D) Ranking order under all samples (better–good–average)
Genorm EIF4A|U6-1 U6-2 PP2A-2 bHLH PP2A-A2 UBP ATPase GAPDH
Normfinder bHLH PP2A-2 UBP U6-1 U6-2 EIF4A GAPDH PP2A-A2 DNAJ
BestKeeper EIF4A U6-1 Histone U6-2 PP2A-2 bHLH GAPDH UBP PP2A-A2
Delta CT PP2A-2 U6-1 bHLH U6-2 UBP EIF4A PP2A-A2 GAPDH ATPase
RankAggreg U6-1 EIF4A PP2A-2 U6-2 UBP PP2A-A2 bHLH GAPDH Histone
Method 10 11 12 13 14 15 16 17 18
(A) Ranking order across tissues at callus stage (better–good–average)
Genorm PP2A-A2 RPS18 bHLH DNAJ UBP 5.8S miR482 miR403 miR171
Normfinder RPS18 5.8S bHLH PP2A-A2 UBP DNAJ miR482 miR403 miR171 BestKeeper PP2A-A2 bHLH 5.8S RPS18 DNAJ UBP miR482 miR403 miR171
Delta CT PP2A-A2 RPS18 bHLH 5.8S DNAJ UBP miR482 miR403 miR171
RankAggreg RPS18 PP2A-A2 bHLH 5.8S DNAJ UBP miR482 miR403 miR171 (B) Ranking order across tissues at seedlings stage (better–good–average)
Genorm DNAJ PP2A-A2 ATPase UBQ10 Histone 5.8S miR171 miR403 miR482 Normfinder UBP PP2A-A2 Histone UBQ10 ATPase 5.8S miR171 miR403 miR482 BestKeeper DNAJ ACT7 UBQ10 UBP PP2A-A2 ATPase 5.8S miR403 miR482 Delta CT DNAJ PP2A-A2 ATPase UBQ10 Histone 5.8S miR171 miR403 miR482 RankAggreg UBP PP2A-A2 Histone UBQ10 ATPase 5.8S miR171 miR403 miR482 (C) Ranking order across tissues at plants stage (better–good–average)
Genorm PP2A-A2 ATPase ACT7 UBQ10 Histone 5.8S miR171 miR482 miR403 Normfinder Histone ACT7 U6-2 GAPDH ATPase 5.8S miR171 miR482 miR403
BestKeeper DNAJ ATPase UBP ACT7 UBQ10 5.8S miR482 miR171 miR403
Delta CT U6-2 ACT7 UBQ10 ATPase Histone 5.8S miR171 miR482 miR403 RankAggreg GAPDH Histone ACT7 ATPase UBQ10 5.8S miR171 miR482 miR403 (D) Ranking order under all samples (better–good–average)
Genorm ACT7 DNAJ Histone UBQ10 RPS18 5.8S miR482 miR171 miR403
Normfinder Histone ATPase ACT7 RPS18 UBQ10 5.8S miR171 miR482 miR403 BestKeeper ACT7 UBQ10 DNAJ ATPase RPS18 5.8S miR482 miR171 miR403
Delta CT ACT7 DNAJ Histone UBQ10 RPS18 5.8S miR171 miR482 miR403
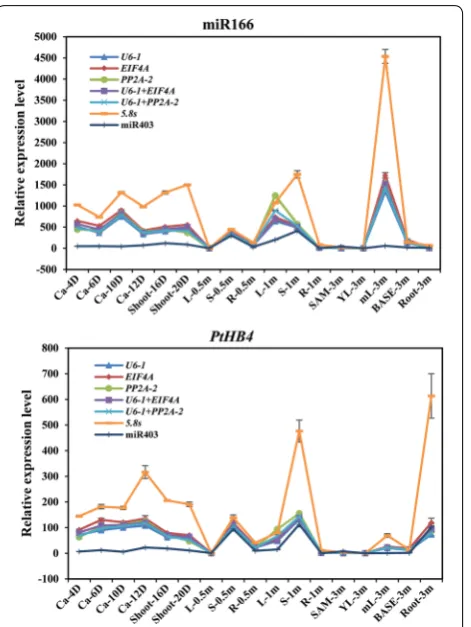
exhibited perfect consistency in seventeen tissues. Compared with tender leaves from 0.5-month-old seedlings, miR166a was highly expressed in stems, mature leaves and all samples at the callus stage (Fig. 4), whereas PtHB4 was specifically expressed in stems and samples at the callus stage (Fig. 4). However, the expression values of miR166a and PtHB4 normalized with 5.8s were increased, and the values normalized to miR403 were reduced compared with than other ref-erence genes (Fig. 4). For example, the relative expres-sion value of miR166 in mature leaves at 3 months was approximately 1500 when normalized with U6-1. How-ever, the expression value was 4500 when normalized with 5.8 s and 18 when normalized with miR403.
Because the combined use of two most stable reference genes would be suitable for normalizing gene expres-sion analysis at the AR developmental stage, PP2A-2,
UBP, bHLH, PP2A-2+UBP and PP2A-2+bHLH were selected as stable reference genes, and 5.8s and miR403 were selected as the two least stable reference genes for RT-qPCR analysis of the AR developmental stage. As shown in Fig. 5, the relative expression values of miR166 and PtHB4 normalized with PP2A-2 were higher than values normalized with bHLH, but similar expression patterns were noted. Therefore, the combination of
PP2A-2 and bHLH could neutralize the expression values normalized with PP2A-2 and bHLH. miR166 was highly
expressed in AR-60H, in which the AR callus regenerated and expanded. PtHB4 exhibited a higher expression value in AR-18H when AR induction had begun. The relative expression profiles of miR166 and PtHB4 normalized with 5.8s and miR403 were reduced compared with val-ues normalized with other reference genes, and differ-ent expression patterns were noted (Fig. 5). Overall, the combination of, PP2A-2 and UBP or PP2A-2 and bHLH
should be the best reference gene set for normalization of qRT-PCR at the AR developmental stage.
Discussion
Numerous studies have performed reference gene vali-dation experiments for mRNA and miRNA qRT-PCR [36, 37]. For example, some house-keeping genes, such as ACT 7, UBQ, GAPDH and TUB, were widely used for gene expression analysis of mRNAs in diverse plants, and several noncoding RNAs, such as U6 snRNA and 5.8S rRNA, were typically chosen for normalizing miRNA quantification data. As miRNA research continues to expand, the potential use of miRNAs as reference genes has attracted increasing attention, and some small RNAs were obtained from plant species, such as grapevine [7], wheat [38], peach [39], soybean [40], and tea [41] demon-strating that miRNAs are more stable than the currently used reference genes under specific conditions. How-ever, there are no reports on universal reference genes for
Table 5 Ranking of candidate reference genes in order of their expression stability in the AR developmental stage
Ranking Genorm Normfinder BestKeeper Delta CT RankAggreg
Gene Stability Gene Stability Gene SD CV
1 EIF4A
PP2A-2 0.400 bHLH 0.422 miR482 0.33 1.34 PP2A-2 PP2A-2
2 UBP 0.424 PP2A-A2 0.45 1.41 ACT7 UBP
3 RPS18 0.432 PP2A-2 0.501 UBP 0.47 1.42 UBP bHLH
4 bHLH 0.612 U6-1 0.517 ATPase 0.48 1.61 bHLH PP2A-A2
5 UBP 0.669 PP2A-A2 0.576 ACT7 0.56 1.85 U6-1 ACT7
6 U6-1 0.704 U6-2 0.671 bHLH 0.61 2.03 PP2A-A2 miR482
7 ATPase 0.749 miR482 0.792 U6-1 0.67 2.08 miR482 U6-1
8 PP2A-A2 0.781 ACT7 0.830 PP2A-2 0.69 2.13 ATPase EIF4A
9 ACT7 0.804 EIF4A 0.931 RPS18 0.81 2.51 EIF4A ATPase
10 miR482 0.843 ATPase 0.934 Histone 0.83 2.73 U6-2 RPS18
11 Histone 0.877 Histone 0.951 U6-2 0.88 2.77 Histone U6-2
12 U6-2 0.904 RPS18 1.054 UBQ10 1.00 3.55 DNAJ Histone
13 DNAJ 0.941 DNAJ 1.078 DNAJ 1.03 3.23 UBQ10 DNAJ
14 GAPDH 0.963 UBQ10 1.160 EIF4A 1.04 3.32 RPS18 UBQ10
15 UBQ10 1.008 GAPDH 1.338 GAPDH 1.15 3.85 GAPDH GAPDH
16 miR171 1.062 miR403 1.508 miR403 1.22 4.54 miR403 miR403
17 miR403 1.136 miR171 1.979 miR171 1.34 6.68 miR171 miR171
the quantitative expression of both mRNA and miRNA, which may be necessary to calibrate both miRNA and its target gene(s) in a given sample. In general, the reverse transcription of miRNA is different from other types of RNA because of the shorter length of miRNA. Therefore, quantitative expression analysis of miRNAs and mRNAs requires different internal reference genes for normali-zation of their respective transcripts [15, 42]. If miRNA and mRNA expression data are normalized with univer-sal internal reference genes, quantitative PCR must be performed at the same transcriptional level. Fortunately, Hurteau developed a modified universal reverse tran-scription PCR protocol that is designed to specifically amplify and quantify mRNAs and miRNAs from the same sample [17]. The modified technique involves the enzymatic addition of a poly A tail to non-poly(A) RNAs followed by reverse transcription using a universal RT-primer. Then, the transcript-specific forward primers can be used to amplify noncoding RNA (including miRNA) and mRNA from the same sample [17]. To obtain suitable
universal reference genes for normalization of miRNA and mRNA expression, the expression stability of the selected candidate reference genes in this study was vali-dated across 38 tissue samples from four developmental stages in 84K poplar using a modified universal reverse transcription PCR protocol.
Four algorithms (geNorm, NormFinder, DeltaCt, Best-keeper) were used to minimize the bias for the evalua-tion of the 18 candidate reference genes. Discrepancy was observed in gene stability ranking and validation generated by the four different algorithms above. For example, at the plant stage, PP2A-2 was ranked first by geNorm and DeltaCt, whereas it was ranked fifth by Nor-mFinder and Bestkeeper. Histone was ranked among the top four stable genes by BestKeeper in all samples at the seedling and plant stages but was ranked in the middle or bottom position by geNorm, NormFinder and Del-taCt. This apparent divergence is probably due to the statistical algorithms used to calculate stability. Genorm and Normfinder software have similar algorithms, which calculate the ΔCt values and the stability of each inter-nal reference gene according to the minimum Ct value in all the samples [43, 44]. Therefore, the alteration of the Fig. 4 Relative expression of miR166 and PtHB4 using validated
reference genes for normalization under plant regeneration process. The validated reference gene(s) used as normalization factors were one (U6-1, EIF4A, PP2A-2 alone) or two (U6-1+EIF4A and
U6-1+PP2A-2) of three best stable reference genes and two most unstable reference genes (5.8s and miR403)
Fig. 5 Relative expression of miR166 and PtHB4 using validated reference genes for normalization under AR regeneration. PP2A-2,
minimum Ct value will have a great influence on the sta-bility of expression of candidate reference genes. Besides that, BestKeeper program can calculate the standard deviation (SD) and variation coefficient (CV) values between the Ct values of each internal reference gene and the average of all Ct values, so the stability of candi-date reference gene depending on the dispersion degree of Ct values [45]. Thus, it has been recommended that more than two algorithms should be used for reference gene stability evaluation [43]. In this study, RankAggreg software was used to generate the final overall ranking of the tested reference genes based on the geometric mean of the weights of every gene calculated by each program. Through this comprehensive ranking analysis, U6-1,
EIF4A and PP2A-2 ranked as top three for all samples at the callus, seedling and plant stages. Thus, these genes would be the most suitable internal reference genes for the quantification of mRNAs and noncoding RNAs dur-ing the plant regeneration process of poplar.
However, the candidate reference genes selected for samples during the AR developmental stage were almost completely different. UBP ranked among the top three most stable genes in AR developmental stage but near the bottom at the callus stage using the four algorithms. In contrast, miR482 was the most stable gene in the AR developmental stage identified by Bestkeeper, but it was a highly unstable gene in other developmental stages. This is mainly because the development of adventitious roots is quite different from other biological processes, which include root primordium initiation, callus differentiation, adventitious root emergence and elongation process [46, 47]. During this process, tissue morphology and struc-ture have undergone dramatic changes, and gene expres-sion patterns varied tremendously [48–50]. Therefore, the genes expressed stably in other tissues or develop-mental stages may not have stable expression values dur-ing AR developmental stages. Comparatively, PP2A-2,
UBP and bHLH exhibited more stable expression in the AR developmental stage; thus, these genes could be suita-ble for normalization. These results indicate that different sets of internal reference genes may be assigned for dif-ferent tissues and developmental stages even in the same species. Furthermore, 5.8S, which is a commonly used reference gene for miRNA, and commonly used miR-NAs (miR171, miR482 and miR403) exhibited extremely unstable expression and were ranked among the four least stable genes during all developmental stages in pop-lar, indicating these miRNAs were more unstable than protein-coding genes and exhibited obvious tissue-spe-cific expression.
Traditionally, reference genes are typically cellular maintenance genes that play housekeeping roles in basic cellular components and functions [23]. In this study,
with the exception of two house-keeping genes (EIF4A
and PP2A-2), two noncoding RNA (U6-1 and U6-2) and a nontraditional reference gene (UBP) were also confirmed as the most suitable internal reference genes at the seed-ling and AR developmental stages. EIF4A and PP2A are typically used as reference genes for quantitative PCR and exhibit stable expression in different tissues, develop-mental stages or biotic and abiotic stress conditions in a number of species. For example, PP2A and EIF4A were reported as the best reference genes for all samples of various tissues and abiotic stress conditions in Sorghum [51], and PP2A was suitable for Switchgrass [52]. EIF4α
was also ranked as a stably expressed gene under most of the experimental conditions tested in Carica papaya
[53], different tissue/organs and fruit developmental stages in Litsea cubeba [54], and different tissues under abiotic stresses in Pennisetum glaucum [55]. PP2A house-keeping genes were superior references for normalization of gene expression data in different cotton plant organs [56], different color lines of cineraria during flower devel-opmental stages [57] and diurnal and developmental time-course in lettuce [58]. In addition, U6 is also one of the most commonly used reference genes in miRNA qRT-PCR and had the most stable expression in refer-ence gene selection studies [7, 25, 41]. In our study, U6-1
and U6-2 exhibited the most stable expression values at the callus and seedling stages, and U6-1 ranked among the top two at the plant stage. Therefore, as a noncod-ing RNA, U6 can be used not only as a good reference gene for RT-qPCR of miRNA alone but also a universal internal reference gene for mRNA quantification. The
UBP gene encodes a heterogeneous nuclear RNA bind-ing protein (hnRNP) that is involved in the regulation of pre-mRNA maturation at different levels and pre-mRNA splicing [59]. UBP is not a traditional internal reference gene, but its expression value did not change in various tissues and developmental stages in poplar [60]. UBP was the most stably expressed gene in the AR regeneration stage, and the stability of UBP was ranked at the top and middle positions at the plant and seedling stages. This finding indicates that UBP might be a reliable reference gene used in the AR and plant developmental stages in poplar.
Conclusion
The purpose of this study was to identify the most appro-priate reference genes for qRT-PCR of miRNAs and mRNAs during poplar regeneration and development. The expression stability of 18 candidate genes was vali-dated and evaluated across 38 tissue samples from four developmental stages of 84K poplar using four algo-rithms. The results demonstrated that EIF4A and U6-2
were best for seedling stage samples. PP2A-2 and U6-1
were best for the plant stage, and U6-1, EIF4A and PP2A
-2 were the top three reference genes during the plant regeneration process in poplar. In addition, PP2A-2 and
UBP or PP2A-2 and bHLH were the best combination as reference genes in the AR regeneration stage. This work will benefit future studies of expression and function analysis of miRNAs and their target genes in poplar.
Methods
Plant materials and tissue harvesting
The seedlings and plants of 84K poplar (Populus alba×Populus glandulosa) were grown in a tissue cul-ture room under long-day conditions (16 h light/8 h dark) at 25/22 °C (day/night). Based on the Agrobac-terium-mediated leaf disk transformation method [31, 32], the regeneration processes of poplar plants can be divided into three growth stages, including callus induc-tion and shoots differentiainduc-tion, seedlings on culture medium and plants in soil. Callus and shoot samples at different developmental stages were collected during shoot regeneration processes of 84K poplar [61], includ-ing callus induction stage at 4 days (Ca-4D), callus prolif-eration stage at 6 days (Ca-6D), callus expansion stage at 10 days 10D), callus transition stage at 12 days (Ca-12D), shoot emergence stage at 16 days (Shoot-16D) and the shoot elongation stage at 20 days (Shoot-20D). The samples from seedlings on the culture medium included the leaves (L-0.5M), stems (S-0.5M) and roots (R-0.5M) of 0.5-month-old seedlings as well as the leaves (L-1M), stems (S-1M) and roots (R-1M) of 1-month-old seed-lings. The tissues from 3-month-old plants grown in soil included the shoot apical meristem (SAM-3M), unex-panded leaves (YL-3M), the first and second exunex-panded leaves (ML-3M), the first to thirteenth internodes (N1-3M ~ N13-(N1-3M), the stem base (Base-(N1-3M), the roots (R-3M), and the root tips (RT-3M). The samples from the adventitious root (AR) developmental process included the AR induction stage at 18 h (AR-18H), the AR callus regeneration stage at 42 h and 60 h (42H and AR-60H), the AR emergence stage at 4 and 5 days (AR-4D and AR-5D) and the AR elongation stage at 7 and 11 days (AR-7D and AR-11D) [61, 62]. Samples with three rep-licates were collected, immediately frozen and stored in liquid nitrogen.
Total RNA extraction and cDNA synthesis
Total RNA was extracted using the LC sciences Total RNA Purification Kit (#TRK-1001, LC sciences, USA), which purifies all sizes of total RNA, including mRNA, ribosomal RNA, miRNA and other small RNA (20–200 nt), according to the previous methods with some modi-fication [63]. The powder ground from 50 mg sample in
liquid nitrogen was immediately transferred into a 2.0 ml RNase-free tube and added 600 μl extraction buffer with 6% Plant RNA Isolation Aid (Ambion, #Am9690). After shaking vigorously, the mixture was incubated in the ice for 15 min and then centrifuged at 12,000 rpm for 10 min at room temperate, by which the yield of total RNA could be improved. The remaining processes followed the man-ufacturer’s instructions. The integrity of total RNA was further assessed by 1.5% agarose gel electrophoresis, and the RNA concentration and purity were determined by NanoDrop™ 8000 Spectrophotometer (Thermo Fisher Scientific, USA). Only RNA samples with an A260/ A280 ratio between 1.9 and 2.1 and A260/A230 greater than 1.80 were used for cDNA synthesis. Then, 1.5 μg of total RNA was polyadenylated with ATP by poly (A) polymerase (PAP) at 37 °C for 1 h in a 20-μl reaction mix-ture using the Poly(A) Tailing Kit (#AM1350, Invitrogen, USA). Then, 10 μl (750 ng) of the E-PAP-treated total RNA was reverse transcribed with a poly(T) adapter uni-versal reverse transcription (RT)-primer (5′-AAC GAG ACG ACG ACA GAC TTT TTT TTT TTT TTTV-3′) using SuperScript III reverse transcriptase Kit (#18080-051, Invitrogen, USA) following the manufacturer’s instruc-tion. The cDNA was diluted 20-fold with nuclease-free water for qRT-PCR.
Selection of candidate reference genes and primers design
through sequencing. The primers (Table 1) were designed using oligo 7.0 software (Molecular Biology Insights, USA) based on the following criteria: primer lengths of 20-28 bp, GC contents of 45–55%, melting temperature (TM) of 60–63 °C and amplicon length of 100-250 bp.
Quantitative real‑time PCR analysis
Quantitative real-time PCR was conducted using LightCycler® 96 Plates and performed on the LightCycler® 480 System (Roche Molecular Systems, Germany). The reaction mixture contained 10 μl KAPA SYBR FAST qPCR Master Mix (# K4601, KAPA Biosys-tems, USA), 2 μl 20-fold diluted cDNA, 0.4 µM of each forward and reverse primer (Table 1) and ddH2O in a final volume of 20 μl. Amplifications were performed with the following program: 95 °C for 3 s; 40 cycles of 95 °C for 10 s, 60 °C for 30 s, 72 °C for 3 s; and melting curve analysis conditions (95 °C for 5 s, 65 °C increased to 95 °C with temperature increment of 0.11 °C every 1 s). No-template reactions were used as negative controls, and each sample was assessed in four technical replicates. Using a series of 10-fold diluted cDNA as templates, the standard curves were generated for each candidate ref-erence gene. The correlation coefficient (R2) and slope were obtained from the linear regression model cre-ated by the LightCycle 480 system, and the PCR ampli-fication efficiency (E) was calculated using the formulas
E = 10−1/slope− 1.
Stability analysis for the candidate reference genes
To visualize the expression stability of the 18 candidate reference genes, the raw cycle threshold (Ct) values from different tissues and developmental stages were produced and calculated statistically by box plots and five different programs and algorithms, including geNorm [43], Nor-mFinder [44], BestKeeper [45], the Delta CT method [66, 67] and the RankAggreg software [68]. The geNorm algo-rithm can calculate the average expression stability value (M), which is defined as the average pairwise variation in a particular gene with all other potential reference genes. The threshold of M value was set as 1.5, and genes with lowest M values exhibit the most stable expression. Addi-tionally, geNorm also calculates the pairwise variation (Vn+ Vn+1) value that determines the optimal number of reference genes for accurate normalization with a cut-off value of Vn+1 < 0.15 [43]. The NormFinder program uses an ANOVA-based model to consider intra- and inter-group variation in expression levels to calculate a stabil-ity value (SV) for expression, and a lower SV indicates increased stability [44]. Bestkeeper is an excel-based tool that determines the stability ranking of reference genes based on the coefficient of variance (CV) and the stand-ard deviation (SD) of the average Ct values. The most
stable gene exhibits the lowest CV ± SD value, and genes with SD higher than 1 were considered unacceptable and were excluded [45]. The Delta Ct method compares the relative expression of ‘pairs of genes’ within each sample. The stability of the reference gene is ranked according to a ‘process of elimination’ technique, by which genes can be compared against one another and either selected or eliminated on the basis of ΔCt among samples [66]. Finally, the raw Ct values of each gene were used to cal-culate the comprehensive ranking of reference genes using the RankAggreg software [68], which was based on the ranking of candidate references obtained from the four programs mentioned above. The program assigns an appropriate weight to an individual gene and calculates the geometric mean of the weight, providing an overall comprehensive ranking.
Validation of identified reference genes
To examine the expression stability of potential reference genes, the relative expression levels of miR166 and its target gene PtHB4 were analyzed in various tissues and AR developmental stages in poplar. The relative expres-sion levels were normalized separately to the most sta-ble and least stasta-ble reference genes analyzed by the four algorithms. The qRT-PCR amplification conditions of miRNA and genes were the same as described above. The relative expression levels of these genes were calculated according to the 2−∆∆Ct method and presented as fold-change [69].
Additional files
Additional file 1: Fig. S1. The melting curves of candidate reference genes. Fig. S2. The PCR amplification specificities of candidate reference genes detected by agarose gel electrophoresis.
Additional file 2: Fig. S3. The sequence similarity of candidate reference genes compared between 84K poplar and Populus trichocarpa.
Additional file 3: Table S1. The average of Ct values in different tissues during plant and AR regeneration of Poplar. Table S2. The normalized expression values of 14 candidate reference genes in various vegetative and reproductive tissues at different developmental stages of Populus tremula.
Authors’ contributions
FT and ML designed the study. LC and FT designed the primers used for qPCR and cloned the sequences. WS and LW collected the tissues of plants and AR regeneration stages. FT, LC and XJ performed qPCR analysis. FT and ML wrote the manuscript. All of the authors carefully checked. All authors read and approved the final manuscript.
Author details
1 State Key Laboratory of Tree Genetics and Breeding, Key Laboratory
of Tree Breeding and Cultivation of the National Forestry and Grassland Administration, Research Institute of Forestry, Chinese Academy of Forestry, Beijing 100091, China. 2 Co-Innovation Center for Sustainable Forestry
in Southern China, Nanjing Forestry University, Nanjing 210037, China. 3 Key
of Horticulture and Forestry Sciences, Huazhong Agricultural University, Wuhan 430070, China.
Acknowledgements
We thank Yanqiu Zhao and Jinnan Wang of State Key Laboratory of Tree Genetics and Breeding, Research Institute of Forestry, Chinese Academy of Forestry for their valuable plant material and technical contribution.
Competing interests
The authors declare that they have no competing interests.
Availability of data and materials
The datasets supporting the conclusions of this article are included within the article and its additional files.
Funding
This work was supported by the National Natural Science Foundation of China (31700592), and the Fundamental Research Funds for the Central Non-profit Research Institution of CAF (CAFYBB2017 QA003).
Publisher’s Note
Springer Nature remains neutral with regard to jurisdictional claims in pub-lished maps and institutional affiliations.
Received: 17 November 2018 Accepted: 1 April 2019
References
1. Vanguilder HD, Vrana KE, Freeman WM. Twenty-five years of quantitative PCR for gene expression analysis. Biotechniques. 2008;44(5):619–26. 2. Derveaux S, Vandesompele J, Hellemans J. How to do successful gene
expression analysis using real-time PCR. Methods. 2010;50(4):227–30. 3. Huggett J, Dheda K, Bustin S, Zumla A. Real-time RT-PCR normalisation;
strategies and considerations. Genes Immun. 2005;6(4):279–84. 4. Nolan T, Hands RE, Bustin SA. Quantification of mRNA using real-time
RT-PCR. Nat Protoc. 2006;1:1559.
5. Brunner AM, Yakovlev IA, Strauss SH. Validating internal controls for quan-titative plant gene expression studies. BMC Plant Biol. 2004;4:14. 6. Wang C, Cui H-M, Huang T-H, Liu T-K, Hou X-L, Li Y. Identification and
vali-dation of reference genes for RT-qPCR analysis in non-heading Chinese cabbage flowers. Front Plant Sci. 2016;7:811.
7. Luo M, Gao Z, Li H, Li Q, Zhang C, Xu W, Song S, Ma C, Wang S. Selection of reference genes for miRNA qRT-PCR under abiotic stress in grapevine. Sci Rep. 2018;8(1):4444.
8. Jones-Rhoades MW, Bartel DP, Bartel B. microRNAs and their regulatory roles in plants. Annu Rev Plant Biol. 2006;57:19–53.
9. Voinnet O. Origin, biogenesis, and activity of plant microRNAs. Cell. 2009;136(4):669–87.
10. Djuranovic S, Nahvi A, Green R. miRNA-mediated gene silencing by translational repression followed by mRNA deadenylation and decay. Science. 2012;336(6078):237–40.
11. Laufs P, Peaucelle A, Morin H, Traas J. MicroRNA regulation of the CUC genes is required for boundary size control in Arabidopsis meristems. Development. 2004;131(17):4311–22.
12. Aukerman MJ, Sakai H. Regulation of flowering time and floral organ identity by a microRNA and its APETALA2-like target genes. Plant Cell. 2003;15(11):2730–41.
13. Li B, Qin Y, Duan H, Yin W, Xia X. Genome-wide characterization of new and drought stress responsive microRNAs in Populus euphratica. J Exp Bot. 2011;62(11):3765–79.
14. Lu S, Li Q, Wei H, Chang M-J, Tunlaya-Anukit S, Kim H, Liu J, Song J, Sun Y-H, Yuan L, et al. Ptr-miR397a is a negative regulator of laccase genes affecting lignin content in Populus trichocarpa. Proc Natl Acad Sci. 2013;110(26):10848–53.
15. Guo C, Xu Y, Shi M, Lai Y, Wu X, Wang H, Zhu Z, Poethig RS, Wu G. Repression of miR156 by miR159 regulates the timing of the juvenile-to-adult transition in Arabidopsis. Plant Cell. 2017;29(6):1293–304.
16. Chen C, Ridzon DA, Broomer AJ, Zhou Z, Lee DH, Nguyen JT, Barbisin M, Xu NL, Mahuvakar VR, Andersen MR, et al. Real-time quanti-fication of microRNAs by stem-loop RT-PCR. Nucleic Acids Res. 2005;33(20):e179.
17. Hurteau GJ, Spivack SD, Brock GJ. Real-time quantification of miRNAs and mRNAs employing universal reverse transcription. In: MicroRNAs: from basic science to disease biology. 2008. p. 283–92.
18. Shi R, Chiang VL. Facile means for quantifying microRNA expression by real-time PCR. Biotechniques. 2005;39(4):519–25.
19. Hurteau GJ, Spivack SD, Brock GJ. Report potential mRNA degradation targets of hsa-miR-200c, identified using informatics and qRT-PCR. Cell Cycle. 2006;5(17):1951–6.
20. Chen C, Tan R, Wong L, Fekete R, Halsey J. Quantitation of microR-NAs by real-time RT-qPCR. In: Park DJ, editor. PCR protocols. Totowa: Humana Press; 2011. p. 113–34.
21. Jain M, Nijhawan A, Tyagi AK, Khurana JP. Validation of housekeep-ing genes as internal control for studyhousekeep-ing gene expression in rice by quantitative real-time PCR. Biochem Biophys Res Commun. 2006;345(2):646–51.
22. Pettengill EA, Parmentier-Line C, Coleman GD. Evaluation of qPCR refer-ence genes in two genotypes of Populus for use in photoperiod and low-temperature studies. BMC Res Notes. 2012;5(1):366.
23. Ma R, Xu S, Zhao Y, Xia B, Wang R. Selection and validation of appropriate reference genes for quantitative real-time PCR analysis of gene expres-sion in Lycoris aurea. Front Plant Sci. 2016;7:536.
24. Yu LL, Zhong XL. Evaluation of suitable reference genes for normaliza-tion of microRNA expression by real-time reverse transcripnormaliza-tion PCR analysis during longan somatic embryogenesis. Plant Physiol Biochem. 2013;66(66C):20–5.
25. Yang Y, Zhang X, Chen Y, Guo J, Ling H, Gao S, Su Y, Que Y, Xu L. Selection of reference genes for normalization of microRNA expression by RT-qPCR in sugarcane buds under cold stress. Front Plant Sci. 2016;7:86.
26. Jansson S, Douglas CJ. Populus: a model system for plant biology. Annu Rev Plant Biol. 2007;58(1):435–58.
27. Tuskan GA, DiFazio S, Jansson S, Bohlmann J, Grigoriev I, Hellsten U, Put-nam N, Ralph S, Rombauts S, Salamov A, et al. The genome of black cot-tonwood, Populus trichocarpa (Torr. & Gray). Science. 2006;313:1596–604. 28. Fladung M, Kumar S, Ahuja MR. Genetic transformation of Populus geno-types with different chimaeric gene constructs: transformation efficiency and molecular analysis. Transgenic Res. 1997;6(2):111–21.
29. Busov VB, Brunner AM, Richard M, Sergei F, Lisa G, Sonali G, Strauss SH. Genetic transformation: a powerful tool for dissection of adaptive traits in trees. New Phytol. 2010;167(1):9–18.
30. Wang G, Castiglione S, Chen Y, Li L, Han Y, Tian Y, Gabriel DW, Han Y, Mang K, Sala F. Poplar (Populus nigra L.) plants transformed with a Bacillus thur-ingiensis toxin gene: insecticidal activity and genomic analysis. Transgenic Res. 1996;5(5):289–301.
31. De Block M. Factors influencing the tissue culture and the Agrobacterium tumefaciens-mediated transformation of hybrid aspen and poplar clones. Plant Physiol. 1990;93(3):1110–6.
32. Han KH, Meilan R, Ma C, Strauss SH. An Agrobacterium tumefaciens trans-formation protocol effective on a variety of cottonwood hybrids (genus Populus). Plant Cell Rep. 2000;19(3):315–20.
33. Puzey JR, Karger A, Axtell M, Kramer EM. Deep annotation of
Populus trichocarpa microRNAs from diverse tissue sets. PLoS ONE. 2012;7(3):e33034.
34. Zhu Y, Song D, Sun J, Wang X, Li L. PtrHB7, a class III HD-Zip gene, plays a critical role in regulation of vascular cambium differentiation in Populus. Mol Plant. 2013;6:1331–43.
35. Côté CL, Boileau F, Roy V, Ouellet M, Levasseur C, Morency M-J, Cooke JE, Séguin A, MacKay JJ. Gene family structure, expression and functional analysis of HD-Zip III genes in angiosperm and gymnosperm forest trees. BMC Plant Biol. 2010;10(1):273.
36. Brunner AM, Yakovlev IA, Strauss SH. Validating internal controls for quan-titative plant gene expression studies. BMC Plant Biol. 2004;4(1):14. https ://doi.org/10.1186/1471-2229-1184-1114.
•fast, convenient online submission •
thorough peer review by experienced researchers in your field • rapid publication on acceptance
• support for research data, including large and complex data types •
gold Open Access which fosters wider collaboration and increased citations maximum visibility for your research: over 100M website views per year •
At BMC, research is always in progress.
Learn more biomedcentral.com/submissions
Ready to submit your research? Choose BMC and benefit from: 38. Feng H, Huang X, Zhang Q, Wei G, Wang X, Kang Z. Selection of suitable
inner reference genes for relative quantification expression of microRNA in wheat. Plant Physiol Biochem. 2012;51(51):116–22.
39. Luo X, Shi T, Sun H, Song J, Ni Z, Gao Z. Selection of suitable inner refer-ence genes for normalisation of microRNA expression response to abiotic stresses by RT-qPCR in leaves, flowers and young stems of peach. Sci Hortic. 2014;165(3):281–7.
40. Kulcheski FR, Marcelino-Guimaraes FC, Nepomuceno AL, Abdelnoor RV, Margis R. The use of microRNAs as reference genes for quantitative poly-merase chain reaction in soybean. Anal Biochem. 2010;406(2):185–92. 41. Song H, Zhang X, Shi C, Wang S, Wu A, Wei C. Selection and verification of
candidate reference genes for mature microRNA expression by quantita-tive RT-PCR in the tea plant (Camellia sinensis). Genes. 2016;7(6):25. 42. Xu J, Li J, Cui L, Zhang T, Wu Z, Zhu P-Y, Meng Y-J, Zhang K-J, Yu X-Q, Lou
Q-F, et al. New insights into the roles of cucumber TIR1 homologs and miR393 in regulating fruit/seed set development and leaf morphogen-esis. BMC Plant Biol. 2017;17(1):130.
43. Vandesompele J, De Preter K, Pattyn F, Poppe B, Van Roy N, De Paepe A, Speleman F. Accurate normalization of real-time quantitative RT-PCR data by geometric averaging of multiple internal control genes. Genome Biol. 2002;3(7):RESEARCH0034.
44. Andersen CL, Jensen JL, Ørntoft TF. Normalization of real-time quantita-tive reverse transcription-PCR data: a model-based variance estimation approach to identify genes suited for normalization, applied to bladder and colon cancer data sets. Cancer Res. 2004;64(15):5245–50. 45. Pfaffl MW, Tichopad A, Prgomet C, Neuvians TP. Determination of stable
housekeeping genes, differentially regulated target genes and sample integrity: BestKeeper–Excel-based tool using pair-wise correlations. Biotech Lett. 2004;26(6):509–15.
46. Leguã© V, Rigal A, Bhalerao RP. Adventitious root formation in tree species: involvement of transcription factors. Physiol Plant. 2014;151(2):192–8.
47. Bellini C, Pacurar DI, Perrone I. Adventitious roots and lateral roots: simi-larities and differences. Annu Rev Plant Biol. 2014;65(65):639–66. 48. Monika B, Leonel VZ, Wenbin L, Deborah C, Sederoff RR, Clapham DH,
Sara VA. Microarray analyses of gene expression during adventitious root development in Pinus contorta. Plant Physiol. 2004;135(3):1526–39. 49. Villacorta-Martín C, Sánchez-García AB, Villanova J, Cano A, Rhee MVD,
Haan JD, Acosta M, Passarinho P, Pérez-Pérez JM. Gene expression profil-ing durprofil-ing adventitious root formation in carnation stem cuttprofil-ings. BMC Genomics. 2015;16(1):1–18.
50. Li YH, Zhang HN, Wu QS, Muday GK. Transcriptional sequencing and analysis of major genes involved in the adventitious root formation of mango cotyledon segments. Planta. 2017;245(6):1193–213. 51. Sudhakar Reddy P, Srinivas Reddy D, Sivasakthi K, Bhatnagar-Mathur P,
Vadez V, Sharma KK. Evaluation of sorghum [Sorghum bicolor (L.)] refer-ence genes in various tissues and under abiotic stress conditions for quantitative real-time PCR data normalization. Front Plant Sci. 2016;7:529. 52. Gimeno J, Eattock N, Van Deynze A, Blumwald E. Selection and
valida-tion of reference genes for gene expression analysis in switchgrass (Panicum virgatum) using quantitative real-time RT-PCR. PLoS ONE. 2014;9(3):e91474.
53. Zhu X, Li X, Chen W, Chen J, Lu W, Chen L, Fu D. Evaluation of new reference genes in papaya for accurate transcript normalization under different experimental conditions. PLoS ONE. 2012;7(8):e44405.
54. Lin L, Han X, Chen Y, Wu Q, Wang Y. Identification of appropriate reference genes for normalizing transcript expression by quantitative real-time PCR in Litsea cubeba. Mol Genet Genomics. 2013;288(12):727–37.
55. Reddy PS, Reddy DS, Sharma KK, Bhatnagar-Mathur P, Vadez V. Cloning and validation of reference genes for normalization of gene expression studies in pearl millet [Pennisetum glaucum (L.) R. Br.] by quantitative real-time PCR. Plant Gene. 2015;1(1):35–42.
56. Artico S, Nardeli SM, Brilhante O, Grossi-de-Sa MF, Alves-Ferreira M. Identi-fication and evaluation of new reference genes in Gossypium hirsutum for accurate normalization of real-time quantitative RT-PCR data. BMC Plant Biol. 2010;10(1):49.
57. Jin X, Fu J, Dai S, Sun Y, Hong Y. Reference gene selection for qPCR analy-sis in cineraria developing flowers. Sci Hortic. 2013;153(153):64–70. 58. Sgamma T, Pape J, Massiah A, Jackson S. Selection of reference genes
for diurnal and developmental time-course real-time PCR expression analyses in lettuce. Plant Methods. 2016;12(1):21.
59. Lambermon MHL, Simpson GG, Kirk DAW, Hemmingsmieszczak M, Klahre U, Filipowicz W. UBP1, a novel hnRNP-like protein that functions at multiple steps of higher plant nuclear pre-mRNA maturation. EMBO J. 2014;19(7):1638–49.
60. David S, Chanaka M, Sergiu N, Nicolas D, Yao-Cheng L, Andreas S, Van De Yves P, Stefan J, Hvidsten TR, Street NR. The plant genome integrative explorer resource: PlantGenIE.org. New Phytol. 2015;208(4):1149–56. 61. Liu B, Zhang J, Wang L, Li J, Zheng H, Chen J, Lu M. A survey of Populus
PIN-FORMED family genes reveals their diversified expression patterns. J Exp Bot. 2014;65(9):2437–48.
62. Shu W, Zhou H, Jiang C, Zhao S, Wang L, Li Q, Yang Z, Groover A, Lu M-Z. The auxin receptor TIR1 homolog (PagFBL1) regulates adventitious root-ing through interactions with Aux/IAA28 in Populus. Plant Biotechnol J. 2018;17:338–49.
63. Tang F, Wei H, Zhao S, Wang L, Zheng H, Lu M. Identification of microR-NAs involved in regeneration of the secondary vascular system in Populus tomentosa Carr. Front Plant Sci. 2016;7:724.
64. Sang J, Wang Z, Li M, Cao J, Niu G, Xia L, Zou D, Wang F, Xu X, Han X, et al. ICG: a wiki-driven knowledgebase of internal control genes for RT-qPCR normalization. Nucleic Acids Res. 2018;46(D1):D121–6.
65. Robinson KM, Delhomme N, Mähler N, Schiffthaler B, Önskog J, Albrect-sen BR, Ingvarsson PK, Hvidsten TR, Jansson S, Street NR. Populus tremula
(European aspen) shows no evidence of sexual dimorphism. BMC Plant Biol. 2014;14(1):276.
66. Silver N, Best S, Jiang J, Thein SL. Selection of housekeeping genes for gene expression studies in human reticulocytes using real-time PCR. BMC Mol Biol. 2006;7(1):33.
67. Schmittgen TD, Livak KJ. Analyzing real-time PCR data by the compara-tive CT method. Nat Protoc. 2008;3:1101.
68. Pihur V, Datta S, Datta S. RankAggreg, an R package for weighted rank aggregation. BMC Bioinform. 2009;10(1):62.
69. Livak KJ, Schmittgen TD. Analysis of relative gene expression data using real-time quantitative PCR and the 2−ΔΔCT method. Methods.