R E S E A R C H A R T I C L E
Open Access
Two dimensional gel phosphoproteome of
peripheral blood mononuclear cells: comparison
between two enrichment methods
Maria Teresa Rocchetti
1,2, Michela Alfarano
2, Leonarda Varraso
3, Salvatore Di Paolo
4, Massimo Papale
2,5,
Elena Ranieri
2,5, Giuseppe Grandaliano
3and Loreto Gesualdo
1*Abstract
Background:Protein phosphorylation is considered a key event in signal transduction. Peripheral blood mononuclear cells (PBMCs) are a critical component of the immune system. The analysis of PBMCs phosphoproteome might help elucidate the signaling pathways essential to their biological role in health,
immunological diseases and cancer. Enrichment of phosphoproteins becomes a prerequisite for phosphoproteome analysis and conventionally requires a multi-step procedure and sophisticated equipments. In this study, we standardized 2D-PAGE phosphoproteome analysis of PBMCs and compared two phosphoprotein enrichment methods, lanthanum chloride precipitation and affinity micro-column. Further, the different specificity for PBMCs phosphorylated proteins of each method was investigated.
Results:PBMCs were isolated from fresh whole blood of ten healthy donors. PBMCs phosphoproteins were enriched either by phosphoprotein precipitation using lanthanum chloride, with an overall yield of 8.9 ± 4.7%, or by using an affinity micro-column, with a lower yield of 3.2 ± 1.6% (p = 0.05). Image analysis of Sypro-stained analytical 2D-PAGE gels detected 554 ± 68 protein spots for the lanthanum pattern [inter-assay coefficient of variation (CV) = 27.0%, intra-assay CV = 10.7%] and 575 ± 35 protein spots for the micro-column pattern (inter-assay CV = 26.8%; intra-assay CV = 11.0%) (p = 0.6), with 57% match of the spots detected by the 2 approaches. 1D gel electrophoresis and western blot analyses of the supernatants suggested a better lanthanum ions capability to deplete phosphoproteins in a PBMCs protein lysate compared to the affinity micro-column. On the other hand, 1D gel electrophoresis analysis of dephosphorylated PBMCs protein lysate revealed a relatively higher unspecificity for the lanthanum ions compared to affinity micro-column. Filamin-A, coronin 1A, pyruvate kinase isozymes M1/M2 and ficolin-1 were considerably more expressed in the lanthanum phosphoprotein pattern. Interestingly, ficolin-1 had not been reported in 2DE-PBMCs proteome profiles so far.
Conclusion:Our results describe the differences and the validity of phosphoprotein enrichment methods and provide two successful and complementary approaches for the 2DE phosphoproteome analysis of PBMCs.
Keywords:2DE, Lanthanum, PBMCs, Phosphoproteome, Phosphoprotein enrichment
* Correspondence:loreto.gesualdo@uniba.it
1Department of Emergency and Organ Transplantation (DETO), Nephrology,
Dialysis and Transplantation Unit, University of Bari Aldo Moro, Piazza G. Cesare, 11, Bari 70124, Italy
Full list of author information is available at the end of the article
Introduction
Protein phosphorylation represents the main post-translational modification, which modulates the functional activity of proteins in most cellular processes. Around 30-50% proteins are estimated to be reversibly phosphorylated at some point during their lifespan, but only 1% of cellular proteins are phosphorylated at any given time [1]. Given the role of phosphorylation processes in the regulation of most protein activities and properties, its derangement is expected to contribute to the genesis and progression of diseases and, conversely, most of phosphorylated proteins may be potential targets for drug therapy of diseases.
Phosphoproteome analysis is a challenging task essen-tially because of the low stoichiometry of phosphoryl-ation and the low abundance of phosphoproteins within cells at any given time. Peripheral blood mononuclear cells (PBMCs) are a critical component of the immune system and include lymphocytes, monocytes and den-dritic cells. Defining the 2D-map of the phosphoproteins and their isoforms offers an exceptional tool for protein cataloguing, which could reveal the signaling pathways essential to maintain the molecular programs of PBMCs useful for the study of all diseases in which the immuno-logical system is activated [2].
In recent years, gel-based phosphoproteomic analysis used a phospho-specific fluorescent dye which detected phosphoproteins in the presence of the entire protein content [3]. The main limitation of this analytical strategy is the high background of non-phosphorylated proteins, which decreases the sensitivity of phosphoprotein analysis. Therefore, preliminary enrichment of phosphoproteins from complex protein mixtures is highly recommended to reduce sample complexity and thus enhance the accessible dynamic range. Most of the available phosphoprotein enrichment methods focused on chromatographic ap-proaches in which target proteins are separated by metal ions caged in immobilized metal ion affinity chrom-atographic (IMAC) resin, or by immunoaffinity using antibodies directed against Serine, phospho-Threonine and phospho-Tyrosine [4]. Both techniques would represent suitable approaches for proteomic studies; however, they present some limitations, such as a rather poor phosphoprotein specificity for IMAC (eluted proteins are > of 30% of the total amount of ana-lyzed proteins) [5], and the high costs for protein purifi-cation in a multi milligram scale for the immunoaffinity isolation with anti-phospho aminoacid antibodies.
With this scenario in mind, in the attempt to analyze the phosphoproteome of PBMCs by 2D-PAGE analysis, we enriched the phosphoproteins applying a simple pre-cipitation by lanthanum chloride [6]. Then, the 2DE phosphoproteome map of PBMCs obtained by this ap-proach was compared with the one obtained by PBMCs phosphoproteins isolated by commercially available affinity
micro-columns. The 2 enrichment methods display an apparently different chemistry of binding, which would imply qualitative and quantitative differences in phos-phoproteins. It is known that lanthanum ions strongly bind the phosphate group. When lanthanum chloride is added to a protein solution, a metal-phosphoprotein chelate forms (and precipitates), in which the negatively charged oxygens of the phospho-residues act as a che-lating agent to a metal ion, La3+. Conversely, the bind-ing of phosphoproteins to the affinity micro-column takes place onto a solid support, a functionalized resin designed to bind the protein phospho-residues. A de-scription of the validity of the two enrichment methods is also reported.
Results and discussion
a cytoplasmic protein involved in T cell homeostasis and actin cytoskeleton organization [8]; pyruvate kinase isoenzyme M1/M2, a kinase involved in carbohydrate degradation [9]; and ficolin-1, a protein expressed on the cell surface of monocytes and granulocytes, which binds activated but not resting T lymphocytes and is a recognition molecule for the lectin complement pathway
[10]. Interestingly, ficolin-1 had not been reported in 2DE PBMCs’proteome profiles published so far [11-14], thereby highlighting the usefulness of enrichment ap-proaches for in-depth phosphoprotein analysis.
To further compare the two enrichment methods and to assess their specificity for phosphorylated proteins, phosphoproteins isolated with either method were analyzed MW
kDa
45
24
18 66
14 116
pI 3-10 pI 3-10
45
24
18 66
14 116
A B
MW kDa
3 3
zoom
2 2
2 3 1
4
2 3 1
4
4 4
1 1
A B
Figure 12DE phosphoproteome of PBMCs.Representative 2D gel of PBMCs phosphoproteome obtained by isolation of phosphoproteins from total cell lysate using LaCl3(A)or affinity micro-columns(B). MW markers:PeppermintStick™Phosphoprotein MW Standards (Invitrogen™).
The arrows indicate four protein spots more expressed in the 2D gel of PBMCs phosphoproteome obtained by isolation of phosphoproteins by LaCl3, identified by MALDI-TOF-MS/MS as filamin-A (1), coronin-1A (2), pyruvate kinase isoenzyme M1/M2 (3), and ficolin-1 (4) (Table 1).
Table 1 Phosphorylated PBMCs’proteins differentially expressed between the two phosphoprotein pattern (LaCl3versusaffinity micro-column)
Protein name Accession number
Molecular weight (Da)
Mascot score
Seq. Cov (%)
Phosphorylation sites
P valuea
LaCl3vscolumn (fold change)
Filamin-A (fragment) P21333 280739 74 16 17b+ 147c 0.02
(4.0)
Coronin-1A P31146 51678 171 40 2b+ 9c 0.02
(15.0)
Pyruvate kinase isozymes M1/M2 (fragment)
P14618 57937 92 21 5b+ 28c 0.02
(3950)
Ficolin-1 O00602 35078 78 17 2b 0.02
(1.92) a
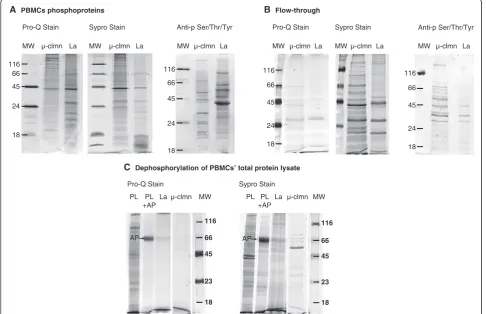
by 1D gel electrophoresis and sequentially stained with Pro-Q® Diamond dye, the gold standard for gel-based de-tection of phosphoproteins, and subsequently, the gels were counter stained with SYPRO Ruby dye, for the detection of all proteins, and acquired. The comparison of the two lanes stained with Pro-Q (i.e. lanthanumvsmicro-column enrichment) showed marked differences in the band distribution in the medium-lower part of the gel, where the lanthanum profile seemed to guarantee a higher yield (Figure 2A), which likely resembled 2DE pattern differ-ences (Figures 1 and 2A). On the other hand, the SYPRO-stained profile, which detected total proteins, was roughly superimposable, in terms of number and distribution of bands, to the Pro-Q stained profile (Figure 2A) for each of the two methods, suggesting a quite good level of phospho-specificity of both enrichment approaches. In addition, the two phosphoprotein patterns were analyzed by Western blot using an anti-phospho-Serine/Threonine/ Tyrosine monoclonal antibody (Figure 2A) which revealed
differences in the intensity rather than in the number of detected bands (almost 60% match of bands which showed different intensities) between the two enrichment methods, resembling the findings of 2DE comparative analysis, in spite of the technical differences between the two analytical strategies (2DE and Western blot).
To assess the validity of the two enrichment strategies for PBMCs phosphoproteome analysis we wondered whether the supernatant of the precipitation was really depleted in phosphoproteins. Sequential staining with ProQ and Sypro dyes of the supernatants (flow-through) derived from lanthanum or micro-column treatment of two identical aliquots of the same protein lysate, pointed out the inability of both strategies to completely deplete phosphoproteins of the PBMCs’protein sample (Figure 2B), although suggesting a better lanthanum ions capability.
Specificity of both enrichment methods was further in-vestigated with dephosphorylated PBMCs protein sam-ples. Two identical aliquots of a pool of PBMCs’proteins
C Dephosphorylation of PBMCs’ total protein lysate
Pro-Q Stain µ-clmn La MW PL
+AP PL
45 66
23
18 116
AP
Sypro Stain µ-clmn La MW PL
+AP PL
AP
45 66
23
18 116
A PBMCs phosphoproteins B Flow-through
µ-clmn La 116
µ-clmn La
66 45 24 116
18
µ-clmn La MW
Pro-Q Stain Sypro Stain Pro-Q Stain
µ-clmn La MW
Sypro Stain MW
66 45 24 18
MW µ-clmn La Anti-p Ser/Thr/Tyr MW
116 66 45 24 18
La µ-clmn MW
Anti-p Ser/Thr/Tyr
66 45 24 116
18
Figure 2Comparison between lanthanum and micro-column PBMCs’phosphoprotein profiles. (A)Sequential staining of PBMCs’ phosphoproteins enriched by LaCl3(La) and micro-column (μ-clmn) and Western blot investigation of phosphoproteins using an
were incubated with alkaline phosphatase, the phosphat-ase with the broadest substrate specificity [15]. After de-phosphorylation, the two aliquots were adjusted to pH7.4 (which was the pH of PBMCs’protein lysate) and immediately treated with lanthanum chloride and the micro-column, respectively, to isolate phosphoproteins. The entire isolated protein contents were separated on 1D-gel (Figure 2C) and sequentially stained with ProQ and Sypro dyes. From Sypro stained gel, both isolation strategies showed a few not-phosphorylated protein bands, which revealed some degree of unspecificity for both enrichment strategies (Figure 2C). The yield of pro-teins isolated from dephosphorylated samples was 0,5% for micro-column and 2% for lanthanum chloride, sug-gesting a relatively higher unspecificity for the latter en-richment method, as we expected. Scheme 1 depicted the overall picture of the study design and the collected results.
Multiple factors may account for the differences in the phosphoprotein micro-column pattern compared to lan-thanum. Since the present study was not intended to
explore the mechanisms underlying the different specifi-city of the two enrichment methods, and no detailed in-formation on the micro-column procedure is provided by the manufacturer, we may just suppose that a com-bination of chemical (multiple phosphorylations; pI; basic group of aminoacids and other PTMs) and stereo-chemical features could differentially contribute to the phosphoproteins capture. For instance, we may suppose that the protein steric hindrance can influence the qual-ity of the phosphoproteins bound by the phospho-active site immobilized to the resin-column more than the free-lanthanum ions. Then, we may suppose that the easy accessibility of the lanthanum ions (dissolved in the protein solution) compared to the phospho-active sites bound to the column and the dynamics of the phospho-protein isolation procedures (phospho-protein sample and lan-thanum ions mixture vortexing versus protein sample run through the column) can influence the total amount of isolated phosphoproteins, and therefore their relative yields. Therefore, the two strategies could be complemen-tary for an in-depth PBMCs phosphoproteome analysis.
10 Healty Individuals
Blood Collection and PBMC Isolation
4 4 2
Biological replicates
Phosphoproteins by LaCl3 (yields:8.9 4.7%)
Phosphoproteins byµ-column (yields:3.2 1.6%)
2D Gel Electrophoresis Analysis Protein Extraction
Pooled samples
1D Gel Electrophoresis, WB, 2D gel for MS/MS analysis
Protein Extraction Protein Extraction Protein Extraction
Pooled samples
Dephosphorylation by alkaline phosphatase
Phosphoproteins by LaCl3 (yields: 2.0%)
Phosphoproteins byµ-column (yields: 0,5%)
Phosphoproteins by LaCl3
Phosphoproteins by µ-column
1D Gel Electrophoresis Protein Spots:
554 68 (CV=27.0%)
ProteinSpots: 575 35 (CV=26.8%)
Main results:
Relatively higher unspecificity for LaCl3 phosphoproteins isolation method Four proteins spots considerably more
expressed in the LaCl3phosphoprotein pattern identified by MS/MS analysis
Main results:
Good level of phospho-specificity of both enrichment approaches Main results:
Conclusions
In conclusion, an in-depth analysis of intracellular path-ways of PBMCs would be greatly favored by a thorough identification of phosphoproteins, and their isoforms, in the the 250-10 kDa mass range. This implies the need for a standardization of 2DE maps of PBMCs phospho-proteins. The present data show that phosphoprotein isolation by lanthanum ions and by micro-column are both a suitable preliminary step for 2DE phosphopro-teome analysis of PBMCs, which is here described for the first time. In our experience, phosphoprotein isola-tion by micro-column provides a poorer but less unspe-cific enrichment strategy compared to lanthanum ions. On the other hand, lanthanum ions, besides to the rela-tive higher unspecificity compared to the micro-column, presents the advantages of higher phosphoproteins yields, lack of limitations in the amount of protein load-ing, cheapness, ease of use, and rapidity of the entire en-richment procedure.
Methods Materials
Acetonitrile (ACN), acetone, trifluoroacetic acid (TFA), trichloroacetic acid (TCA), DL-dithiothreitol (DTT), iodoacetamide (IAA), glycine, EDTA, Tris, endonuclease, phosphoprotease and protease inhibitors, lanthanum chloride, potassium dihydrogen phosphate, Coomassie Blue G-250, imidazole, alkaline phosphatase were pur-chased from Sigma (Sigma Aldrich St.Louis, MO, USA); urea, CHAPS, SDS, glycerol, acrylamide, ampholine, and Ficoll-Paque™were purchased from GE healthcare (Upp-sala, Sweden); Agarose, Pro-Q® Diamond Phosphopro-tein Enrichment kit, Pro-Q® Diamond dye, SYPRO® Ruby and PeppermintStick™Phosphoprotein Molecular Weight Standards were from Invitrogen™ (Carlsbad, CA); pi-perazine di-acrylamide (PDA), TEMED, Bio Rad Protein Assay, IPG strips, were from Bio-Rad Laboratories (Hercules, CA). Trypsin (sequencing grade modified) was from Promega (Madison, Wisconsin, USA). All sol-vents used were Ultra-Resi-Analyzed grade.
Peripheral blood mononuclear cells isolation
PBMCs were isolated from whole blood (29,7 ± 2,3 mL) collected in lithium heparin from ten healthy individuals. The volunteers were ascertained as healthy by a general medical examination and were not taking drugs. The study was approved by the local ethical committee and an informed consent was collected from each voluntary blood donor. Isolation of PBMCs was performed within 2 hours after blood was drawn from healthy donors. Fresh blood was diluted with an equal volume of PBS pH 7.4/1 mM EDTA and PBMCs were isolated by dens-ity separation over a Ficoll-Paque gradient (460xg for 30 min). PBMC were then washed once with PBS, and
twice with physiological saline solution (0.9% NaCl). Cells were then counted and their viability was assessed by trypan blue exclusion (>90% PBMC were viable). PBMCs numbers were obtained from each donation in a mean of 41 ± 13 × 106cells. All procedure involving cells isolation were conducted under sterile conditions. Total proteins were extracted by adding 500 μL RIPA buffer with 10 μL endonucleases, and 5 μL phosphoprotease and protease inhibitors to PBMC pellet. After the pellet was incubated on ice for 30 minutes, the cell lysate was centrifuged at 10,000xg at 4°C for 20 minutes. Protein concentration was assayed by Bradford method and pro-teins were stored at -80°C until use. Eight of ten PBMCs protein samples were singularly used for 2DE analysis, and all ten PBMCs protein samples were pooled for 1D gel electrophoresis analyses. All experiments were run in triplicate unless otherwise noted.
Isolation of phosphoproteins
In the first approach, the procedure described by Pink and coworkers [6] was adapted to enrich the phospho-proteome of 4 randomly chosen PBMCs samples. Briefly, 1 M lanthanum chloride and 2 M potassium dihydrogen phosphate were added to the solution of total cellular proteins (0.5 - 2 mg) to precipitate phosphoproteins as described [6]. After the washing steps, the phosphopro-teins were eluted from the pellet using a mixture of 25% 4 M Imidazole and 75% sample buffer (8 M urea, 2 M thiourea, 2% CHAPS, 1% DTT in water) and purified by cold acetone/20% TCA in water solution. Phosphopro-teins were finally resuspended in IEF buffer [8 M urea, 2% w/v CHAPS, 0.5% ampholine (pH 3-10), 18 mM DTT, 0.002% w/v bromophenol blue (BBP)].
In the second approach, phosphoproteins of 4 PBMCs samples, different from those used for lanthanum ions precipitation, were enriched by Pro-Q® Diamond Phospho-protein Enrichment kit of Invitrogen. PhosphoPhospho-proteins were isolated according to the manufacturer’s protocol for 0.5-1 mg of protein extract. All samples were run at least in duplicate.
2D gel electrophoresis
replicates for each sample) were stained with SYPRO® Ruby according to the manufacturer’s protocol and ac-quired with a PROXPRESS 2D scanner (Perkin Elmer Life Sciences, Cambridge, UK). Preparative 2-DE gels were stained with colloidal Coomassie Blue (0.02% CBB G250), and Image Master Platinum 2D software was used for image analysis of analytical 2D gels as previ-ously described [16]. The fold change of protein expres-sion between the two classes (LaCl3 versus affinity micro-column) was calculated considering the mean of spot intensity (measured as the relative volumes of spots) of the 4 reference gels in each class.
1D gel electrophoresis
Two identical aliquots (0.5 mg) of the same pooled pro-tein lysate were treated with lanthanum chloride and micro-column, respectively, to isolate phosphoproteins. Phosphoproteins isolated with either method, and the corresponding flow-through derived from phosphopro-teins precipitation, were analyzed by 1D SDS-PAGE using homemade polyacrylamide/PDA (12,5% T/2,6% C) gel as previously described [16] and loading 10μg sam-ple in each lane. The proteins were stained following the manufacturer’s protocol for Pro-Q Diamond dye and gels were scanned with a PROXPRESS 2D scanner. Sub-sequently, after a rapid water washing step, the gels were counter stained directly with SYPRO Ruby dye and acquired.
Western blot
Ten μg of phosphoproteins isolated with either method from pooled protein lysate, and the corresponding flow-through derived from phosphoproteins precipitation, were analyzed by Western blot (WB) using an phospho-Serine/Threonine/Tyrosine monoclonal anti-bodies (Abcam, UK). Briefly, phosphoproteins were separated by 1D gel electrophoresis as previously de-scribed and blotted onto a nitrocellulose membrane. After the transfer (100 V, 1 h) the membrane was blocked in 5% BSA (PBS-T 0.1%) for 1 h at room temperature and then incubated overnight with primary anti-phospho-Ser/Thr/ Tyr at 4°C. Signal band development and densitometric analysis were performed as described [16].
Dephosphorylation of PBMCs proteins
Two identical aliquots of a pool of PBMCs’protein lysate (500 ug) were obtained by adding 500 μL RIPA buffer with 10μL endonucleases, and 5μL of the only protease inhibitors to PBMC pellet from two healthy individuals. Protein lysates were incubated with 700 U of alkaline phosphatase at pH 9, at 37°C for 16 hours. After that, the two aliquots were adjusted to pH7.4 with 0.6 N HCl and immediately treated with lanthanum chloride and the micro-column, respectively, as above described in
the Isolation of phosphoproteins paragraph. The entire amount of isolated protein, were assayed by Bradford method, separated on 1D-gel and sequentially stained with ProQ and Sypro dyes, as above described in the1D
gel electrophoresisparagraph.
MALDI-TOF MS/MS analysis
After trypsin digestion [16], the peptide mixture of the selected protein spots was loaded onto the pre-spotted anchor chip (PAC, Bruker Daltonics, Bremen, Germany) and mass spectra were acquired on Autoflex III™ TOF/ TOF200 instrument (Bruker Daltonics) as previously described [17]. Protein identification was achieved by database search via Biotools 3.2 and MASCOT search al-gorithm (http://www.matrixscience.com) against the MSDB, NCBInr and Swissprot databases using the fol-lowing parameters: Homo Sapiens as taxonomic cat-egory, trypsin as enzyme, carbamidomethyl as fixed modification for cysteine residues, oxidation of methio-nine as variable modification, and one missing cleavage and 100 ppm as mass tolerance for the monoisotopic peptide masses and 0.3 Da mass tolerance for MS/MS analysis. Protein identifications were considered to be confident when the protein score of the hit exceeded the threshold significance score of 56 for PMF (p<0.05) and 27 (p<0.05) for MS/MS data, first“hit” protein was se-lected. The tryptic peptide mixture was further analyzed using a matrix combination of 2,6-dihydroxyacetophe-none (DHAP)/diammonium hydrogen citrate (DAHC) (1/30) [18], loaded on MTP384 ground steel target (Bru-ker Daltonics) and acquired (Additional file 1). Phospho-site (http://www.phosphoPhospho-site.org) was used to recognize the known phosphorylation sites, while NetPhos 2.0 Ser-ver was used to predict the phosphorylation sites of the identified proteins reported in Table 1.
Statistical analysis
The results of the quantitative variables were expressed as mean ± SD. Differences between quantitative variables were tested by the Mann–Whitney U-test. P-values 0.05 were considered statistically significant. The Statview soft-ware package, SAS (5.0 version) was used for all analyses.
Additional file
Additional file 1:Protein Identification by MALDI-TOF-MS/MS analysis.
Abbreviations
DHAP:2,6-dihydroxyacetophenone; DAHC: Diammonium hydrogen citrate; MW: Molecular weight.
Competing interest
Authors’contributions
MTR conceived and designed the study, carried out the proteomic analyses, analyzed data and drafted the manuscript; MA carried out the proteomic analysis, participated in the study design, revised the manuscript; LV carried out sample collection and processing, revised the manuscript; SDP participated in the study design, helped to draft and critically revised the manuscript; MP critically revised the manuscript; ER critically revised the manuscript; GG participated in the study design, helped to draft and critically revised the manuscript; LG participated in the study design and coordination and helped to draft the manuscript. All authors read and approved the final manuscript.
Acknowledgements
We thank Dr. Lucia Cuccurese for her technical support. The study was supported by the Grants: Italian Ministry of Health (RicercaFinalizzata2009) to G.G. and L.G.; Ministry of Research and Education (FIRB2010-CAROMICS ) to L.G. and E.R.
Author details
1Department of Emergency and Organ Transplantation (DETO), Nephrology,
Dialysis and Transplantation Unit, University of Bari Aldo Moro, Piazza G. Cesare, 11, Bari 70124, Italy.2Department of Medical and Surgical Sciences, Proteomics and Mass Spectrometry Core Facility, University of Foggia, Foggia, Italy.3Department of Medical and Surgical Sciences, Nephrology, Dialysis and Transplantation Unit, University of Foggia, Foggia, Italy. 4Nephrology and Dialysis Unit, Hospital Dimiccoli, Barletta, Italy.5Clinical
Pathology Unit, Department of Medical and Surgical Sciences, University of Foggia, Foggia, Italy.
Received: 12 May 2014 Accepted: 14 August 2014
References
1. Reinders J, Sickmann A:State-of-the-art in phosphoproteomics.Proteomics
2005,5:4052–4061.
2. Mesko B, Poliska S, Nagy L:Gene expression profiles in peripheral blood for the diagnosis of autoimmune diseases.Trends Mol Med2011, 17:223–233.
3. Schulemberg B, Goodman TN, Aggeler R, Capaldi RA, Patton WF: Characterization of dynamic and steady-state protein phosphorylation using a fluorescent phosphoprotein gel stain and mass spectrometry.
Electrophoresis2004,25:2526–32.
4. Schmidt SR, Schweikart F, Andersson ME:Current methods for phosphoprotein isolation and enrichment.J Chromatogr B2007, 849:154–162.
5. Imam-Sghiouar N, Joubert-Caron R, Caron M:Application of metal-chelate affinity chromatography to the study of the phosphoproteome.Amino Acids2005,28:105–109.
6. Pink M, Verma N, Polato F, Bonn GK, Baba HA, Rettenmeier AW, Schmitz-Spanke S:Precipitation by lanthanum ions: a straightforward approach to isolating phosphoproteins.J Proteomics2011,75:375–383.
7. Adams M, Simms RJ, Abdelhamed Z, Dawe HR, Szymanska K, Logan CV, Wheway G, Pitt E, Gull K, Knowles MA, Blair E, Cross SH, Sayer JA, Johnson CA:A meckelin-filamin A interaction mediates ciliogenesis.Hum Mol Genet2012,21:1272–1286. doi:10.1093/hmg/ddr557.
8. Mayya V, Lundgren DH, Hwang SI, Rezaul K, Wu L, Eng JK, Rodionov V, Han DK:Quantitative phosphoproteomic analysis of T cell receptor signaling reveals system-wide modulation of protein-protein interactions.Sci Signal2009,2:RA46. doi:10.1126/scisignal.2000007.
9. Stetak A, Veress R, Ovadi J, Csermely P, Kéri G, Ullrich A:Nuclear translocation of the tumor marker pyruvate kinase M2 induces programmed cell death.Cancer Res2007,67:1602–1608. doi:10.1158/0008-5472.CAN-06-2870.
10. Honore C, Rorvig S, Hummelshoj T, Skjoedt MO, Borregaard N, Garred P: Tethering of Ficolin-1 to cell surfaces through recognition of sialic acid by the fibrinogen-like domain.J Leukoc Biol2010,88:145–158. doi:10.1189/ jlb.1209802.
11. Maccarone G, Rewerts C, Lebar M, Turck CW, Martins-de-Souza D:Proteome profiling of peripheral mononuclear cells from human blood.Proteomics
2013,13:893–897.
12. Maes E, Landuyt B, Mertens I, Schoofs L:Interindividual variation in the proteome of human peripheral blood mononuclear cells.PloS One2013, 8:e61933.
13. Pavon EJ, Garcia-Rodriguez S, Zumaquero E, Perandres-lopez R, Rosal-Vela A, Lario A, Longobardo V, Carrascal M, Abiàn J, Callejas-Rubio JL, Ortego-Centeno N, Zubiaur M, Sancho J:Increased expression and phosphoryl-ation of the two S100A9 isoforms in mononuclear cells from patients with systemic lupus erythematosus: A proteomic signature for circulating low-density granulocytes.J Proteomics2012,75:1778–1791.
14. Vergara D, Chiriaco F, Acierno R, Maffia M:Proteomic map of peripheral blood mononuclear cells.Proteomics2008,8:2045–2051.
15. Husberg C, Agnetti G, Holewinski RJ, Christensen G, Van Eyk JE: Dephosphorylation of cardiac proteins in vitro–a matter of phosphatase specificity.Proteomics2012,12:973–978.
16. Rocchetti MT, Centra M, Papale M, Bortone G, Palermo C, Centonze D, Ranieri E, Di Paolo S, Gesualdo L:Urine protein profile of IgA nephropathy patients may predict the response to ACE-inhibitor therapy.Proteomics
2008,8:206–216.
17. Rocchetti MT, Papale M, d’Apollo AM, Suriano IV, Dipalma AM, Vocino G, Montemurno E, Varraso L, Grandaliano G, Di Paolo S, Gesualdo L:Decrease of perlecan LG3 peptide and free k-light chains urine excretion in IgA nephropathy: new insights for a non-invasive evaluation of disease activity and injury.Clin J Am Soc Nephrol2013,8:1115–1125. 18. Hou J, Xie Z, Xue P, Cui Z, Chen X, Li J, Cai T, Wu P, Yang F:Enhanced
MALDI-TOF MS analysis of phosphopeptides using an optimized DHAP/ DAHC matrix.J Biomed Biotechnol2010,2010:759690. 12 pages, doi:10.1155/2010/759690.
doi:10.1186/s12953-014-0046-1
Cite this article as:Rocchettiet al.:Two dimensional gel
phosphoproteome of peripheral blood mononuclear cells: comparison between two enrichment methods.Proteome Science201412:46.
Submit your next manuscript to BioMed Central and take full advantage of:
• Convenient online submission
• Thorough peer review
• No space constraints or color figure charges
• Immediate publication on acceptance
• Inclusion in PubMed, CAS, Scopus and Google Scholar
• Research which is freely available for redistribution